WARNING: Version 5.5 of Kibana has passed its EOL date.
This documentation is no longer being maintained and may be removed. If you are running this version, we strongly advise you to upgrade. For the latest information, see the current release documentation.
Getting Started
editGetting Started
editThe Search Profiler is automatically enabled when you install X-Pack into Kibana. It is located under the Dev Tools tab in Kibana
-
Open Kibana in your web browser and log in. If you are running Kibana
locally, go to
http://localhost:5601/. -
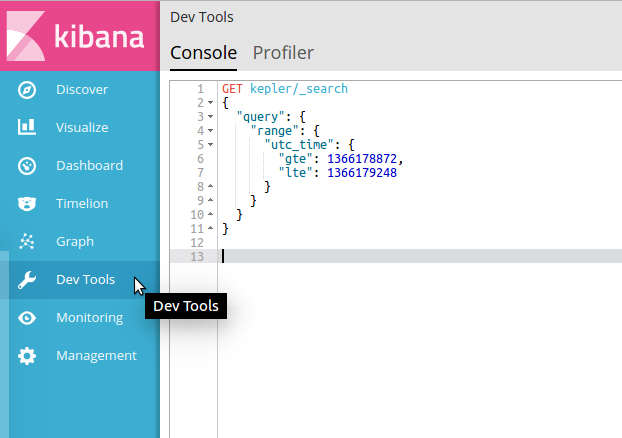
Click DevTools in the side navigation to open the Search Profiler. Console is the default tool to open when first accessing DevTools.
On the top navigation bar, click the second item: Search Profiler
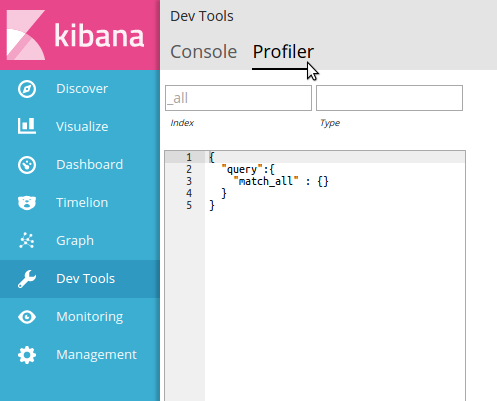
-
This opens the Search Profiler interface.
-
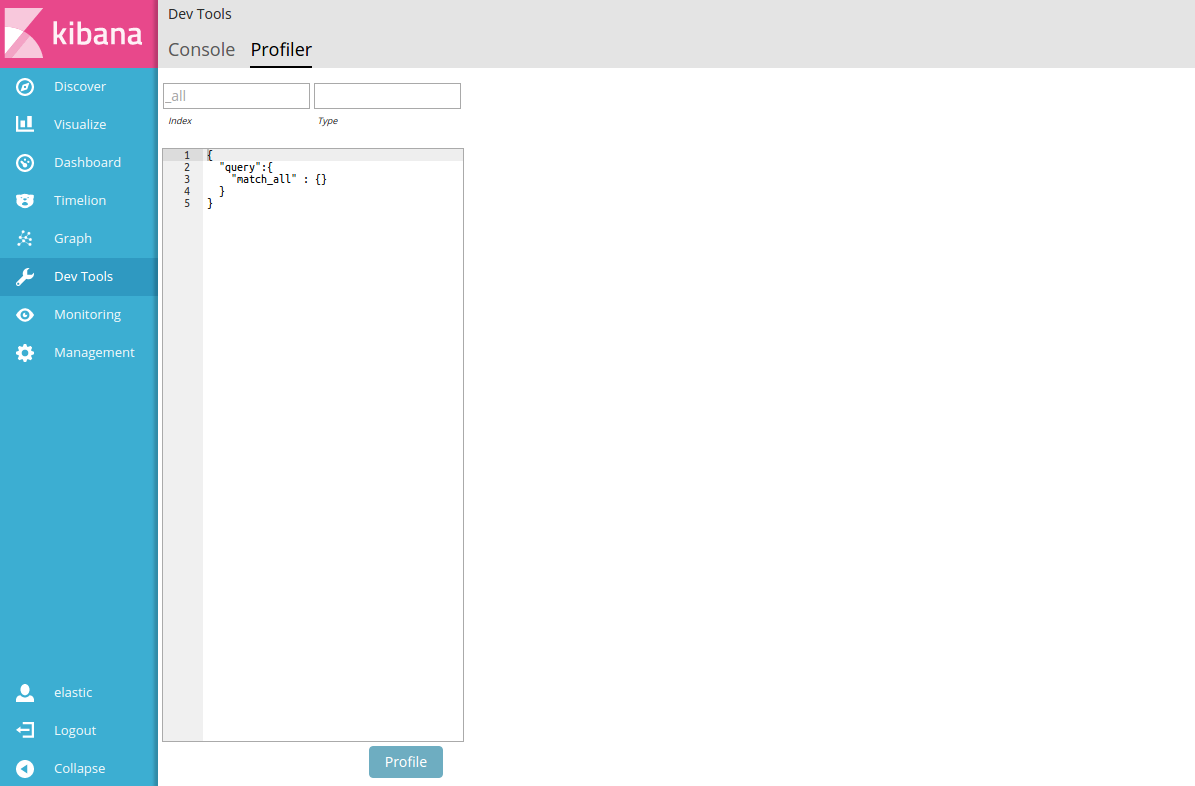
Replace the default
match_allquery with the query you want to profile and click Profile.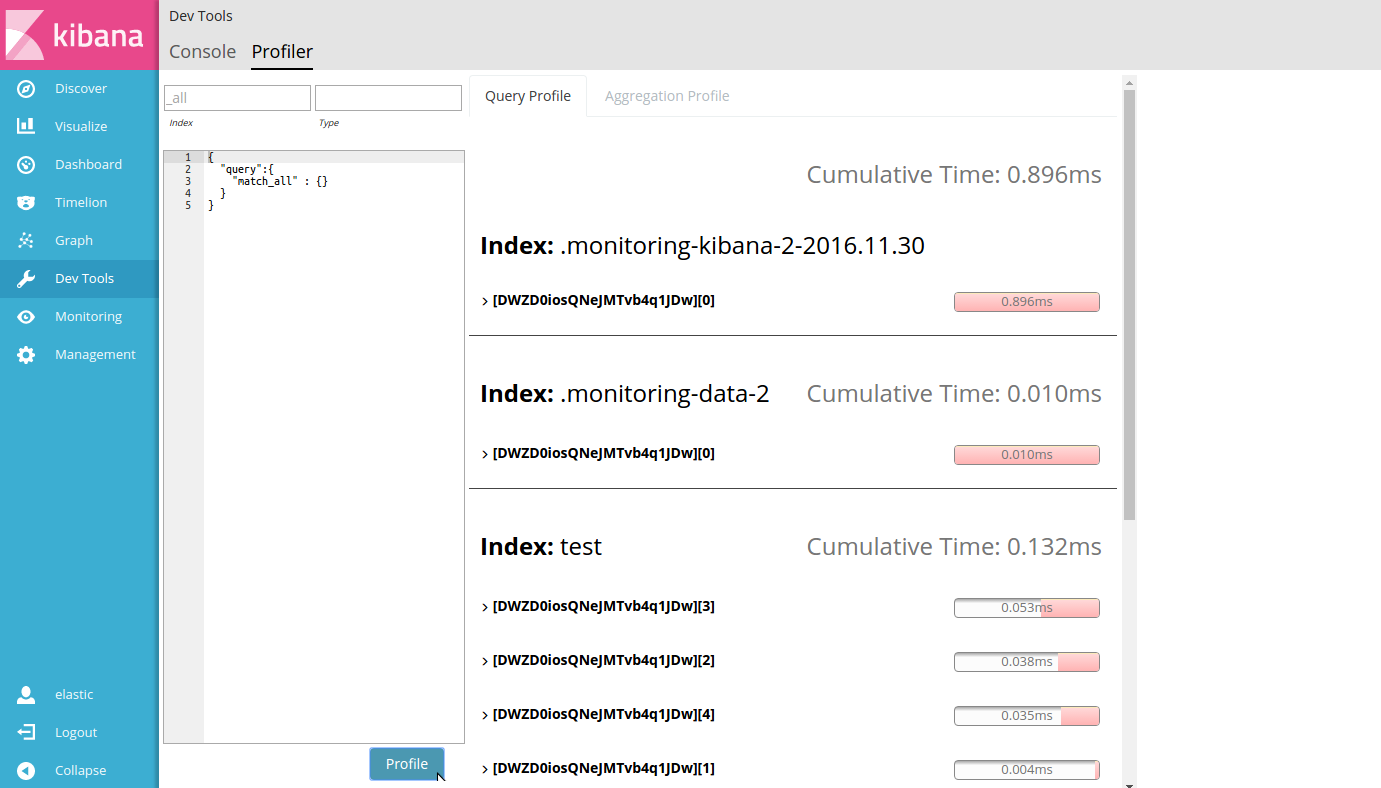
Search Profiler displays the names of the indices searched, the shards in each index, and how long the query took. The following example shows the results of profiling the match_all query. Three indices were searched:
.monitoring-kibana-2-2016.11.30,.monitoring-data-2andtest.If we take a closer look at the information for the test index, we can see from the Cumulative Time that the query took 0.132ms to execute. Of the five shards in the index (
DWZD0iosQNeJMTvb4q1JDw0 through 5), shard 3 was the slowest (0.053ms), followed by shard 2 (0.038ms). Shards are sorted by their time in descending order.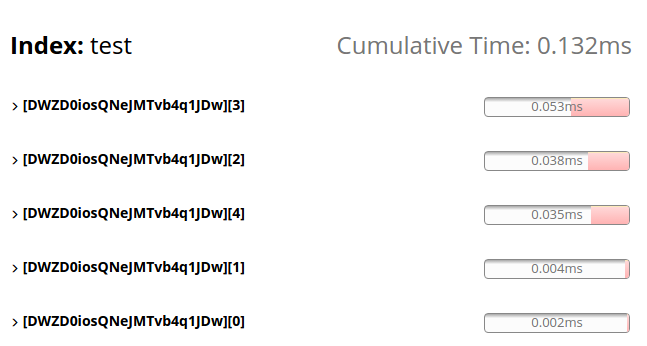
The Cumulative Time metric is the sum of individual shard times. It is not necessarily the actual time it took for the query to return (wall clock time). Because shards might be processed in parallel on multiple nodes, the wall clock time can be significantly less than the Cumulative Time. However, if shards are colocated on the same node and executed serially, the wall clock time is closer to the Cumulative Time.
While the Cumulative Time metric is useful for comparing the performance of your indices and shards, it doesn’t necessarily represent the actual physical query times.
-
To view more detailed profiling information for a shard, click the Expand button. This displays details about the query component(s) that ran on the shard.
In this example, there is a single
"MatchAllDocsQuery"that ran on the shard. Since it was the only query run, it took 100% of the time. When you mouse over a row, the Search Profiler displays additional information about the query component."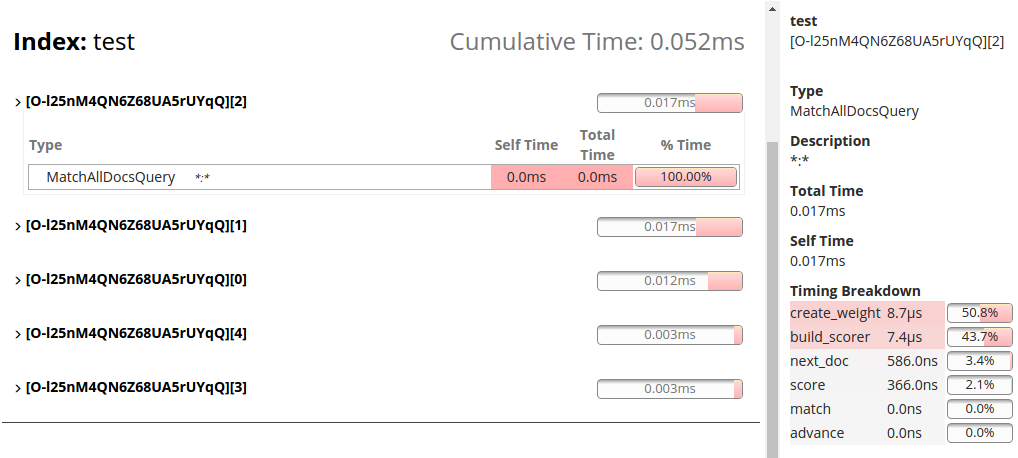
This panel shows the timing breakdown of low-level Lucene methods. For more information, see the reference docs for Timing Breakdown.