WARNING: Version 4.5 of Kibana has passed its EOL date.
This documentation is no longer being maintained and may be removed. If you are running this version, we strongly advise you to upgrade. For the latest information, see the current release documentation.
Dashboard
editDashboard
editA Kibana dashboard displays a set of saved visualizations in groups that you can arrange freely. You can save a dashboard to share or reload at a later time.
Sample dashboard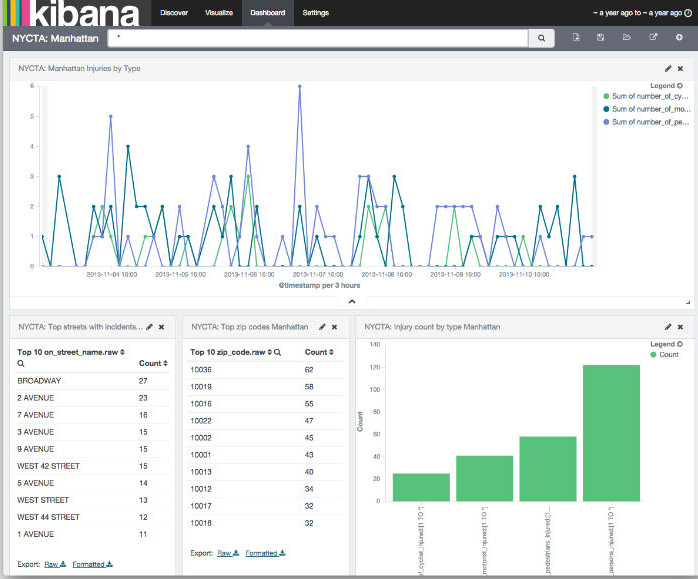
Getting Started
editYou need at least one saved visualization to use a dashboard.
Building a New Dashboard
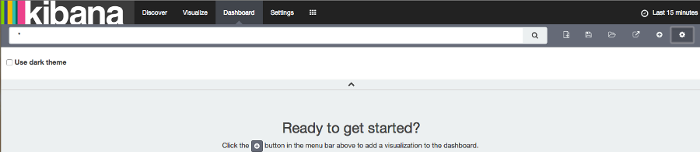
editThe first time you click the Dashboard tab, Kibana displays an empty dashboard.
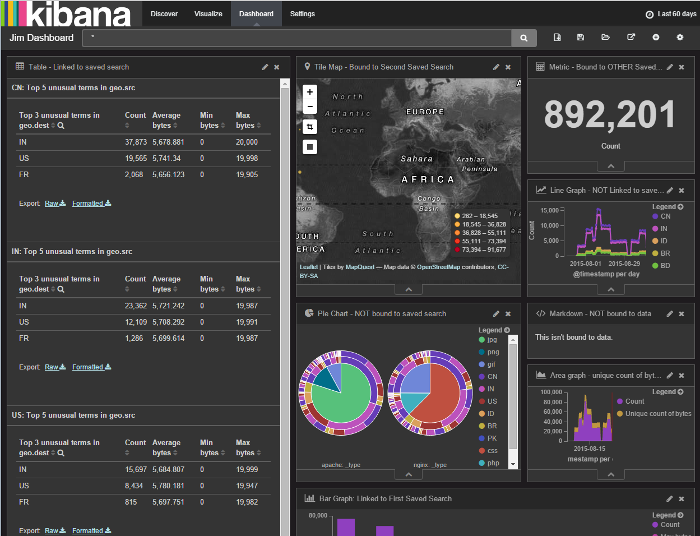
Build your dashboard by adding visualizations. By default, Kibana dashboards use a light color theme. To use a dark color
theme instead, click the Settings  button and check the Use dark theme box.
You can change the default theme in the Advanced section of the Settings tab.
Automatically Refreshing the Page
editYou can configure a refresh interval to automatically refresh the page with the latest index data. This periodically resubmits the search query.
When a refresh interval is set, it is displayed to the left of the Time Filter in the menu bar.
To set the refresh interval:
-
Click the Time Filter
 in the upper right corner of the menu bar.
- Click the Refresh Interval tab.
- Choose a refresh interval from the list.
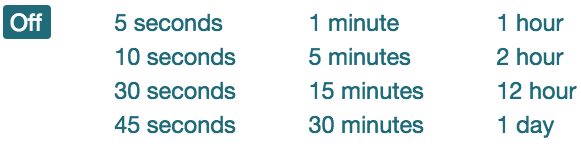
To automatically refresh the data, click the  Auto-refresh button and select an
autorefresh interval:
Auto-refresh button and select an
autorefresh interval:
When auto-refresh is enabled, Kibana’s top bar displays a pause button and the auto-refresh interval:
 . Click the Pause button to pause auto-refresh.
Adding Visualizations to a Dashboard
editTo add a visualization to the dashboard, click the Add Visualization  button in the
toolbar panel. Select a saved visualization from the list. You can filter the list of visualizations by typing a filter
string into the Visualization Filter field.
button in the
toolbar panel. Select a saved visualization from the list. You can filter the list of visualizations by typing a filter
string into the Visualization Filter field.
The visualization you select appears in a container on your dashboard.
If you see a message about the container’s height or width being too small, resize the container.
Saving Dashboards
editTo save the dashboard, click the Save Dashboard button in the toolbar panel, enter a name for the dashboard in the Save As field, and click the Save button. By default, dashboards store the time period specified in the time filter when you save a dashboard. To disable this behavior, clear the Store time with dashboard box before clicking the Save button.
Loading a Saved Dashboard
editClick the Load Saved Dashboard button to display a list of existing dashboards. The saved dashboard selector includes a text field to filter by dashboard name and a link to the Object Editor for managing your saved dashboards. You can also access the Object Editor by clicking Settings > Edit Saved Objects.
Sharing Dashboards
editYou can share dashboards with other users. You can share a direct link to the Kibana dashboard or embed the dashboard in your Web page.
A user must have Kibana access in order to view embedded dashboards.
To share a dashboard, click the Share button  to display the Sharing panel.
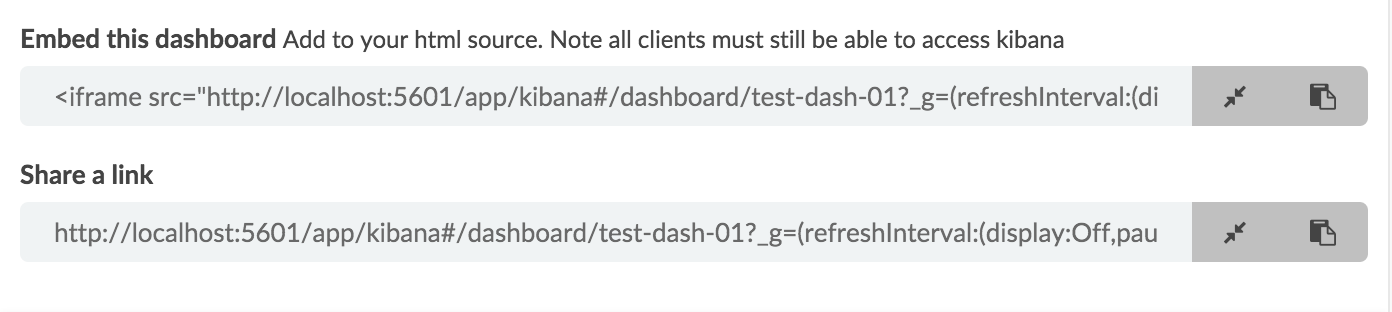
Click the Copy to Clipboard button  to copy the native URL or embed HTML to the clipboard.
Click the Generate short URL button
to copy the native URL or embed HTML to the clipboard.
Click the Generate short URL button  to create a shortened URL for sharing or
embedding.
to create a shortened URL for sharing or
embedding.
Embedding Dashboards
editTo embed a dashboard, copy the embed code from the Share display into your external web application.
Customizing Dashboard Elements
editThe visualizations in your dashboard are stored in resizable containers that you can arrange on the dashboard. This section discusses customizing these containers.
Moving Containers
editClick and hold a container’s header to move the container around the dashboard. Other containers will shift as needed to make room for the moving container. Release the mouse button to confirm the container’s new location.
Resizing Containers
editMove the cursor to the bottom right corner of the container until the cursor changes to point at the corner. After the cursor changes, click and drag the corner of the container to change the container’s size. Release the mouse button to confirm the new container size.
Removing Containers
editClick the x icon at the top right corner of a container to remove that container from the dashboard. Removing a container from a dashboard does not delete the saved visualization in that container.
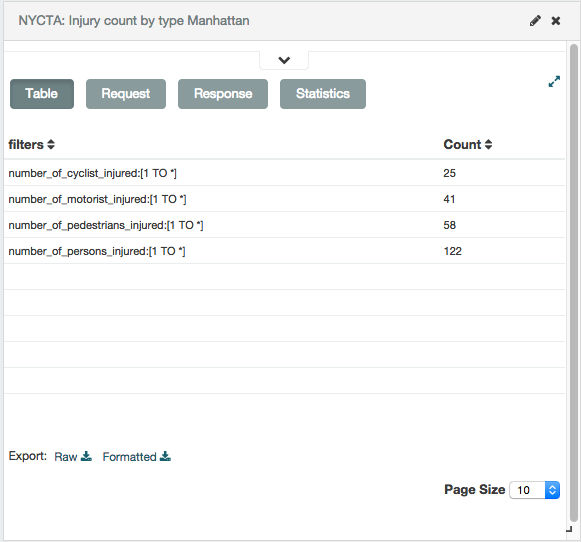
Viewing Detailed Information
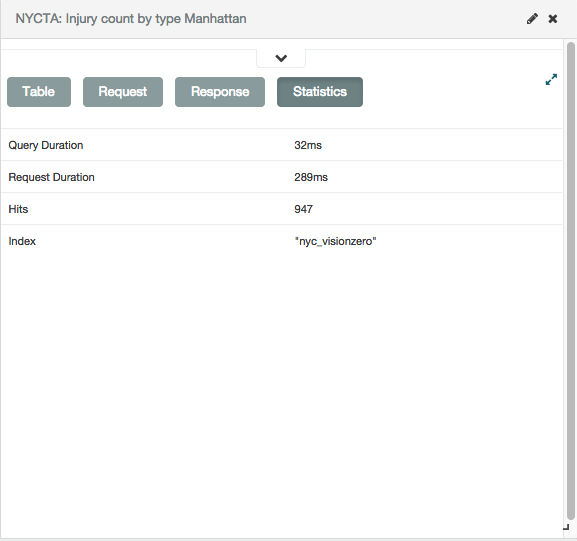
editTo display the raw data behind the visualization, click the bar at the bottom of the container. Tabs with detailed information about the raw data replace the visualization, as in this example:
TableA representation of the underlying data, presented as a paginated data grid. You can sort the items
in the table by clicking on the table headers at the top of each column.
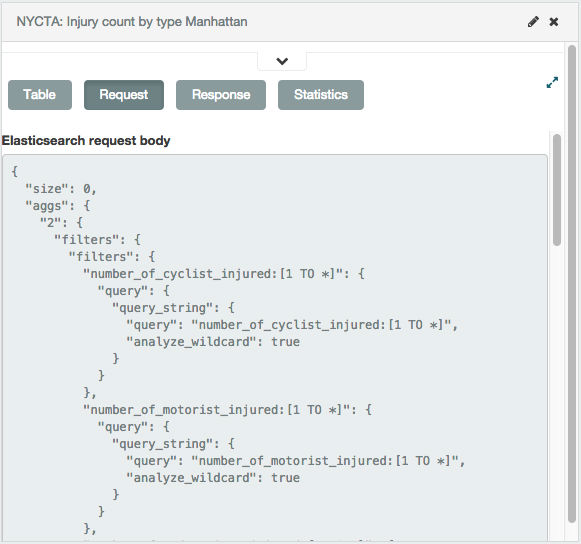
RequestThe raw request used to query the server, presented in JSON format.
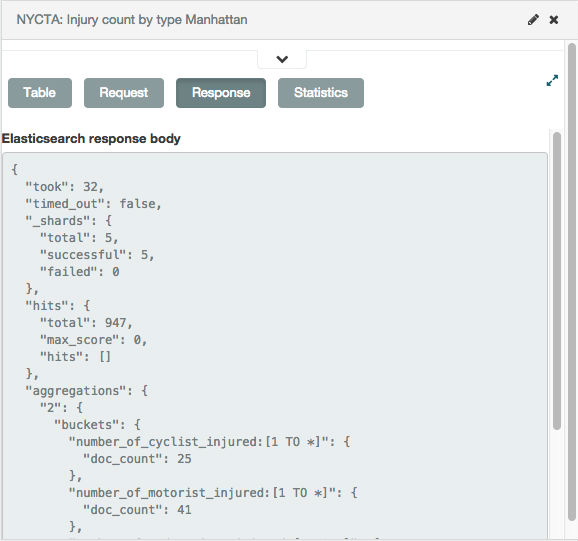
ResponseThe raw response from the server, presented in JSON format.
StatisticsA summary of the statistics related to the request and the response, presented as a data grid. The data
grid includes the query duration, the request duration, the total number of records found on the server, and the
index pattern used to make the query.
To export the raw data behind the visualization as a comma-separated-values (CSV) file, click on either the Raw or Formatted links at the bottom of any of the detailed information tabs. A raw export contains the data as it is stored in Elasticsearch. A formatted export contains the results of any applicable Kibana [field formatters].
Changing the Visualization
editClick the Edit button  at the top right of a container to open the
visualization in the Visualize page.
at the top right of a container to open the
visualization in the Visualize page.
Working with Filters
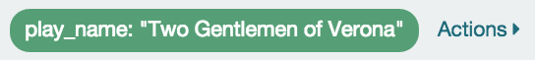
editWhen you create a filter anywhere in Kibana, the filter conditions display in a green oval under the search text entry box:
Hovering on the filter oval displays the following icons:

-
Enable Filter

- Click this icon to disable the filter without removing it. You can enable the filter again later by clicking the icon again. Disabled filters display a striped shaded color, green for inclusion filters and red for exclusion filters.
-
Pin Filter

- Click this icon to pin a filter. Pinned filters persist across Kibana tabs. You can pin filters from the Visualize tab, click on the Discover or Dashboard tabs, and those filters remain in place. NOTE: If you have a pinned filter and you’re not seeing any query results, that your current tab’s index pattern is one that the filter applies to.
-
Toggle Filter

- Click this icon to toggle a filter. By default, filters are inclusion filters, and display in green. Only elements that match the filter are displayed. To change this to an exclusion filters, displaying only elements that don’t match, toggle the filter. Exclusion filters display in red.
-
Remove Filter

- Click this icon to remove a filter entirely.
-
Custom Filter

-
Click this icon to display a text field where you can customize the JSON representation of the filter and specify an alias to use for the filter name:
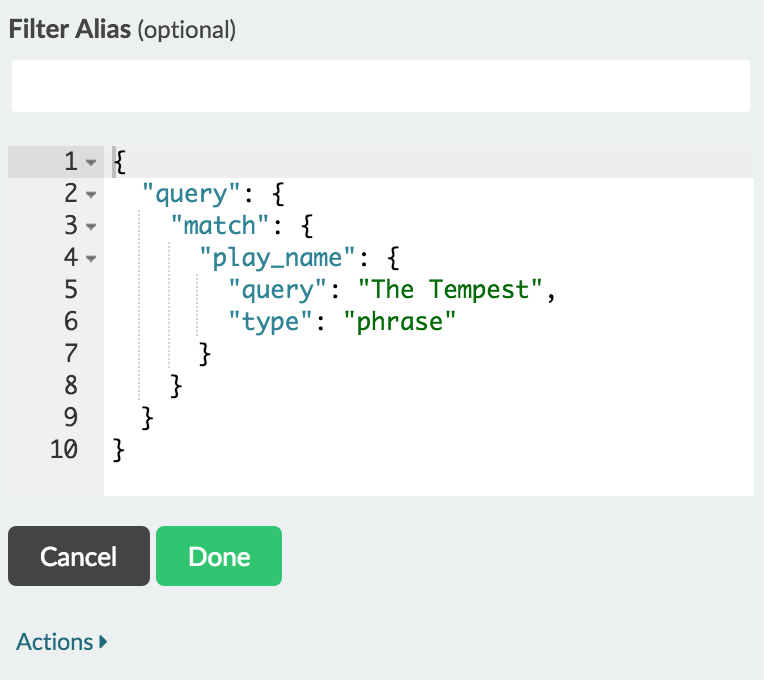
You can use JSON filter representation to implement predicate logic, with
shouldfor OR,mustfor AND, andmust_notfor NOT:Example 7. OR Example
{
  "bool": {
    "should": [
      {
        "term": {
          "geoip.country_name.raw": "Canada"
        }
      },
      {
        "term": {
          "geoip.country_name.raw": "China"
        }
      }
    ]
  }
}
Example 8. AND Example
{
  "bool": {
    "must": [
      {
        "term": {
          "geoip.country_name.raw": "United States"
        }
      },
      {
        "term": {
          "geoip.city_name.raw": "New York"
        }
      }
    ]
  }
}
Example 9. NOT Example
{
  "bool": {
    "must_not": [
      {
        "term": {
          "geoip.country_name.raw": "United States"
        }
      },
      {
        "term": {
          "geoip.country_name.raw": "Canada"
        }
      }
    ]
  }
}
Click the Done button to update the filter with your changes.
To apply any of the filter actions to all the filters currently in place, click the  Global Filter Actions button and select an action.