WARNING: Version 4.4 of Kibana has passed its EOL date.
This documentation is no longer being maintained and may be removed. If you are running this version, we strongly advise you to upgrade. For the latest information, see the current release documentation.
Discover
editDiscover
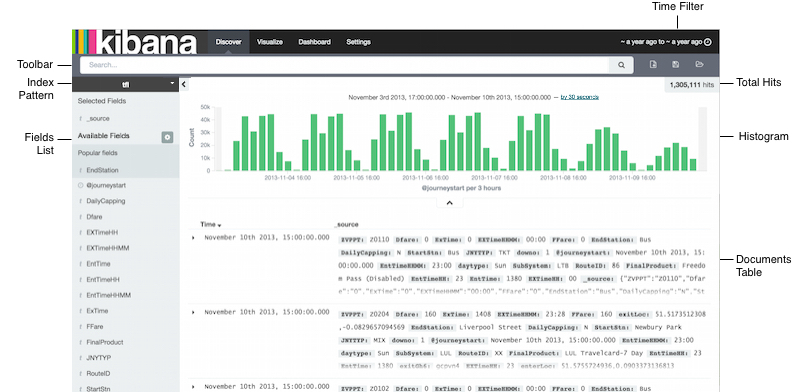
editYou can interactively explore your data from the Discover page. You have access to every document in every index that matches the selected index pattern. You can submit search queries, filter the search results, and view document data. You can also see the number of documents that match the search query and get field value statistics. If a time field is configured for the selected index pattern, the distribution of documents over time is displayed in a histogram at the top of the page.
Setting the Time Filter
editThe Time Filter restricts the search results to a specific time period. You can set a time filter if your index contains time-based events and a time-field is configured for the selected index pattern.
By default the time filter is set to the last 15 minutes. You can use the Time Picker to change the time filter or select a specific time interval or time range in the histogram at the top of the page.
To set a time filter with the Time Picker:
- Click the Time Filter displayed in the upper right corner of the menu bar to open the Time Picker.
- To set a quick filter, simply click one of the shortcut links.
- To specify a relative Time Filter, click Relative and enter the relative start time. You can specify the relative start time as any number of seconds, minutes, hours, days, months, or years ago.
- To specify an absolute Time Filter, click Absolute and enter the start date in the From field and the end date in the To field.
- Click the caret at the bottom of the Time Picker to hide it.
To set a Time Filter from the histogram, do one of the following:
- Click the bar that represents the time interval you want to zoom in on.
- Click and drag to view a specific timespan. You must start the selection with the cursor over the background of the chart—the cursor changes to a plus sign when you hover over a valid start point.
You can use the browser Back button to undo your changes.
The histogram lists the time range you’re currently exploring, as well as the intervals that range is currently using. To change the intervals, click the link and select an interval from the drop-down. The default behavior automatically sets an interval based on the time range.
Searching Your Data
editYou can search the indices that match the current index pattern by submitting a search from the Discover page. You can enter simple query strings, use the Lucene query syntax, or use the full JSON-based Elasticsearch Query DSL.
When you submit a search, the histogram, Documents table, and Fields list are updated to reflect the search results. The total number of hits (matching documents) is shown in the upper right corner of the histogram. The Documents table shows the first five hundred hits. By default, the hits are listed in reverse chronological order, with the newest documents shown first. You can reverse the sort order by by clicking on the Time column header. You can also sort the table using the values in any indexed field. For more information, see Sorting the Documents Table.
To search your data:
-
Enter a query string in the Search field:
-
To perform a free text search, simply enter a text string. For example, if you’re searching web server logs, you
could enter
safarito search all fields for the termsafari. -
To search for a value in a specific field, you prefix the value with the name of the field. For example, you could
enter
status:200to limit the results to entries that contain the value200in thestatusfield. -
To search for a range of values, you can use the bracketed range syntax,
[START_VALUE TO END_VALUE]. For example, to find entries that have 4xx status codes, you could enterstatus:[400 TO 499]. -
To specify more complex search criteria, you can use the Boolean operators
AND,OR, andNOT. For example, to find entries that have 4xx status codes and have an extension ofphporhtml, you could enterstatus:[400 TO 499] AND (extension:php OR extension:html).These examples use the Lucene query syntax. You can also submit queries using the Elasticsearch Query DSL. For examples, see query string syntax in the Elasticsearch Reference.
-
To perform a free text search, simply enter a text string. For example, if you’re searching web server logs, you
could enter
- Press Enter or click the Search button to submit your search query.
Starting a New Search
editTo clear the current search and start a new search, click the New Search button in the Discover toolbar.

Saving a Search
editYou can reload saved searches on the Discover page and use them as the basis of visualizations. Saving a search saves both the search query string and the currently selected index pattern.
To save the current search:
-
Click the Save Search button
 in the Discover toolbar.
- Enter a name for the search and click Save.
Loading a Saved Search
editTo load a saved search:
-
Click the Load Search button
 in the Discover toolbar.
- Select the search you want to load.
If the saved search is associated with a different index pattern than is currently selected, loading the saved search also changes the selected index pattern.
Changing Which Indices You’re Searching
editWhen you submit a search request, the indices that match the currently-selected index pattern are searched. The current index pattern is shown below the search field. To change which indices you are searching, click the name of the current index pattern to display a list of the configured index patterns and select a different index pattern.
For more information about index patterns, see Creating an Index Pattern.
Automatically Refreshing the Page
editYou can configure a refresh interval to automatically refresh the page with the latest index data. This periodically resubmits the search query.
When a refresh interval is set, it is displayed to the left of the Time Filter in the menu bar.
To set the refresh interval:
-
Click the Time Filter
 in the upper right corner of the menu bar.
- Click the Refresh Interval tab.
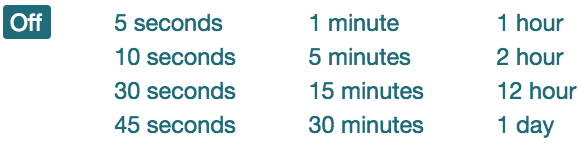
- Choose a refresh interval from the list.
To automatically refresh the data, click the  Auto-refresh button and select an
autorefresh interval:
Auto-refresh button and select an
autorefresh interval:
When auto-refresh is enabled, Kibana’s top bar displays a pause button and the auto-refresh interval:
 . Click the Pause button to pause auto-refresh.
Filtering by Field
editYou can filter the search results to display only those documents that contain a particular value in a field. You can also create negative filters that exclude documents that contain the specified field value.
You can add filters from the Fields list or from the Documents table. When you add a filter, it is displayed in the filter bar below the search query. From the filter bar, you can enable or disable a filter, invert the filter (change it from a positive filter to a negative filter and vice-versa), toggle the filter on or off, or remove it entirely. Click the small left-facing arrow to the right of the index pattern selection drop-down to collapse the Fields list.
To add a filter from the Fields list:
- Click the name of the field you want to filter on. This displays the top five values for that field. To the right of each value, there are two magnifying glass buttons—one for adding a regular (positive) filter, and one for adding a negative filter.
-
To add a positive filter, click the Positive Filter button
 .
This filters out documents that don’t contain that value in the field.
.
This filters out documents that don’t contain that value in the field.
-
To add a negative filter, click the Negative Filter button
 .
This excludes documents that contain that value in the field.
.
This excludes documents that contain that value in the field.
To add a filter from the Documents table:
-
Expand a document in the Documents table by clicking the Expand button
 to the left of the document’s entry in the first column (the first column is usually Time). To the right of each field
name, there are two magnifying glass buttons—one for adding a regular (positive) filter, and one for adding a negative
filter.
to the left of the document’s entry in the first column (the first column is usually Time). To the right of each field
name, there are two magnifying glass buttons—one for adding a regular (positive) filter, and one for adding a negative
filter.
-
To add a positive filter based on the document’s value in a field, click the
Positive Filter button . This filters out documents that don’t
contain the specified value in that field.
-
To add a negative filter based on the document’s value in a field, click the
Negative Filter button . This excludes documents that contain
the specified value in that field.
Working with Filters
editWhen you create a filter anywhere in Kibana, the filter conditions display in a green oval under the search text entry box:

Hovering on the filter oval displays the following icons:

-
Enable Filter

- Click this icon to disable the filter without removing it. You can enable the filter again later by clicking the icon again. Disabled filters display a striped shaded color, green for inclusion filters and red for exclusion filters.
-
Pin Filter

- Click this icon to pin a filter. Pinned filters persist across Kibana tabs. You can pin filters from the Visualize tab, click on the Discover or Dashboard tabs, and those filters remain in place. NOTE: If you have a pinned filter and you’re not seeing any query results, that your current tab’s index pattern is one that the filter applies to.
-
Toggle Filter

- Click this icon to toggle a filter. By default, filters are inclusion filters, and display in green. Only elements that match the filter are displayed. To change this to an exclusion filters, displaying only elements that don’t match, toggle the filter. Exclusion filters display in red.
-
Remove Filter

- Click this icon to remove a filter entirely.
-
Custom Filter

-
Click this icon to display a text field where you can customize the JSON representation of the filter and specify an alias to use for the filter name:
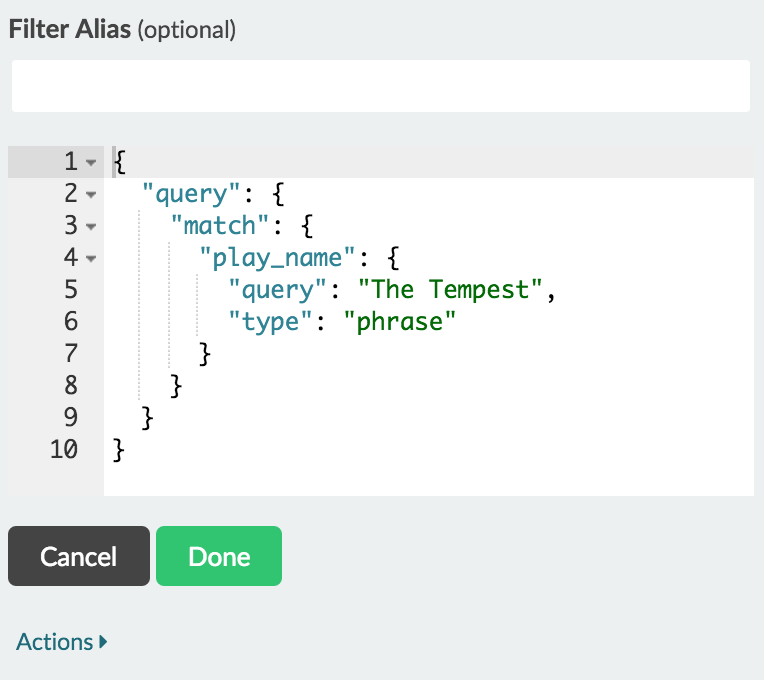
You can use JSON filter representation to implement predicate logic, with
shouldfor OR,mustfor AND, andmust_notfor NOT:Example 1. OR Example
{
  "bool": {
    "should": [
      {
        "term": {
          "geoip.country_name.raw": "Canada"
        }
      },
      {
        "term": {
          "geoip.country_name.raw": "China"
        }
      }
    ]
  }
}
Example 2. AND Example
{
  "bool": {
    "must": [
      {
        "term": {
          "geoip.country_name.raw": "United States"
        }
      },
      {
        "term": {
          "geoip.city_name.raw": "New York"
        }
      }
    ]
  }
}
Example 3. NOT Example
{
  "bool": {
    "must_not": [
      {
        "term": {
          "geoip.country_name.raw": "United States"
        }
      },
      {
        "term": {
          "geoip.country_name.raw": "Canada"
        }
      }
    ]
  }
}
Click the Done button to update the filter with your changes.
To apply any of the filter actions to all the filters currently in place, click the  Global Filter Actions button and select an action.
Viewing Document Data
editWhen you submit a search query, the 500 most recent documents that match the query are listed in the Documents table.
You can configure the number of documents shown in the table by setting the discover:sampleSize property in
Advanced Settings. By default, the table shows the localized version of the time field specified
in the selected index pattern and the document _source. You can add fields to the Documents table
from the Fields list. You can sort the listed documents by any indexed field that’s included in the table.
To view a document’s field data, click the Expand button to the left of
the document’s entry in the first column (the first column is usually Time). Kibana reads the document data from
Elasticsearch and displays the document fields in a table. The table contains a row for each field that contains the
name of the field, add filter buttons, and the field value.
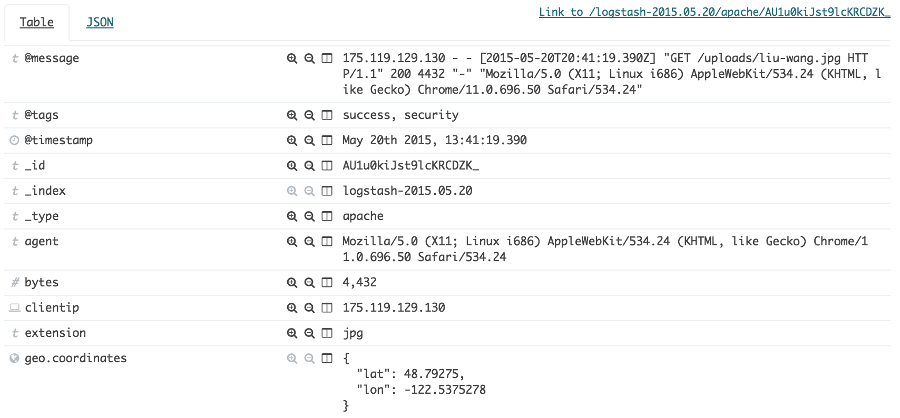
- To view the original JSON document (pretty-printed), click the JSON tab.
- To view the document data as a separate page, click the link. You can bookmark and share this link to provide direct access to a particular document.
-
To collapse the document details, click the Collapse button
 .
.
-
To toggle a particular field’s column in the Documents table, click the
 Toggle column in table button.
Sorting the Document List
editYou can sort the documents in the Documents table by the values in any indexed field. If a time field is configured for the selected index pattern, by default the documents are sorted in reverse chronological order.
To change the sort order:
- Click the name of the field you want to sort by. The fields you can use for sorting have a sort button to the right of the field name. Clicking the field name a second time reverses the sort order.
Adding Field Columns to the Documents Table
editBy default, the Documents table shows the localized version of the time field specified in the selected index pattern
and the document _source. You can add fields to the table from the Fields list or from a document’s expanded view.
To add field columns to the Documents table:
-
Mouse over a field in the Fields list and click its add button
 .
.
- Repeat until you’ve added all the fields you want to display in the Documents table.
-
Alternately, add a field column directly from a document’s expanded view by clicking the
Toggle column in table button.
The added field columns replace the _source column in the Documents table. The added fields are also
listed in the Selected Fields section at the top of the field list.
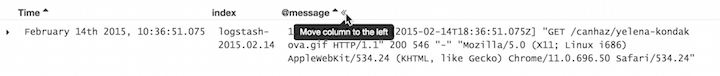
To rearrange the field columns in the table, mouse over the header of the column you want to move and click the Move button.
Removing Field Columns from the Documents Table
editTo remove field columns from the Documents table:
-
Mouse over the field you want to remove in the Selected Fields section of the Fields list and click its remove
button
 .
.
- Repeat until you’ve removed all the fields you want to drop from the Documents table.
Viewing Field Data Statistics
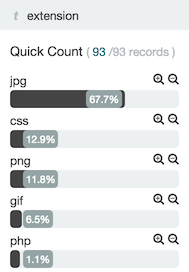
editFrom the field list, you can see how many documents in the Documents table contain a particular field, what the top 5 values are, and what percentage of documents contain each value.
To view field data statistics:
- Click the name of a field in the Fields list. The field can be anywhere in the Fields list—Selected Fields, Popular Fields, or the list of other fields.
To create a visualization based on the field, click the Visualize button below the field statistics.