IMPORTANT: No additional bug fixes or documentation updates
will be released for this version. For the latest information, see the
current release documentation.
Adding panels
edit
IMPORTANT: This documentation is no longer updated. Refer to Elastic's version policy and the latest documentation.
Adding panels
editFor now we’ll focus on the green button in the row controls. Give it a try. You can also click the grey button labeled Add panel to empty row, but it’s grey, and what fun is that?
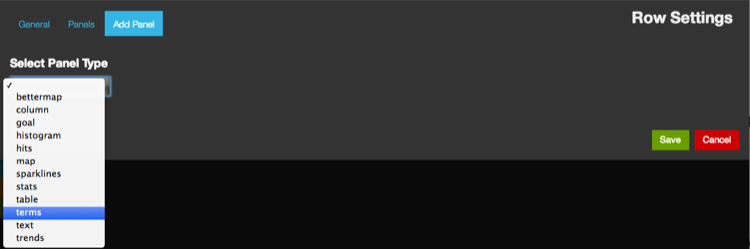
Let’s add a terms panel. The terms panel allows us to make use of the Elasticsearch terms facet to find the most popular values in a field.
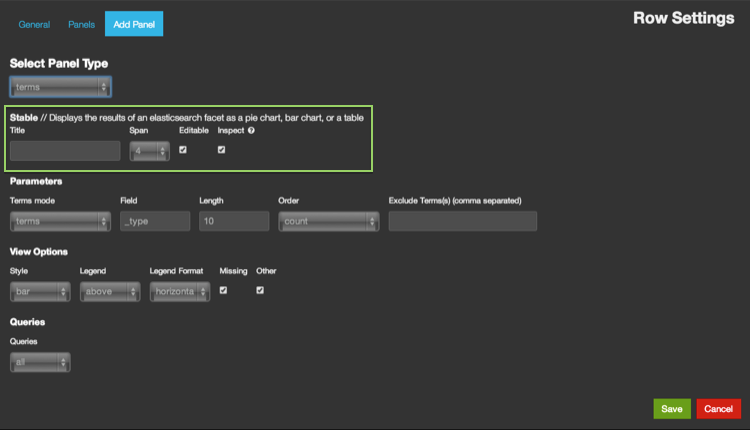
As you can see, the terms panel has a number of optional settings, however we’ll focus on the general settings in the first section for now:
- Title: The name for this panel
- Span: The width of the panel. Kibana dashboards are made of 12 equally sized spans. Panels can be up to 12 spans wide. Rows can contain more than a total of 12, with new panels wrapping to the next line. Leave this at 4 for now.
- Editable: If this panel is configurable later. Leave this checked for now.
- Inspectable: If the user can view the query used for this panel. Also leave this checked for now.
- Click Save to add your new terms panel to your dashboard
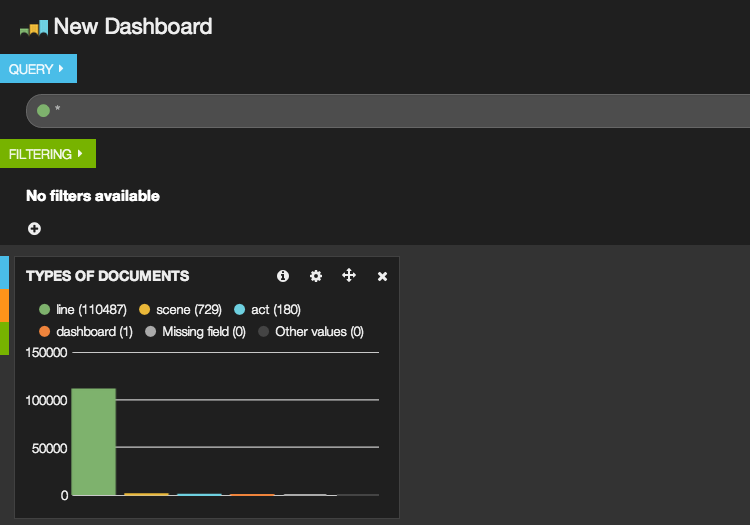
Great! Now you have a panel! You may recognize this breakdown of data
from the pie chart in Using Kibana for the first time. The shakespeare data set is comprised largely of lines of
speech, with a few markers between acts and scenes thrown in there.