IMPORTANT: No additional bug fixes or documentation updates
will be released for this version. For the latest information, see the
current release documentation.
Accessing the Kibana interface
edit
IMPORTANT: This documentation is no longer updated. Refer to Elastic's version policy and the latest documentation.
Accessing the Kibana interface
editNow that you have data, let’s do something with it. Point your browser at your local webserver, the one with Kibana already installed.
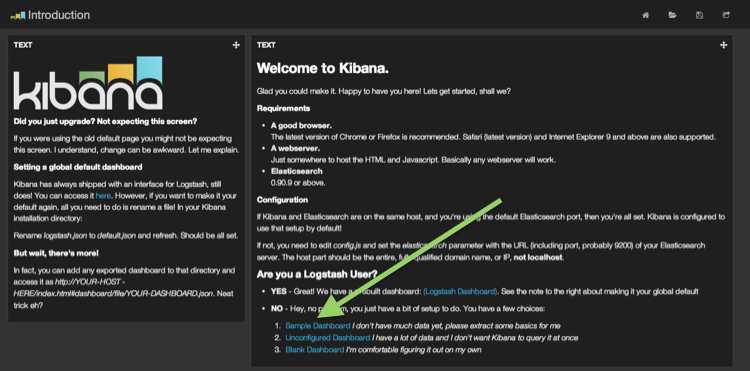
If you have Kibana extracted to your document root you will be presented with this lovely welcome page. Click Sample Dashboard
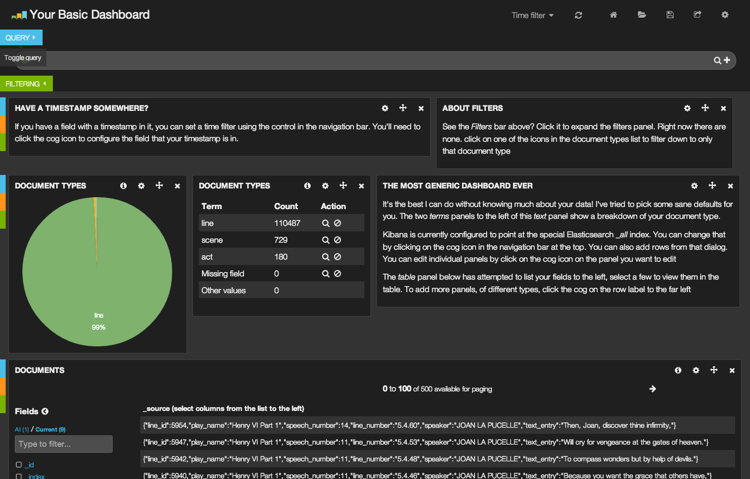 And there you have your
sample dashboard! Now if you started with a clean elasticsearch instance
you’ll see a very heavily weighted pie chart. This represents the type
of documents in your index. As you can see, 99% them are lines for
characters, with only a few denoting acts and scenes.
And there you have your
sample dashboard! Now if you started with a clean elasticsearch instance
you’ll see a very heavily weighted pie chart. This represents the type
of documents in your index. As you can see, 99% them are lines for
characters, with only a few denoting acts and scenes.
Below that you will see a long list of JSON formatted lines of shakespeare.