View Elastic Agent status
editView Elastic Agent status
editTo view the status of your Fleet-managed agents, go to Management > Fleet > Agents.
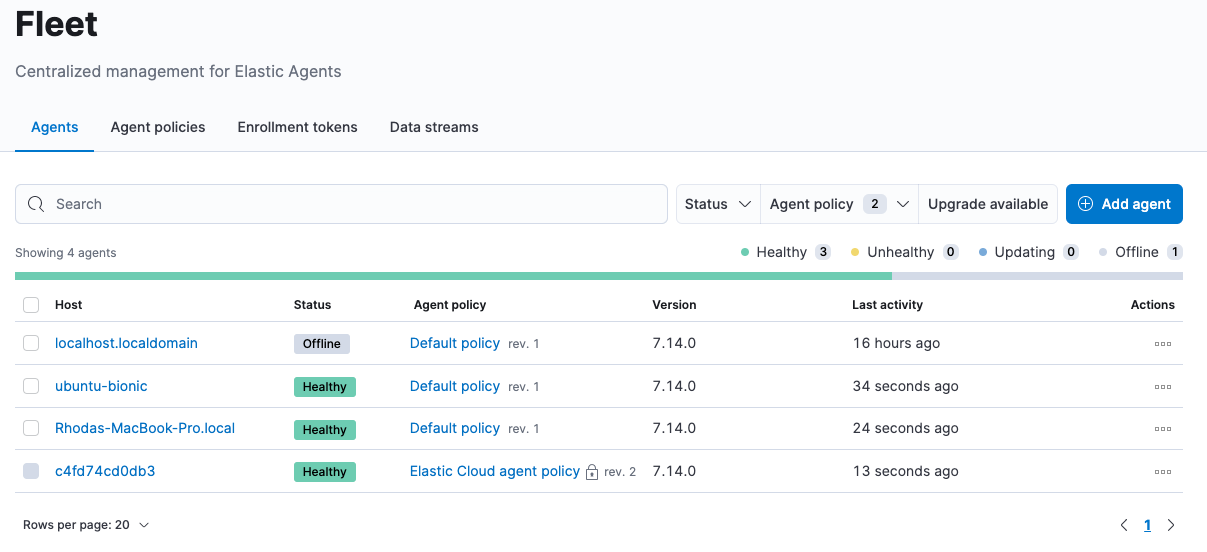
Fleet reports these statuses:
Healthy |
The Elastic Agent is online and running as expected. There are no agent policy updates or automatic agent binary updates in progress, but the agent binary may still be out of date. |
Unhealthy |
The Elastic Agent is online, but requires attention because it’s reporting either agent or integration-level errors. |
Updating |
The Elastic Agent is online and updating the agent policy, updating the binary, or enrolling or unenrolling from Fleet. |
Offline |
The Elastic Agent has not checked in during the expected time period. |
Inactive |
The Elastic Agent is no longer enrolled in Fleet. The agent must reenroll to connect to Fleet again. |
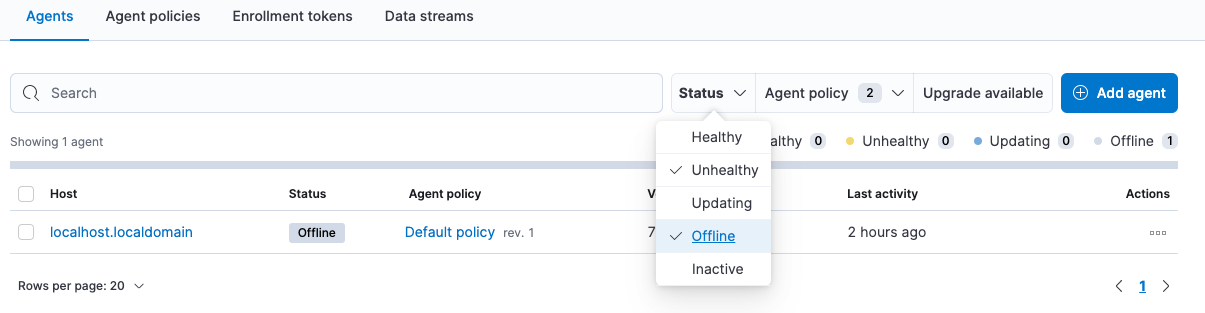
Filter the list of agents
editTo filter the list of agents by status, click the Status dropdown and select one or more statuses.
For advanced filtering, use the search bar to create structured queries
using Kibana Query Language. For example, enter
local_metadata.os.family : "darwin" to see only agents running on macOS.
View agent logs
editWhen Fleet reports a status like Offline or Unhealthy, you might want to
view the agent logs to diagnose potential causes. If logging is configured for
the agent:
- Under Agents, click the agent name listed in the Host column.
-
Click the Logs tab.
On the Logs tab you can filter, search, and explore the agent logs. You can also remotely turn on debug logging by changing the log level.
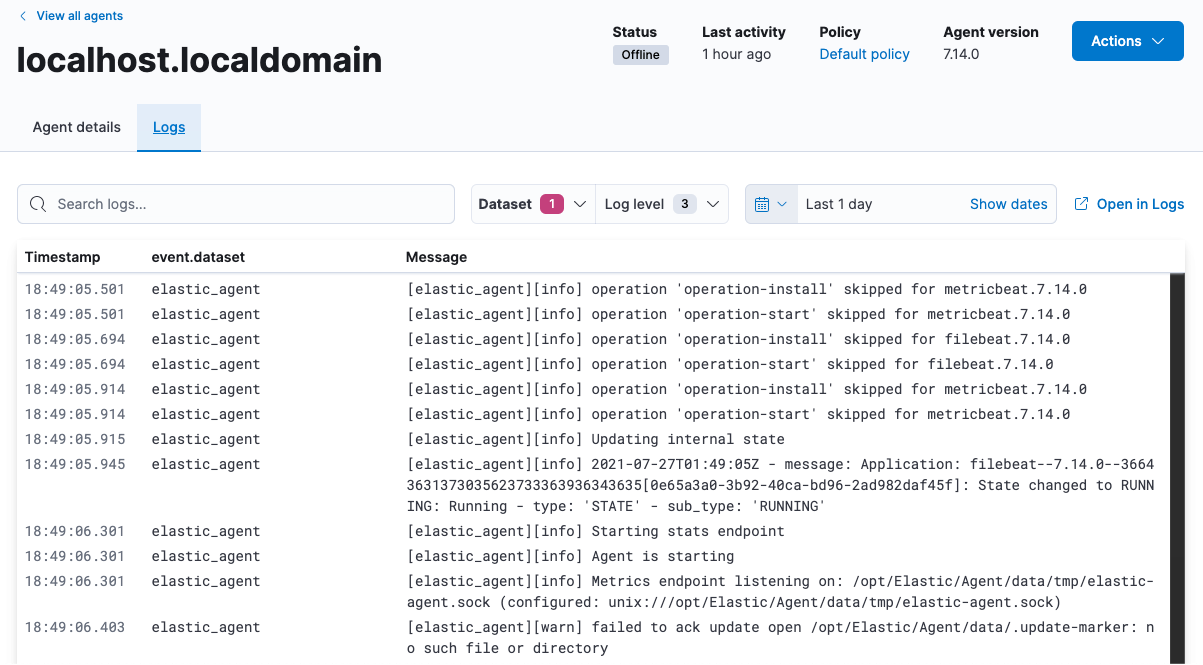
To tail the agent log files in real time, click Open in Logs.
For more information about logging, refer to: