Monitor a self-managed Fleet Server
editMonitor a self-managed Fleet Server
editFor self-managed Fleet Servers, monitoring is key because the operation of the Fleet Server is paramount to the health of the deployed agents and the services they offer. When Fleet Server is not operating correctly, it may lead to delayed check-ins, status information, and updates for the agents it manages. The monitoring data will tell you when to add capacity for Fleet Server, and provide error logs and information to troubleshoot other issues.
For self-managed clusters, monitoring is on by default when you create a new agent policy or use the existing Default Fleet Server agent policy.
To monitor Fleet Server:
- In Fleet, go to Agent Policies and click the Fleet Server agent policy.
- Click the Settings tab and verify that Collect agent logs and Collect agent metrics are selected.
-
Next, set the Default namespace to something like
fleetserver.Setting the default namespace lets you segregate Fleet Server monitoring data from other collected data. This makes it easier to search and visualize the monitoring data.
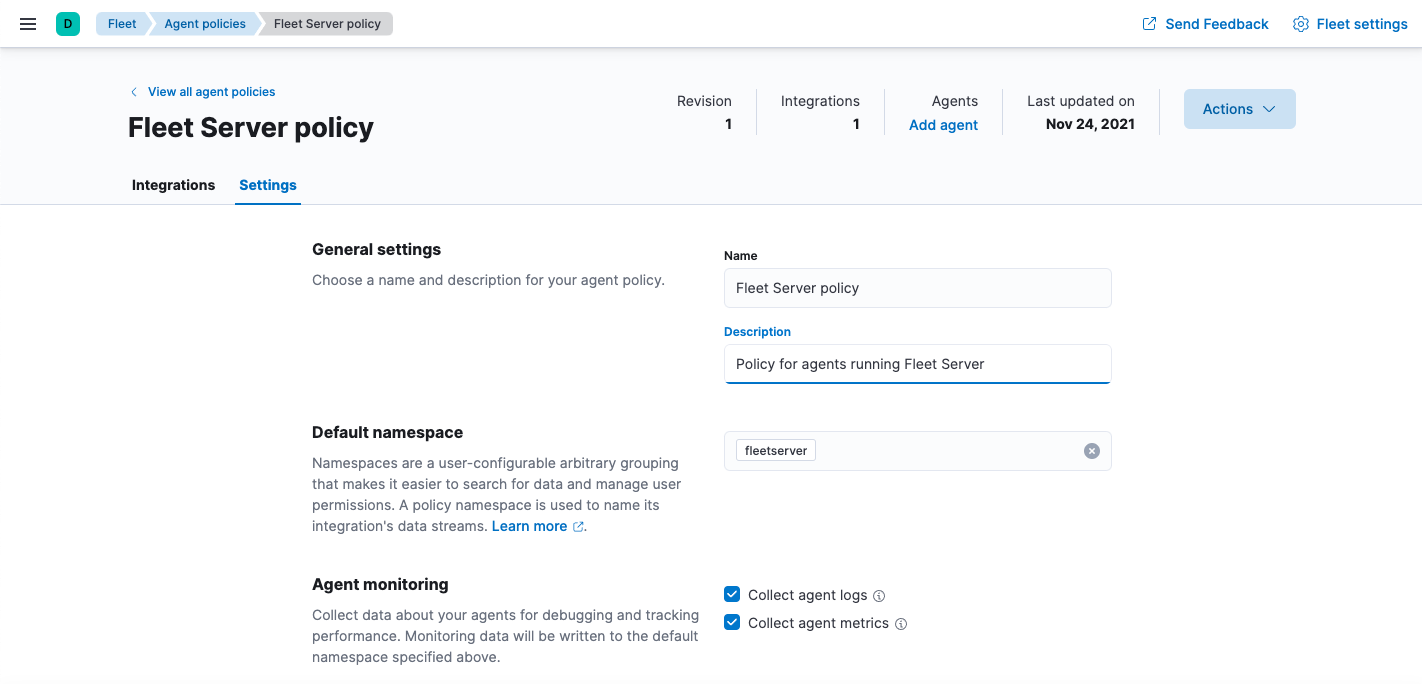
- To confirm your change, click Save changes.
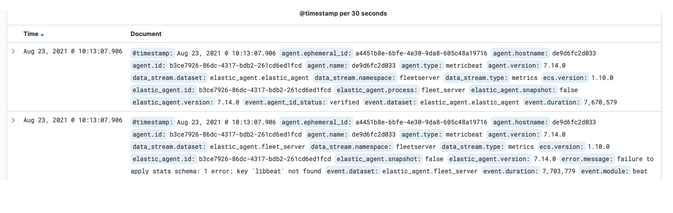
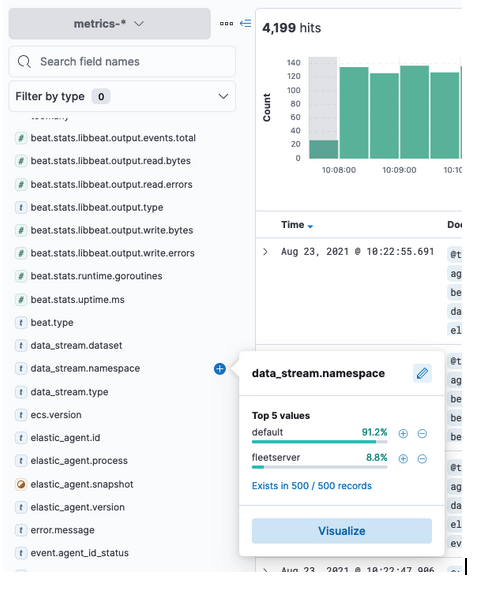
To see the metrics collected for the agent running Fleet Server, go to Analytics > Discover.
In the following example, fleetserver was configured as the namespace, and
you can see the metrics collected:
In Kibana, go to Analytics > Dashboard and search for the predefined dashboard
called [Elastic Agent] Agent metrics. Choose this dashboard, and run a query
based on the fleetserver namespace.
The following dashboard shows data for the query data_stream.namespace:
"fleetserver". In this example, you can observe CPU and memory usage as a
metric and then resize the Fleet Server, if necessary.
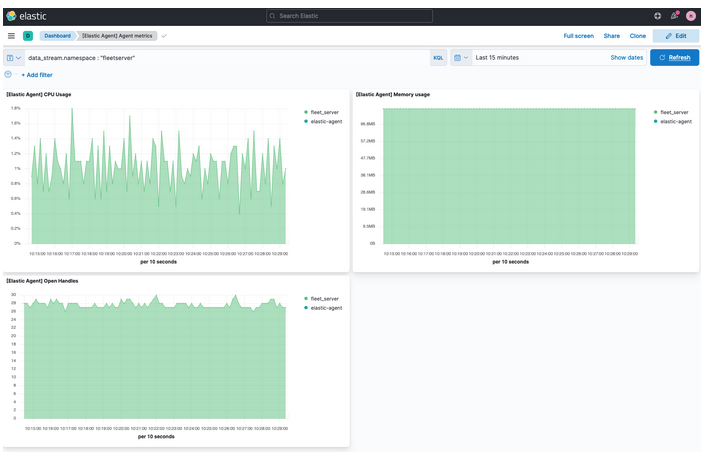
Note that as an alternative to running the query, you can hide all metrics
except fleet_server in the dashboard.