Ingest management overview
editIngest management overview
editThis functionality is in technical preview and may be changed or removed in a future release. Elastic will work to fix any issues, but features in technical preview are not subject to the support SLA of official GA features.
This experimental release allows you to try out new capabilities. There is no migration path for future releases. You must test in a dedicated cluster. Delete the cluster when you are done. You will not be able to upgrade the cluster.
Elastic Agent
editElastic Agent is a single, unified way to add monitoring for logs, metrics, and other types of data to each host. A single Agent makes it easier and faster to deploy monitoring across your infrastructure. The Agent’s single, unified configuration makes it easier to add integrations for new data sources.
Ingest Manager
editIngest Manager provides a web-based UI in Kibana to add and manage integrations for popular services and platforms, as well as manage a fleet of Elastic Agents. Our integrations provide an easy way to add new sources of data, plus they ship with out-of-the-box assets like dashboards, visualizations, and pipelines to extract structured fields out of logs. This makes it easier to get insights within seconds.
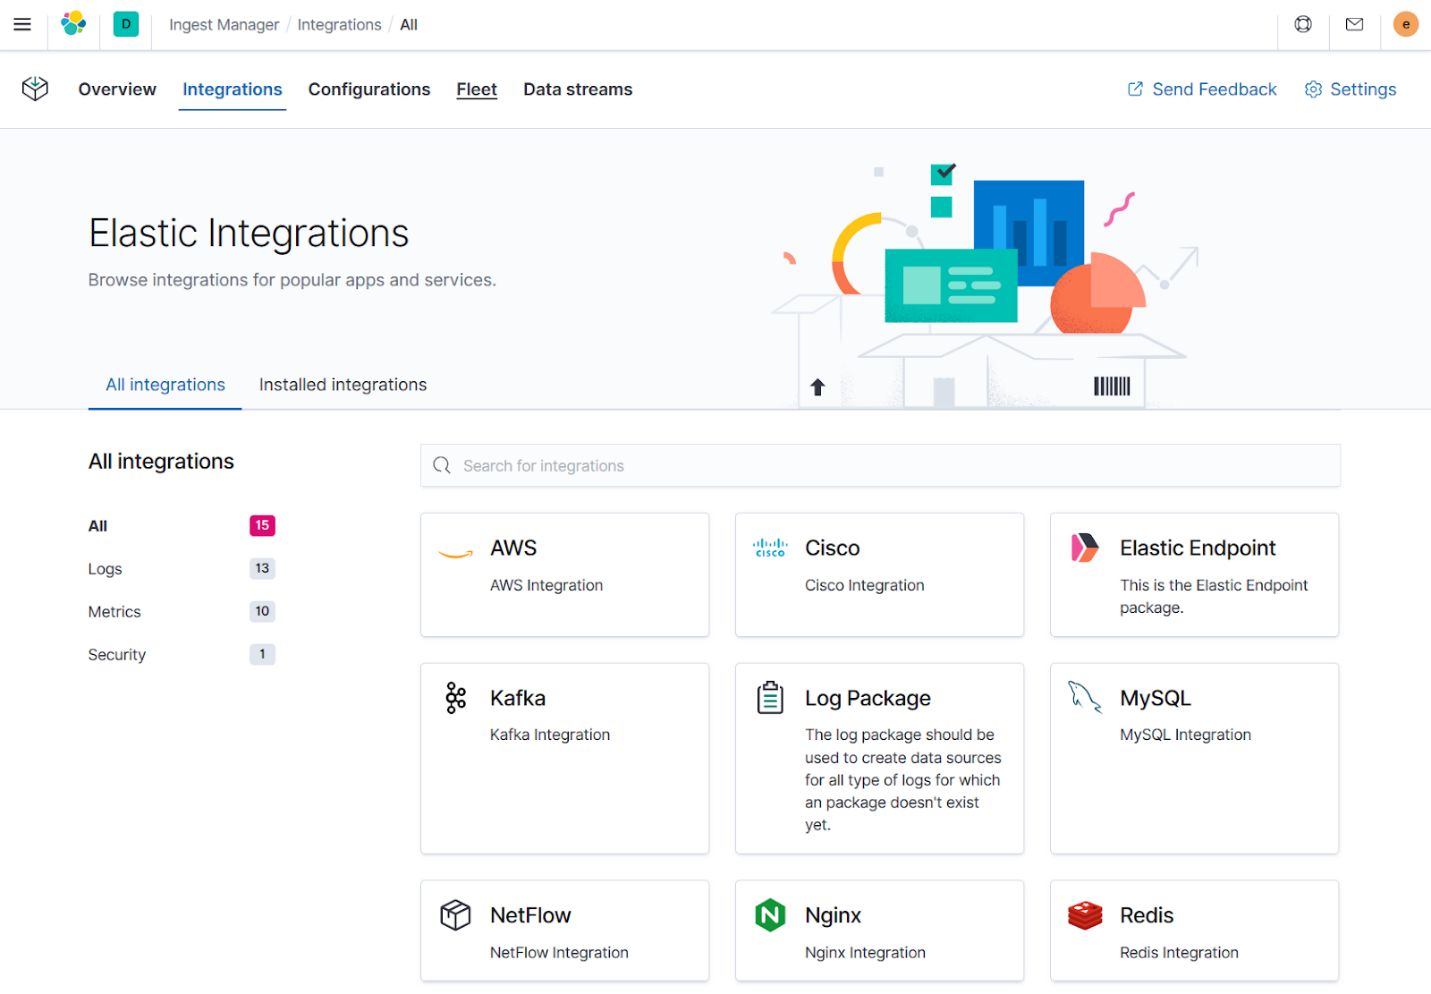
Integrations in Ingest Manager
editIngest Manager provides a web-based UI for configuring integrations with your data sources. This includes popular services and platforms like Nginx or AWS, as well as many generic input types like log files.
The Elastic Agent configuration allows you to use any number of integrations for data sources. You can apply the Elastic Agent configuration to multiple Agents, making it even easier to manage configuration at scale.
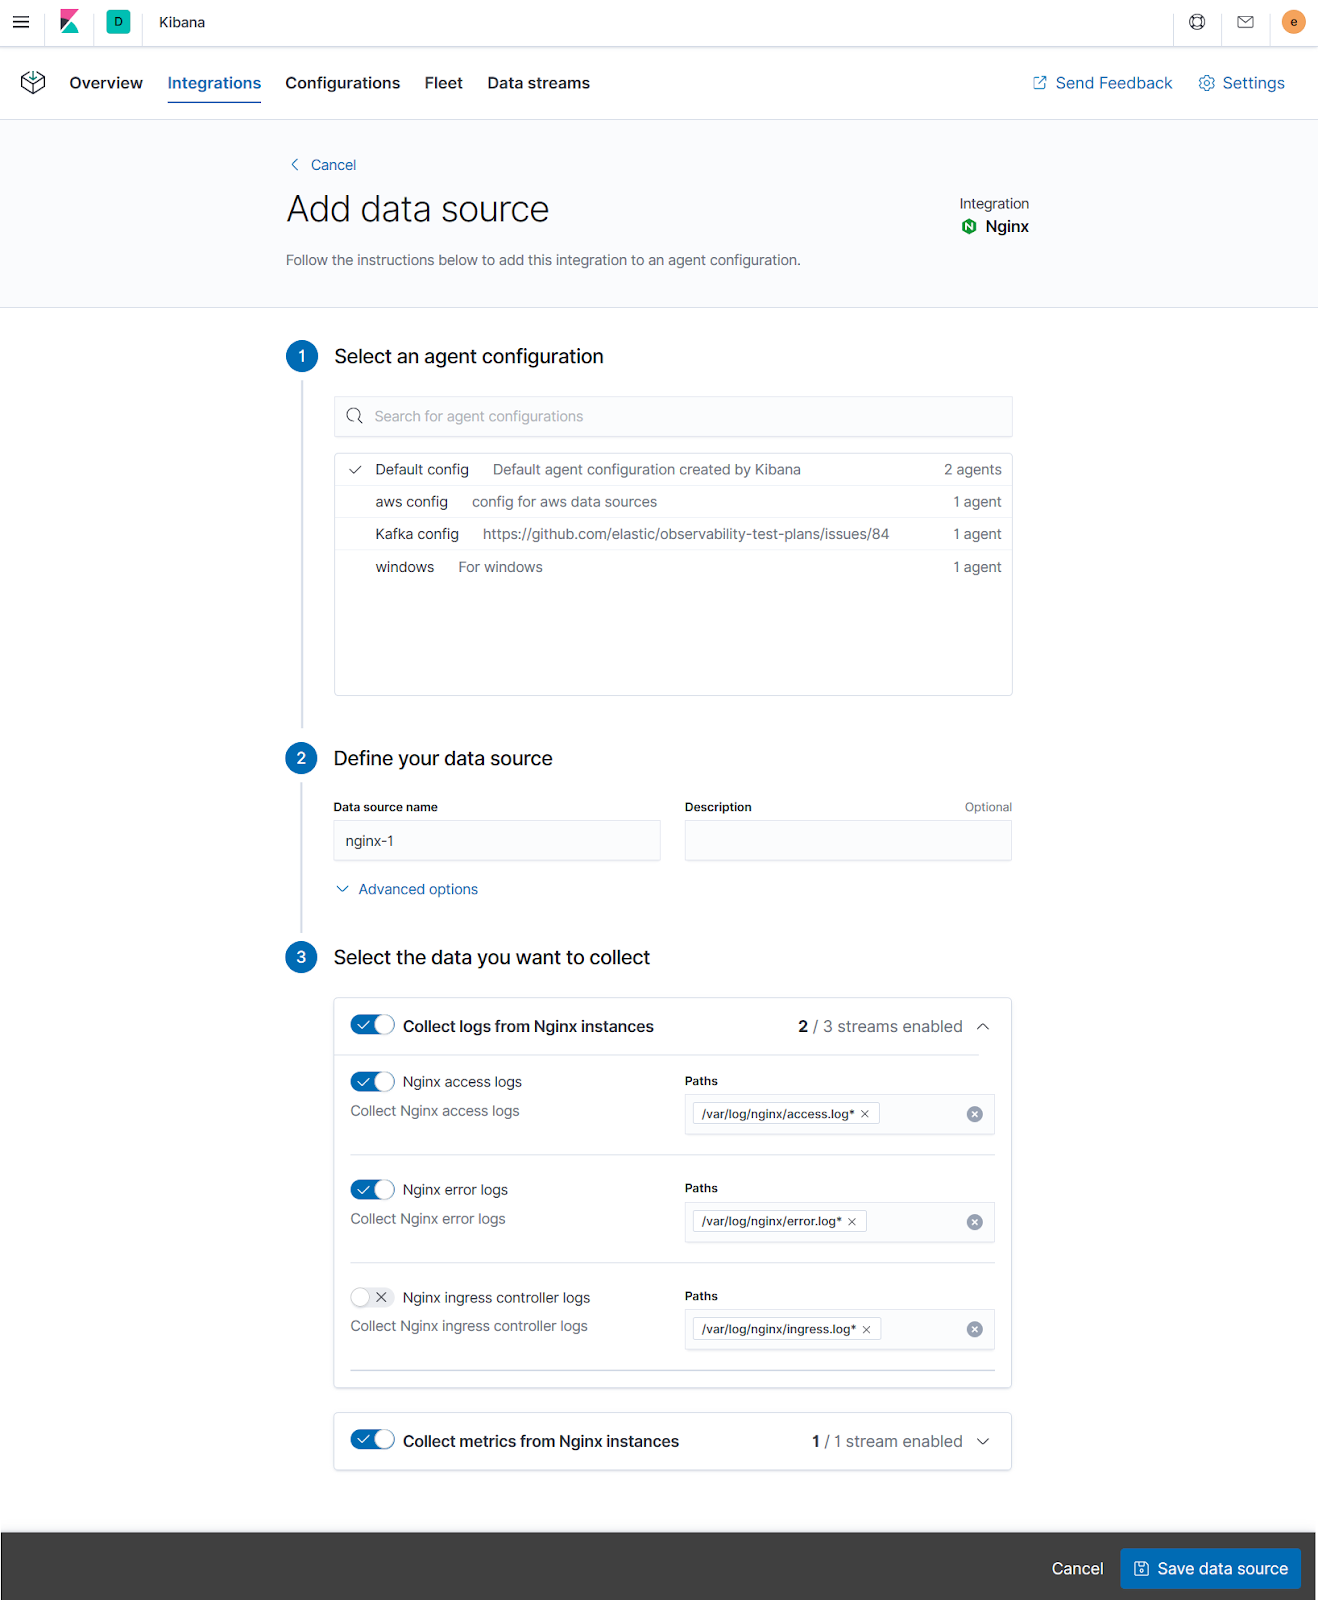
You define a data source by supplying a name and description. Then you configure inputs for logs and metrics, such as the path to your Nginx access logs. When you’re done, you save the data source to update the Elastic Agent configuration. The next time enrolled Agents check in, they receive the update. Having the configurations automatically deployed is more convenient than doing it yourself by using SSH, Ansible playbooks, or some other tool.
If you prefer infrastructure as code, you may use YAML files and APIs. Ingest Manager has an API-first design. Anything you can do in the UI, you can also do using the API. This makes it easy to automate and integrate with other systems.
Central management in Fleet
editYou can see the state of all your Elastic Agents on the Fleet page. Here you can see which Agents are online, which have errors, and the last time they checked in. You can also see the version of the Elastic Agent binary and configuration.
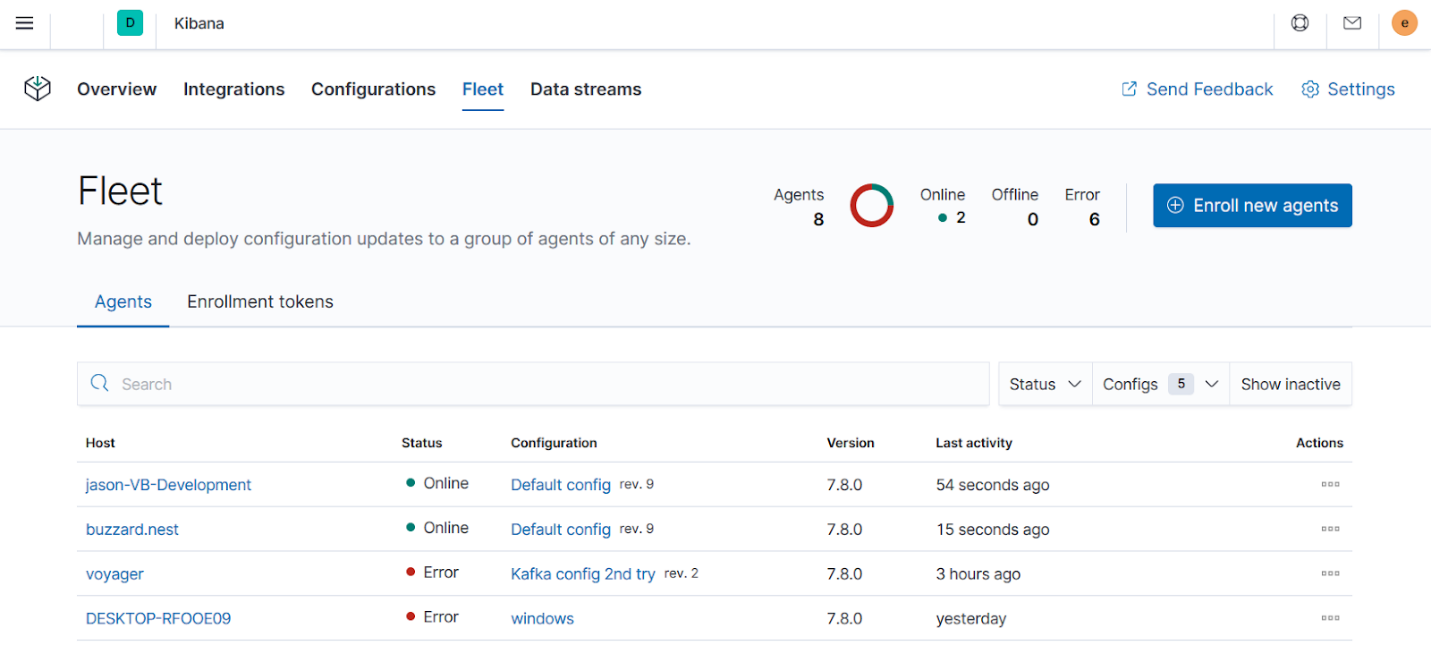
Fleet serves as the communication channel back to the Elastic Agents. Agents check in for the latest updates on a regular basis. You can have any number of Agents enrolled into each Agent configuration, which allows you to scale up to thousands of hosts. When you make a change to an Agent configuration, all the Agents receive the update during their next check-in. You no longer have to distribute configuration updates yourself using SSH, Ansible playbooks, or other configuration methods.
Data streams make index management easier
editThe data collected by Elastic Agent is stored in indices that are more granular than you’d get by default with Filebeat. This gives you more visibility into the sources of data volume, and control over lifecycle management policies and index permissions. These indices are called data streams. We will have more improvements on this concept in future releases.
As you can see in the following screen, each data stream (or index) is broken out by dataset, type, and namespace.
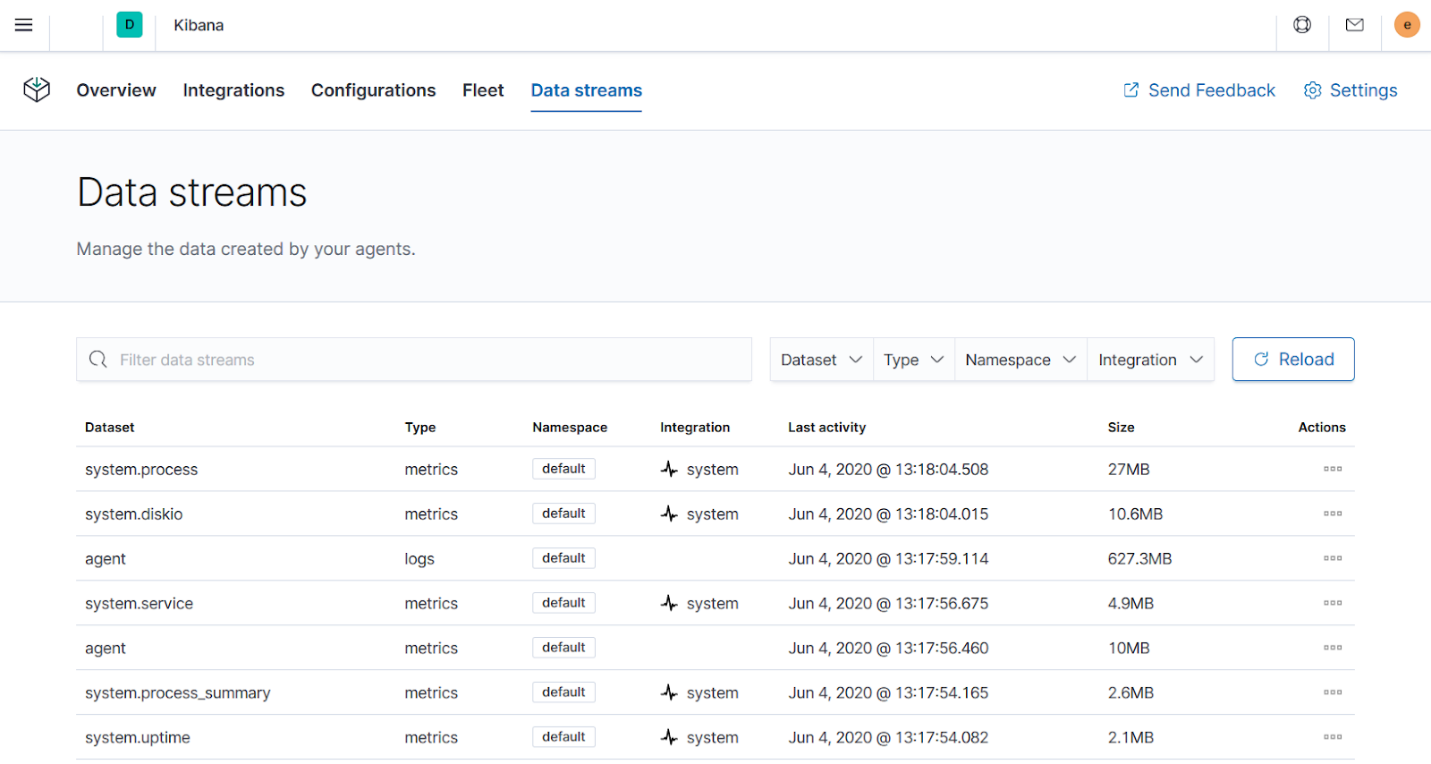
The dataset is defined by the integration and describes the fields and other settings for each index. For example, you might have one dataset for process metrics with a field describing whether the process is running or not, and another dataset for disk I/O metrics with a field describing the number of bytes read.
This indexing strategy solves the issue of having indices with hundreds or thousands of fields. Because each index stores only a small number of fields, the indices are more compact with faster autocomplete. And as an added bonus, the Discover page only shows relevant fields.
Namespaces are user-defined strings that allow you to group data any way you
like. For example, you might group your data by environment (prod, QA) or by
team name. Using a namespace makes it easier to search the data from a given
source by using index patterns, or to give users permissions to data by
assigning an index pattern to user roles. Many of our customers already organize
their indices this way, and now we are providing this best practice as a
default.
When searching your data in Kibana, you can use an index pattern to search across all or some of the indices.