Configure logging for Fleet-managed Elastic Agents
editConfigure logging for Fleet-managed Elastic Agents
editAgent monitoring, which includes collecting agent logs and agent metrics, is enabled by default on each agent policy assigned to an agent. If logging for the agent is not required, you need to deselect the logging option when creating the agent policy.
- In Kibana, go to Management > Fleet.
- Under the Agent policies tab, click Create agent policy > Advanced options.
- Under Agent monitoring, deselect Collect agent logs.
- To confirm your change, click Create agent policy.
To disable logging on an agent policy already assigned to an agent:
- Select the Agents tab, and then click the agent policy.
- Click the Settings tab.
- Under Agent monitoring, deselect Collect agent logs.
- To confirm your change, click Save changes.
View log events
editThe Logs page for each agent enables you to monitor all of the log events flowing in from your agents and integrations in a centralized view.
To help you get started with your analysis faster, you can use the search bar to create structured queries using Kibana Query Language. Along with the power of search, you also have the option to view historical logs from a specified time range.
- In Kibana, go to Management > Fleet.
- Under Agents, click the agent name listed in the Host column.
- Click the Logs tab.
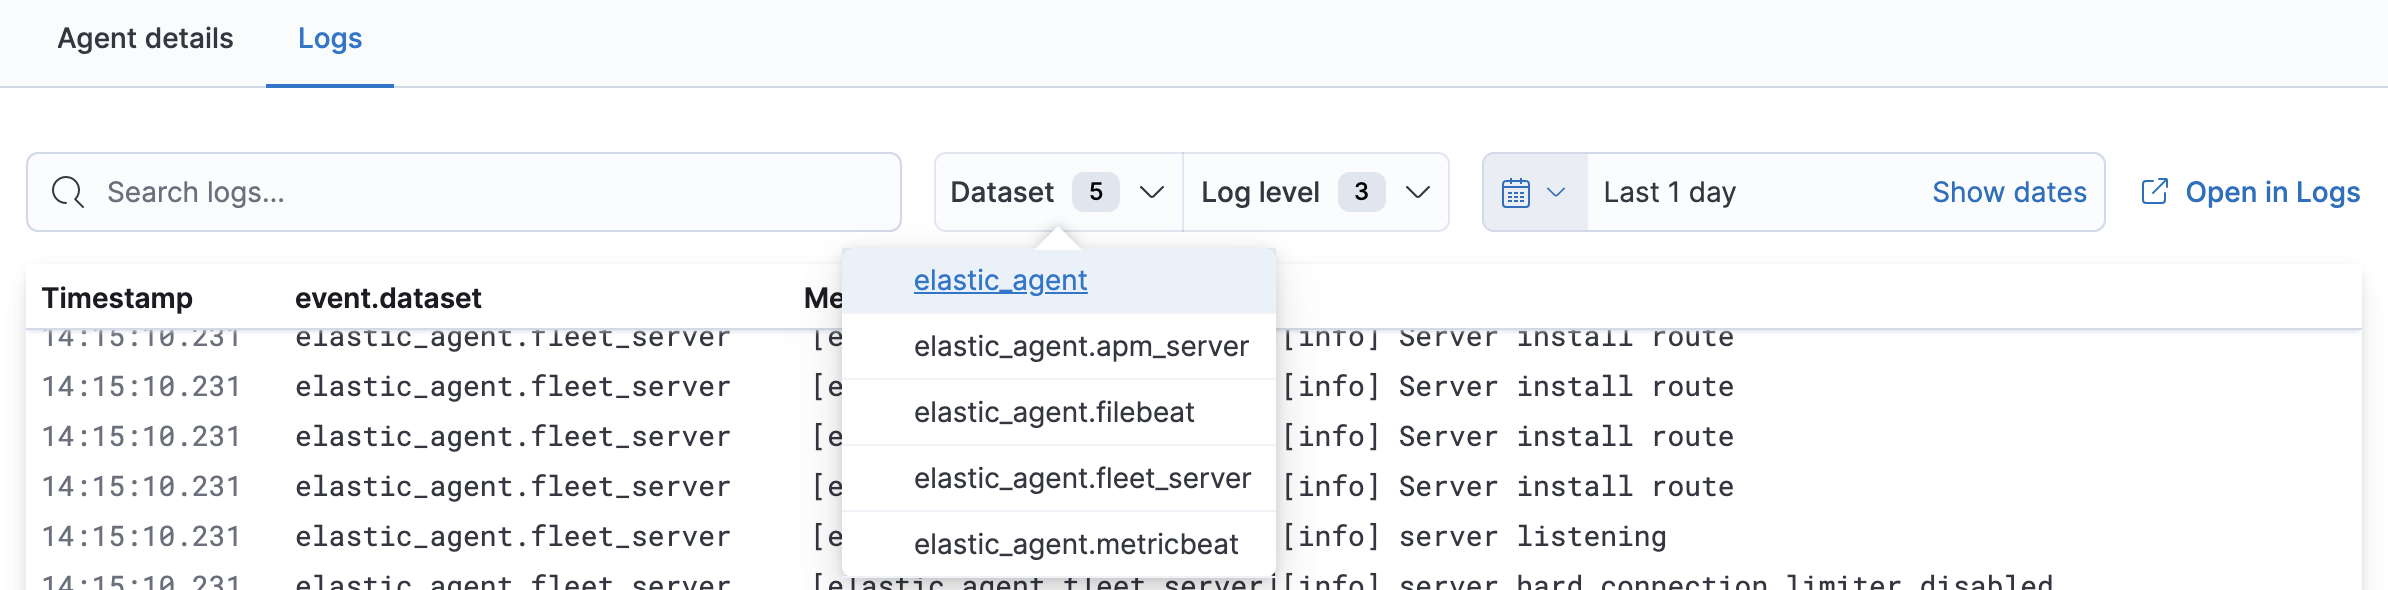
To view log events for an agent or related programs, such as Filebeat or Fleet Server, make your selections under Dataset.
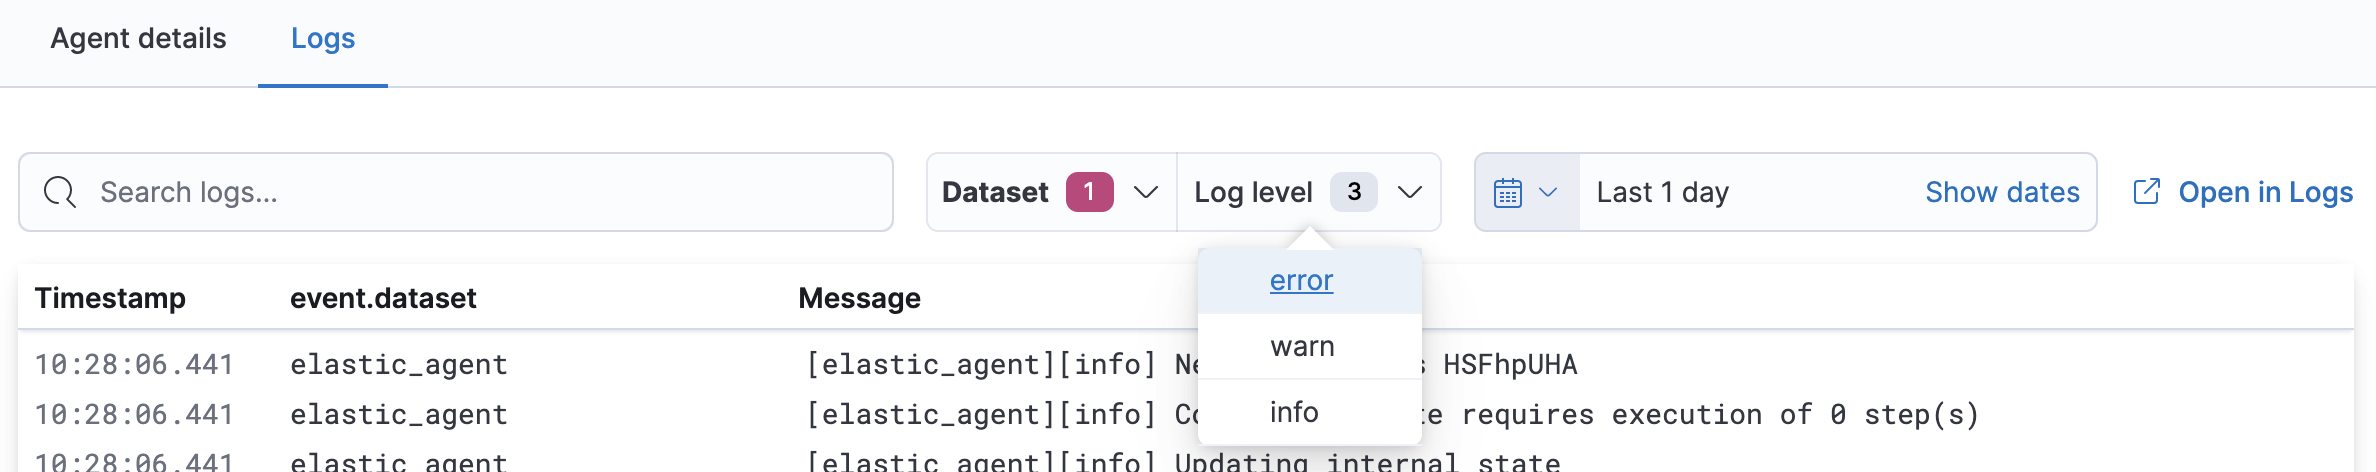
To view specific log levels relating to a log event, make your selections under Log level.
You can select from error, warn, and info.
When you have searched and filtered your logs for a specific log event, you may want to examine the metadata and the structured fields associated with that event in the Logs app. Click Open in Logs.
Set the agent logging level
editWithin Fleet, you can specify the logging level for each agent to help troubleshoot any issues.
- In Kibana, go to Management > Fleet.
- Under Agents, select the agent from the Host column.
- Click the Logs tab.
-
Located at the bottom of the Logs page, you can select the Agent logging level:
-
error: Logs errors and critical errors. -
warning: Logs warnings, errors, and critical errors. -
info: Logs informational messages, including the number of events that are published. Also logs any warnings, errors, or critical errors. -
debug: Logs debug messages, including a detailed printout of all events flushed. Also logs informational messages, warnings, errors, and critical errors.
-
- Once you have made your selection, click Apply changes.