Observability highlights
editObservability highlights
editThis list summarizes the most important enhancements in Observability 8.0.
Serverless log ingestion from Amazon S3 to Elastic
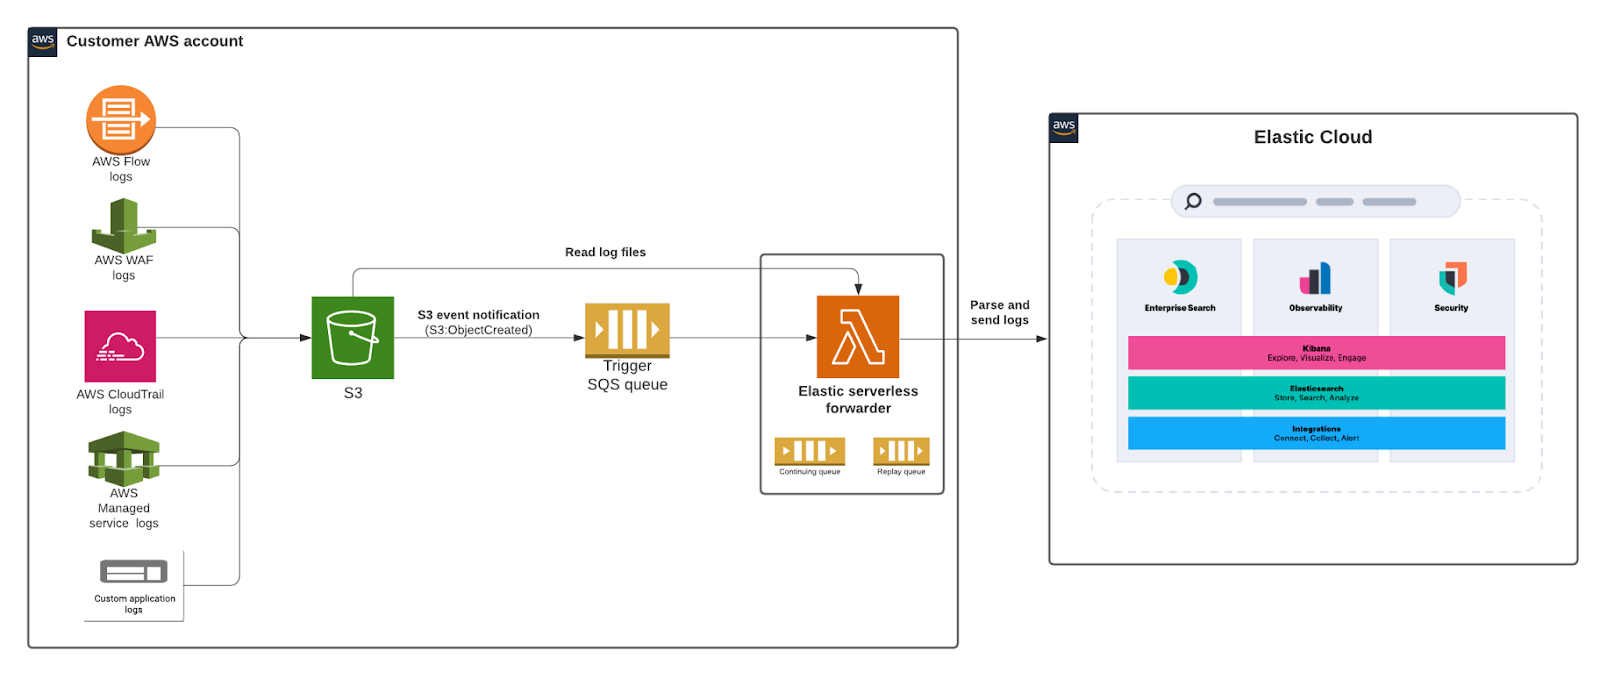
editWe are delighted to announce the release of Elastic serverless forwarder, a new Lambda application that helps users ingest logs from their Amazon Web Services (AWS) environment into Elastic in a completely serverless fashion. AWS users no longer have to set up and maintain compute resources for data ingestion, which simplifies the getting started experience and reduces data onboarding friction.
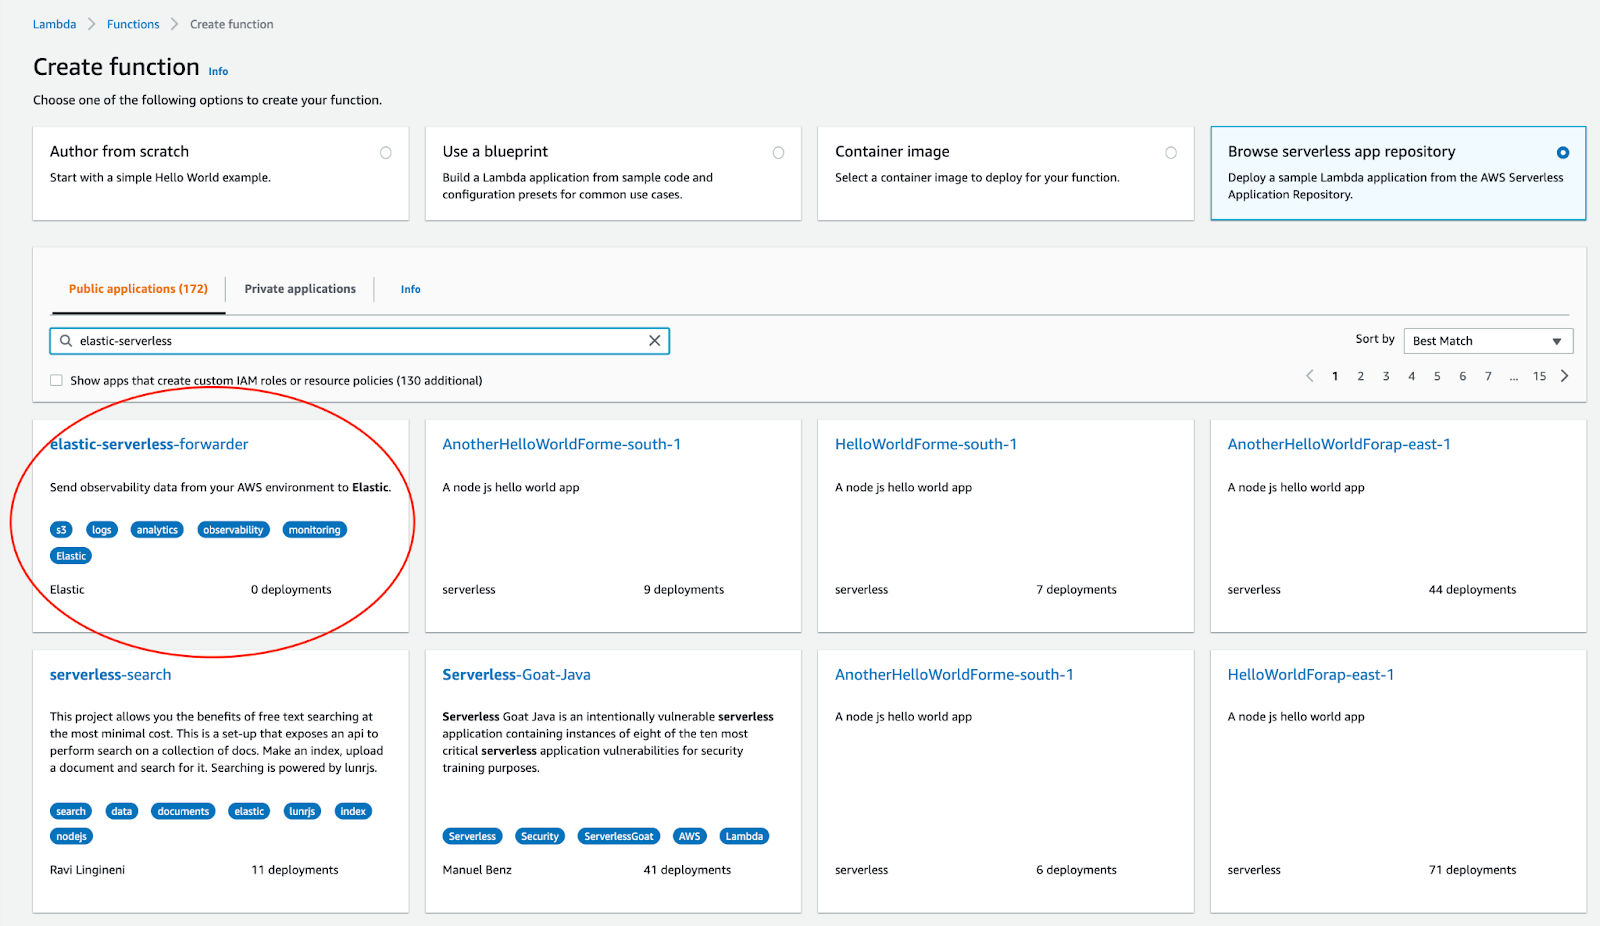
The elastic-serverless-forwarder application is publicly available in the AWS Serverless Application repository (SAR), a managed repository for serverless applications, for you to start using right away. Without leaving the AWS console, you can deploy the application from SAR, provide a few simple configuration details, and get logs flowing from AWS to Elastic.
AWS CloudWatch logs support for Elastic Agent integrations
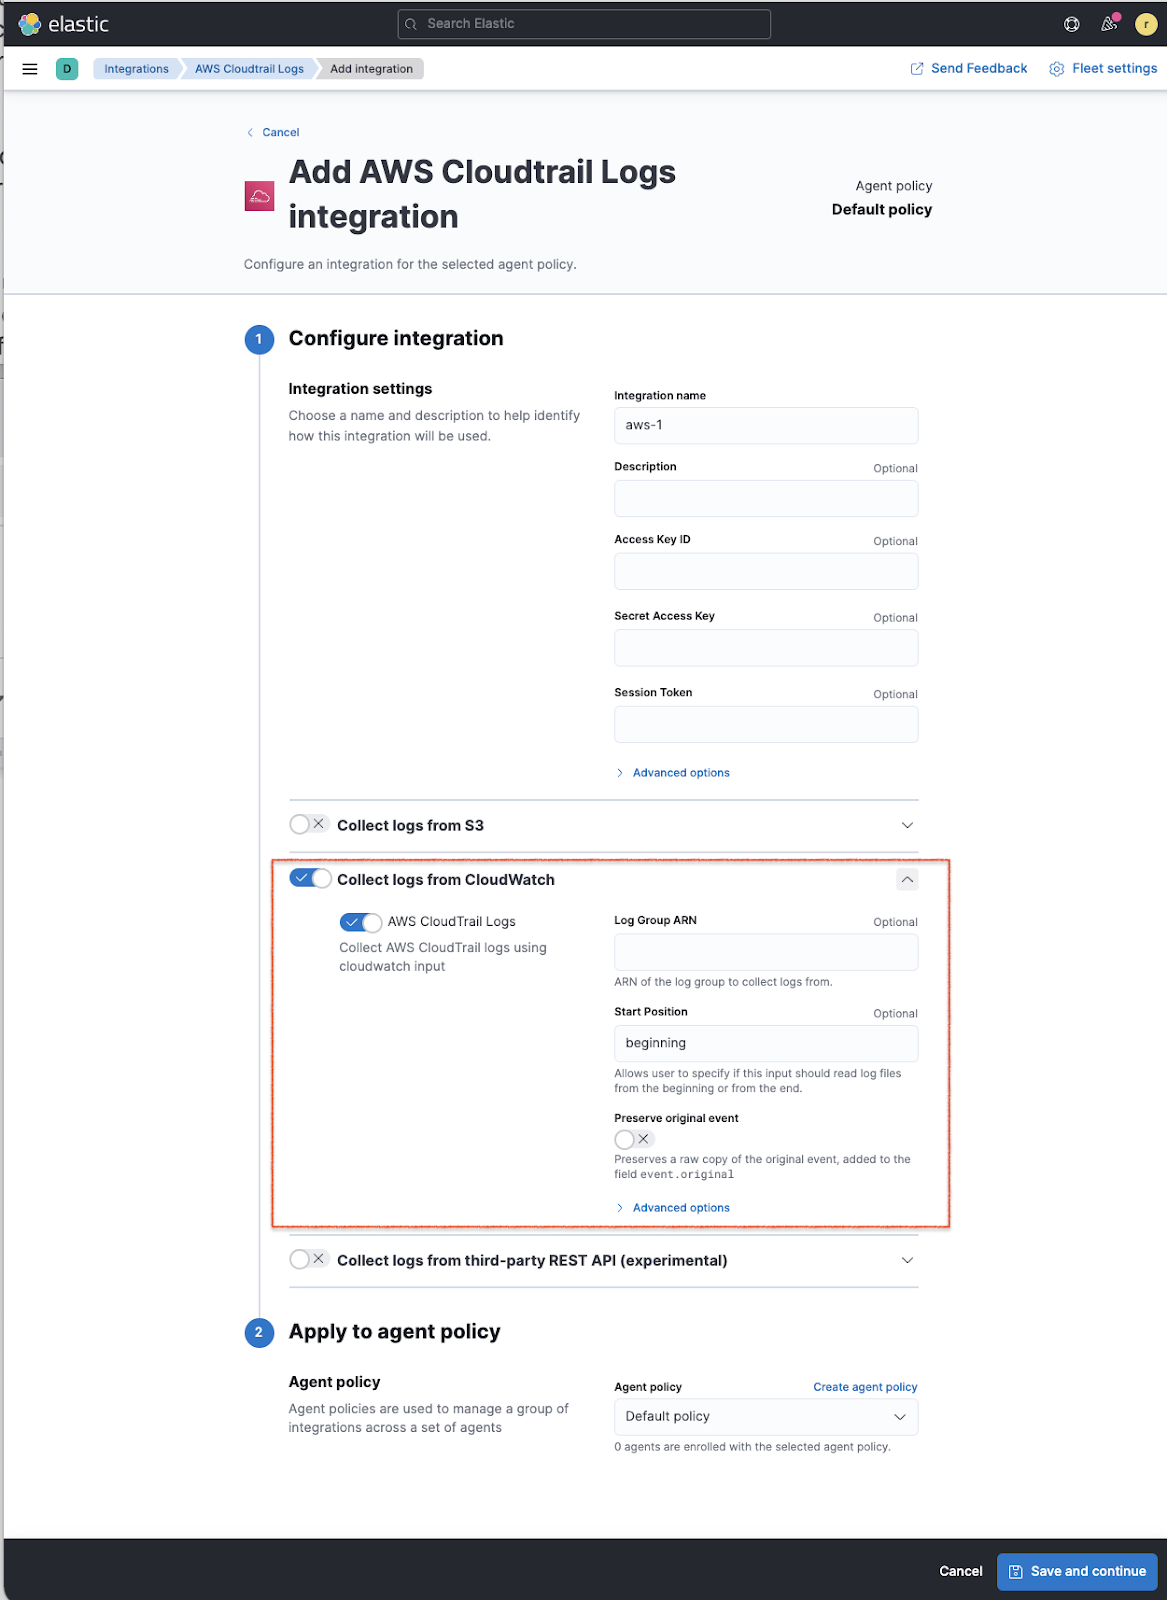
editAll Amazon Web Services (AWS) services provide an option to write their logs to AWS CloudWatch logs. With Elastic already providing Amazon S3 input support, we have now added Elastic Agent support for AWS CloudWatch logs for all AWS integrations.
Users who aren’t using Amazon S3 to store their logs no longer have to set up extra AWS infrastructure to send their logs to Elastic. This simplifies ingestion architecture, reduces AWS operational costs, and removes any onboarding friction. This new feature makes it even easier to integrate Elastic services into AWS architecture and brings Elastic closer to the way you’re currently working with Amazon Web Services.
Amazon S3 Storage Lens integration in Elastic Agent
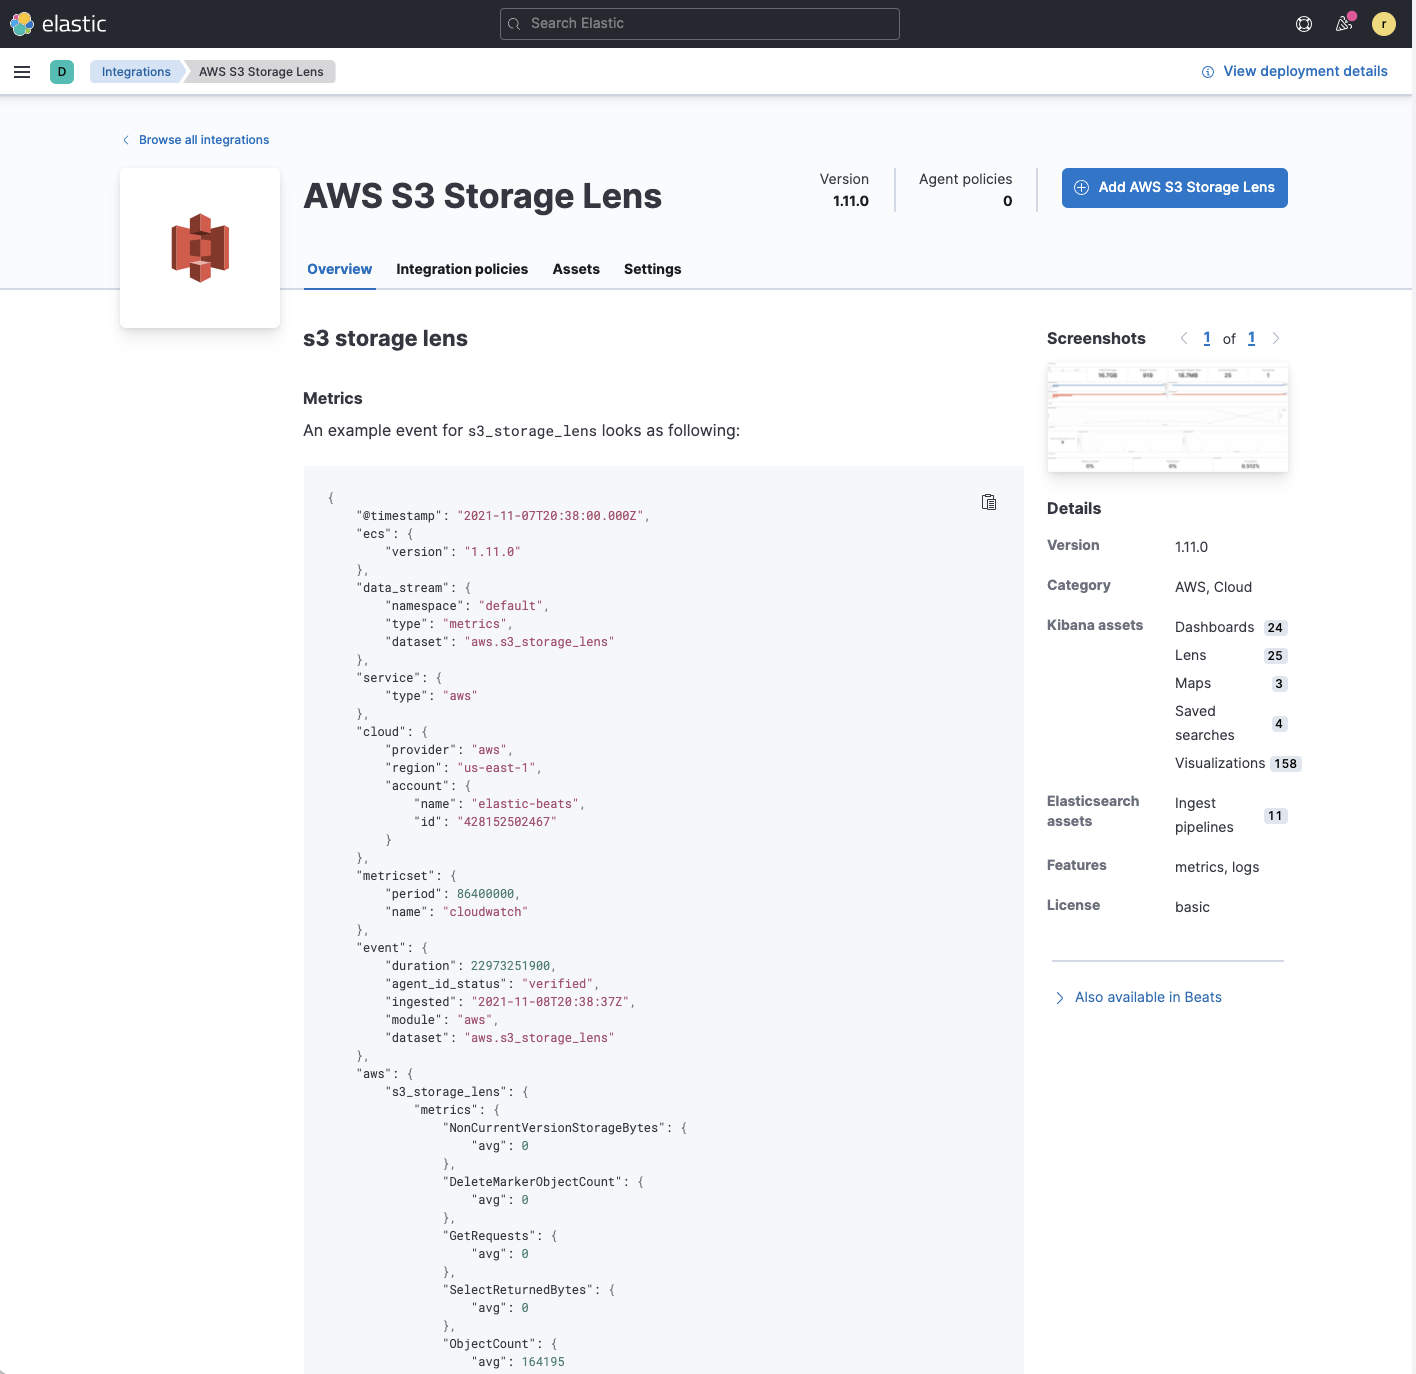
editAmazon S3 delivers cost-efficient and flexible storage, but optimizing the utilization and cost-efficiency of ever-growing storage buckets across a large organization can present challenges.
As AWS added the functionality for publishing Amazon S3 storage lens metrics to CloudWatch, Elastic is proud to be an AWS launch partner to bring the corresponding Elastic Agent integration to simplify bringing these metrics to Elastic. DevOps and infrastructure teams can view, aggregate, and analyze AWS S3 Storage Lens metrics in Elastic alongside other application metrics, and use system logs to make informed decisions about storage optimization.
Azure Elastic Agent integrations now generally available (GA)
editWe are delighted to announce all Microsoft Azure integrations in Elastic Agent are now generally available and ready for production. You can now start leveraging Elastic Agent Azure integrations in your Azure production environments with even more confidence.
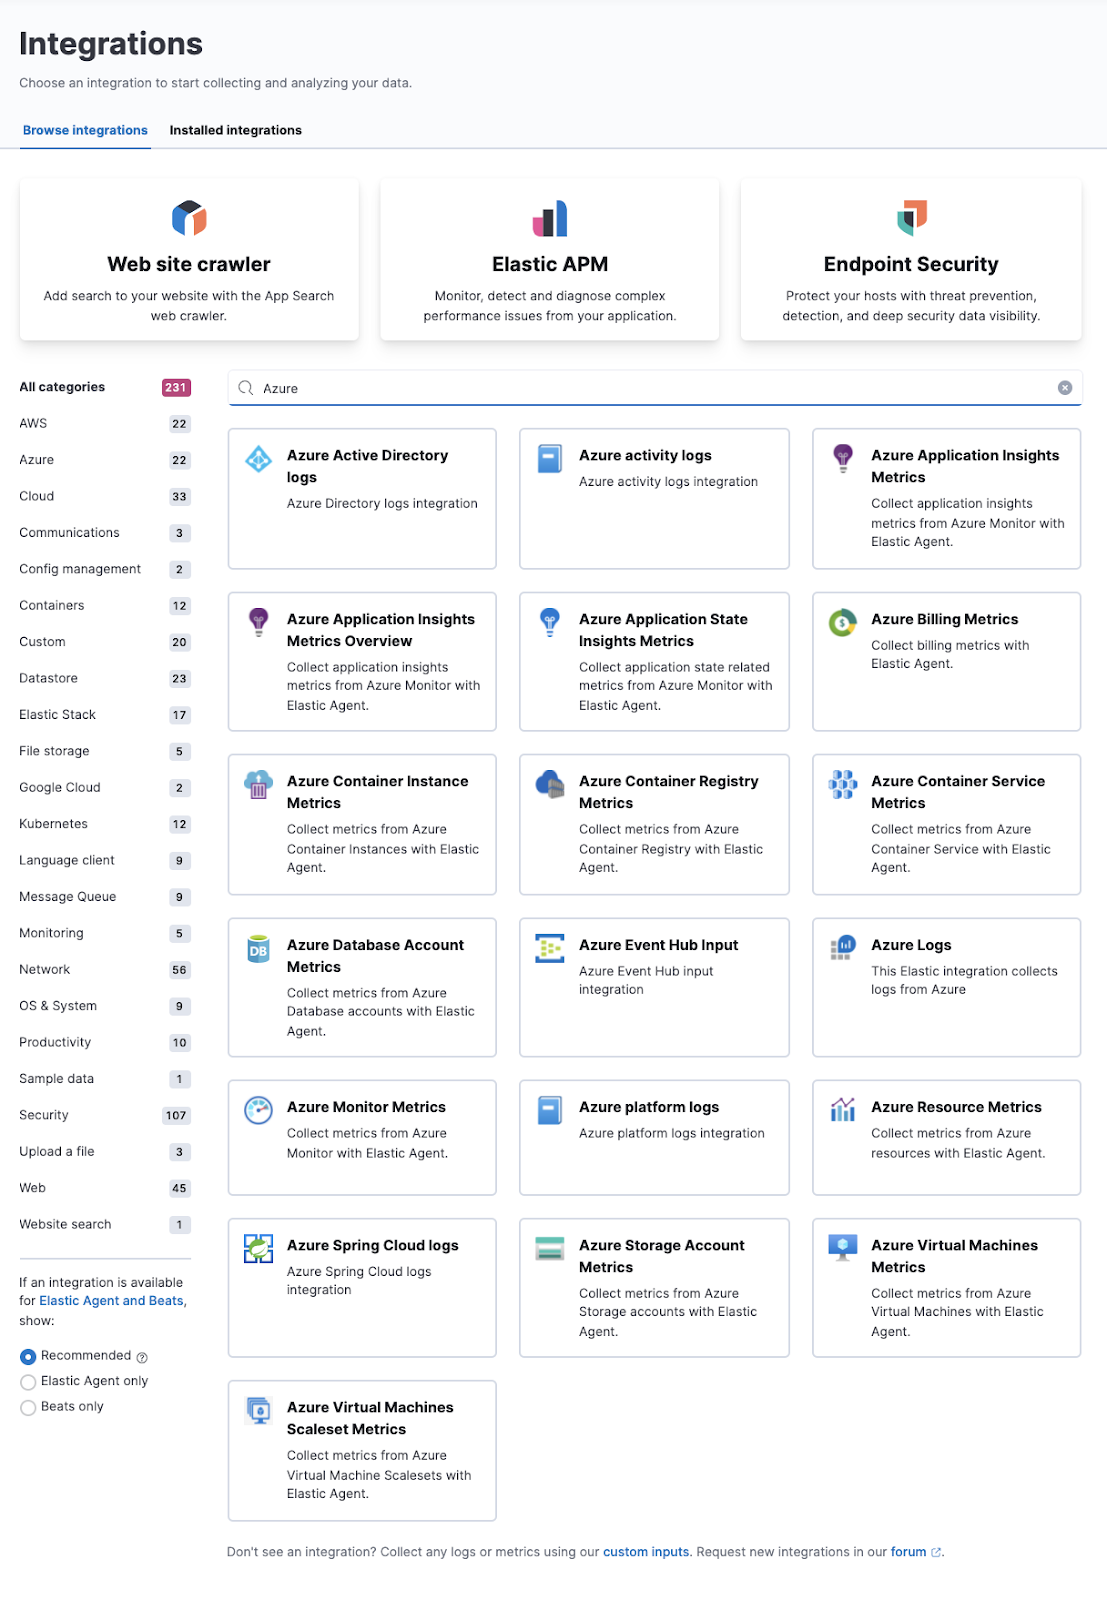
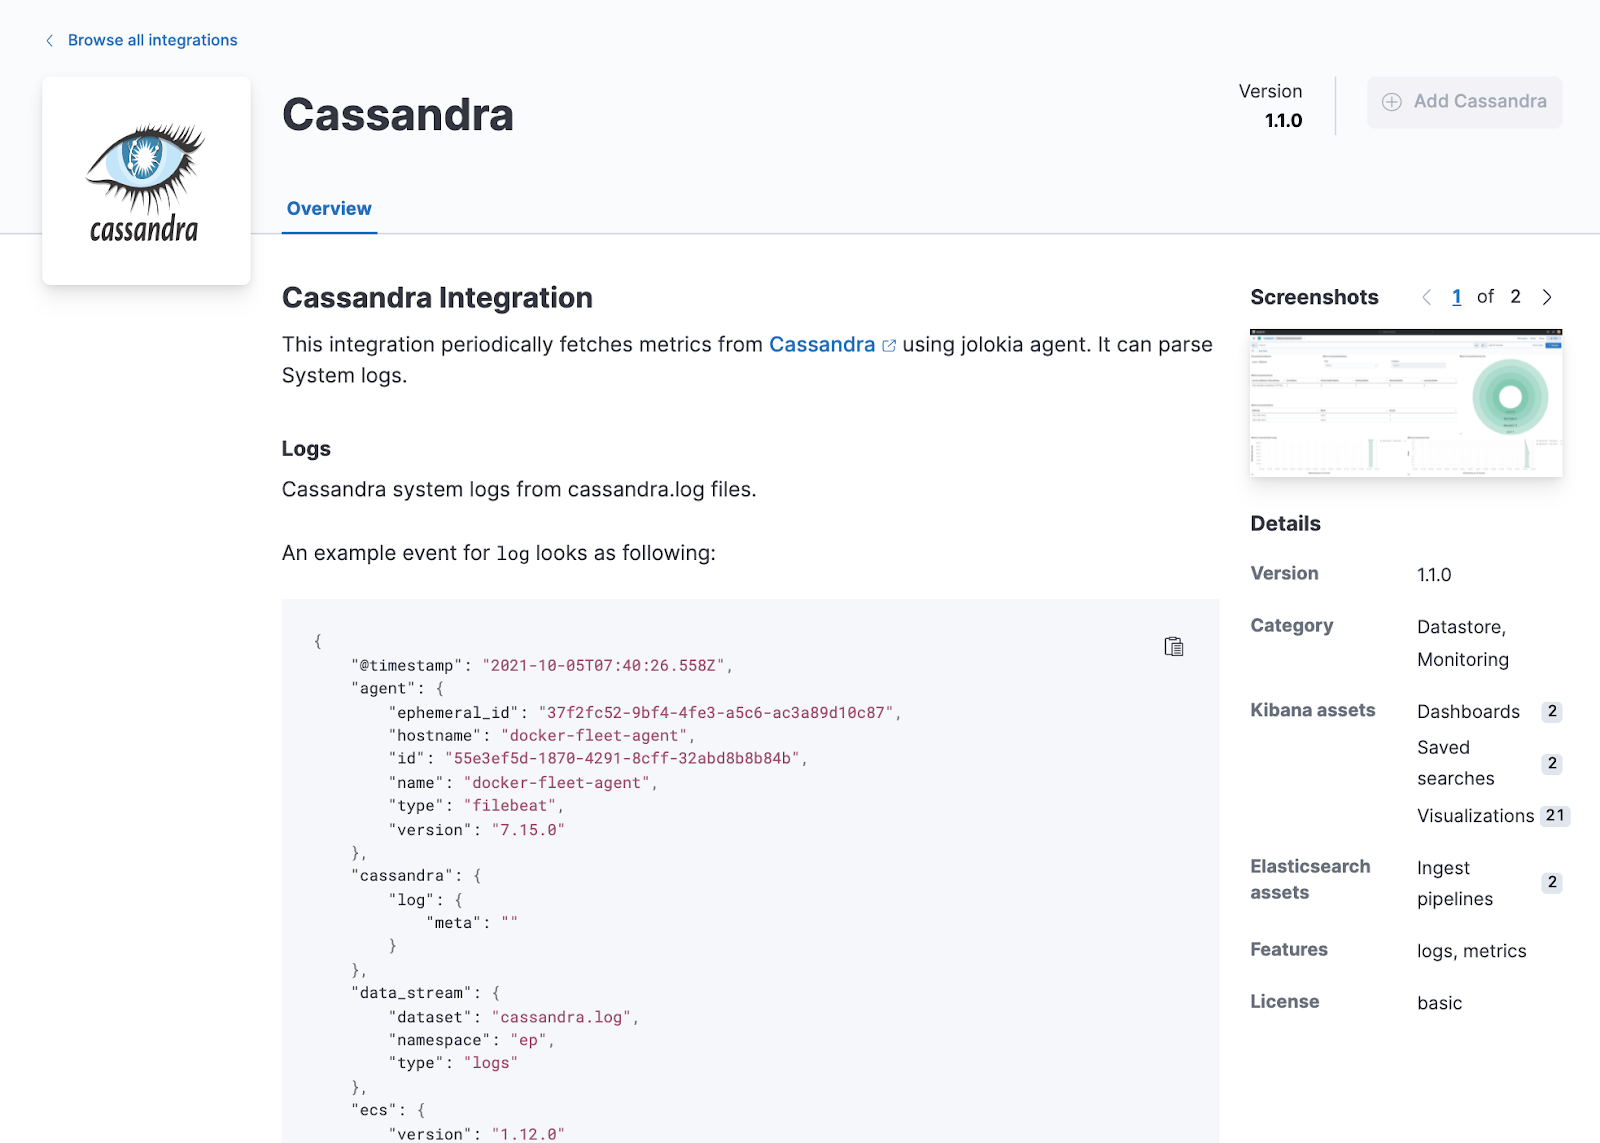
New Elastic Agent integrations for Cassandra and vSphere
editElastic Agent integrations are now available for Cassandra (GA) and vSphere (beta), making it easier to integrate these services with Elastic. The Elastic Agent-enabled Cassandra integration fetches metrics from Cassandra using jolokia agent, can parse System logs, and is now ready for production environments. The vSphere integration (beta) provides Elastic Agent support for an important community-driven server virtualization application.
APM Server easier to manage and tune
editWith a new implementation of the Elasticsearch output for APM Server now generally available, out-of-the-box performance has been improved and ongoing configuration tasks reduced. APM Server now uses a custom implementation (rather than libbeat) that scales up without extra configuration and generally requires less ongoing management of options.
If you’re using the Elastic APM integration, you can now configure APM Server directly within Fleet. The new Elasticsearch output will also produce better out-of-the-box results without requiring manual configuration, and setup has been simplified and moved to Kibana.
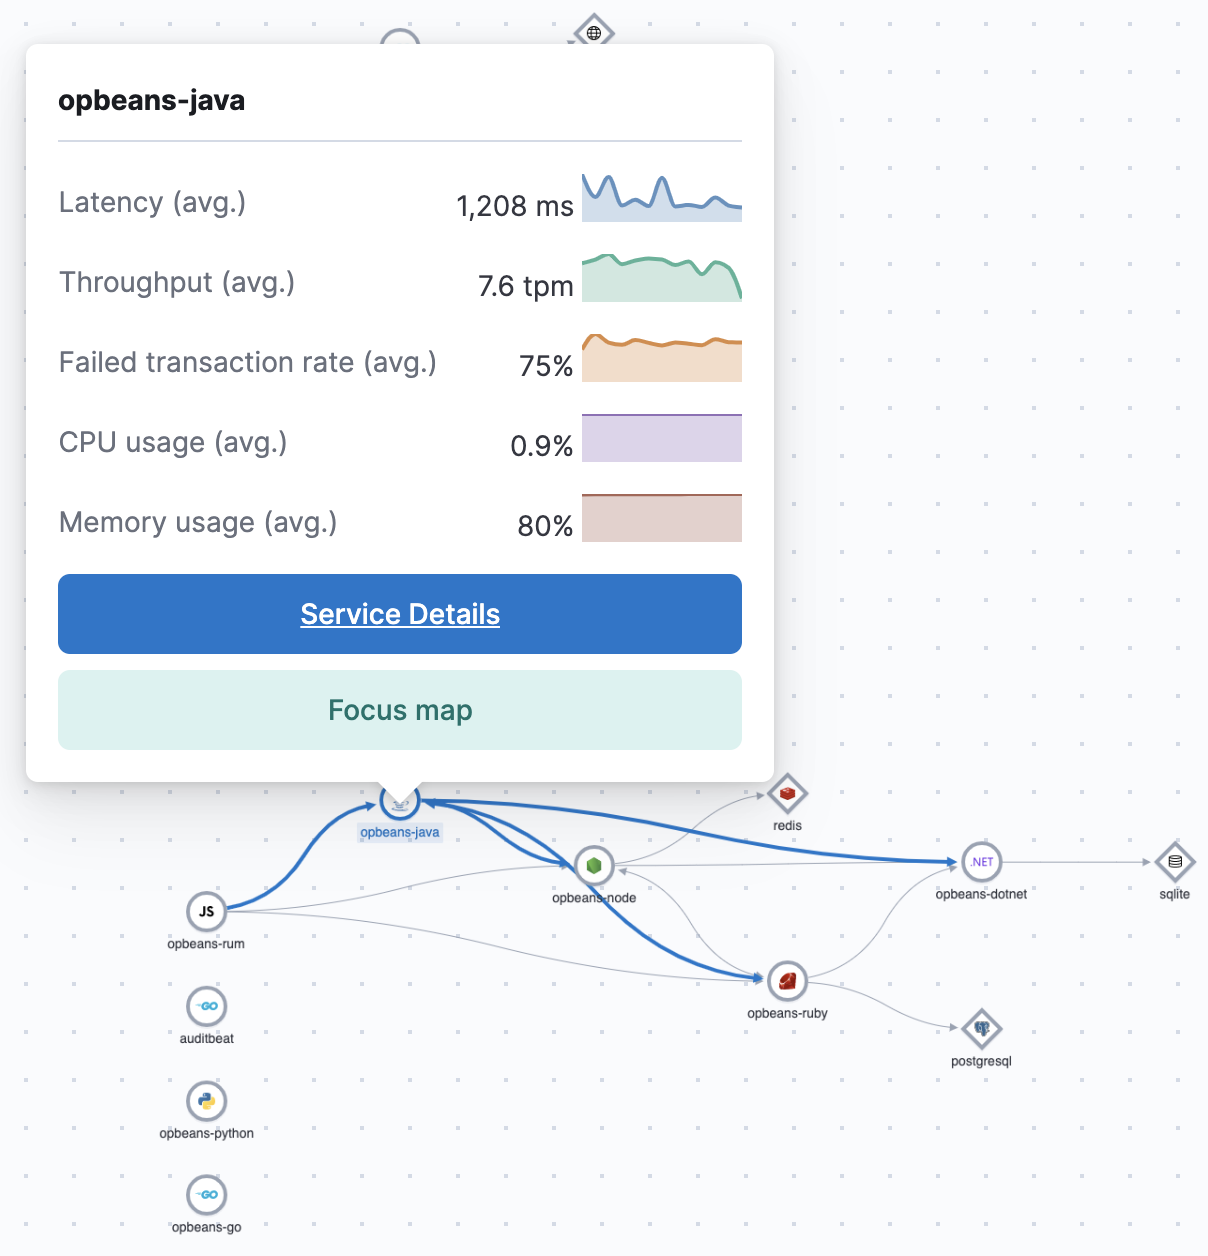
We’ve also made a bunch of improvements to the APM app to bring the data where you need it most and make it actionable, with clickable summaries on services via the Service Map, an Errors view added to Services, and a new Traces app.
Click on any service in the Service Map app to get a summary of key metrics and quick links to more details or map focus.
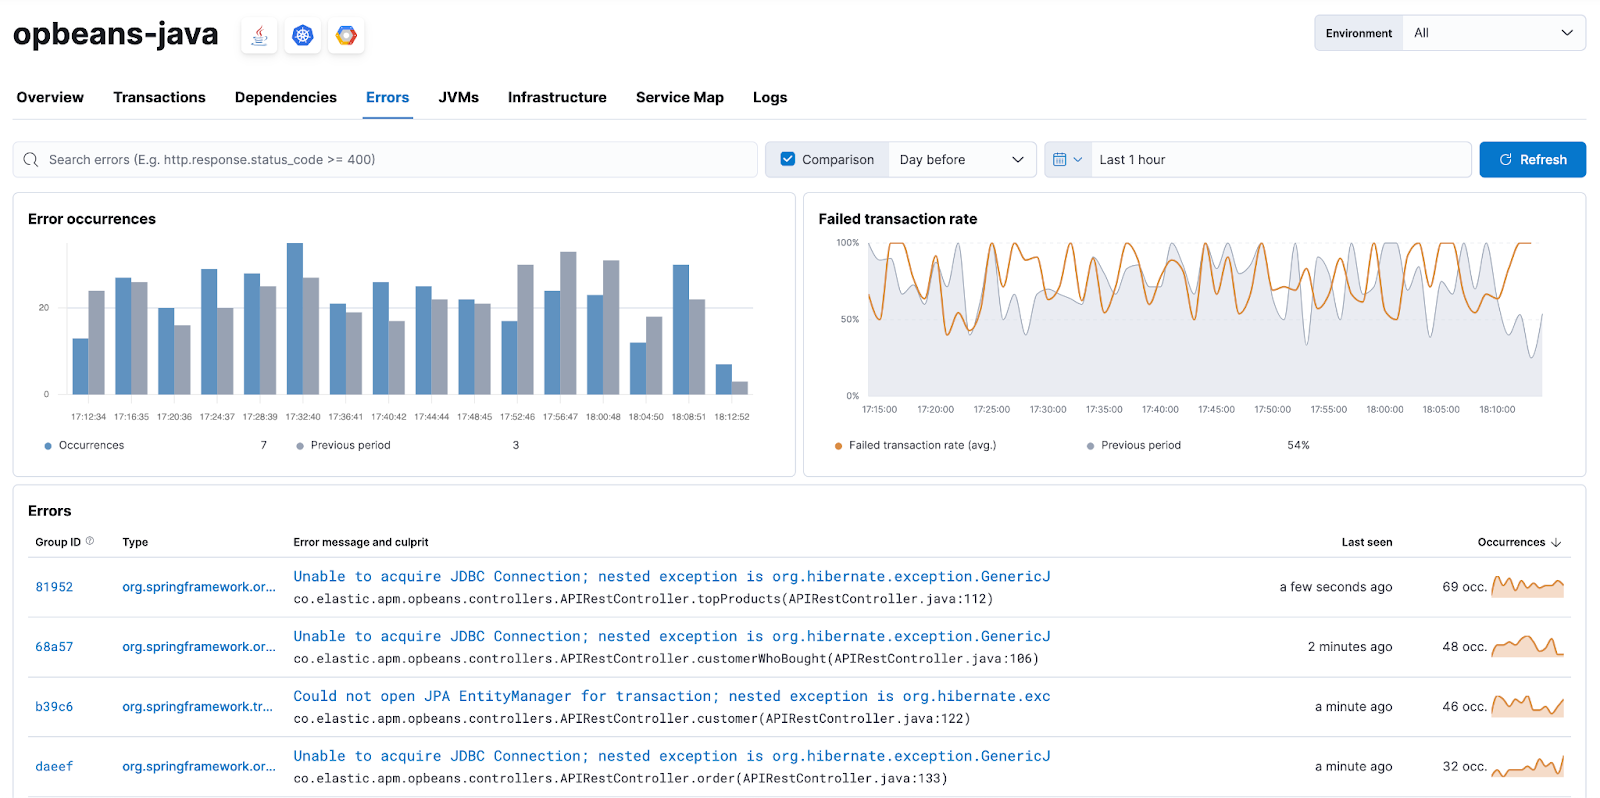
The new Errors view within Services provides a searchable, filterable view with key visualizations on error occurrences and failed transactions.
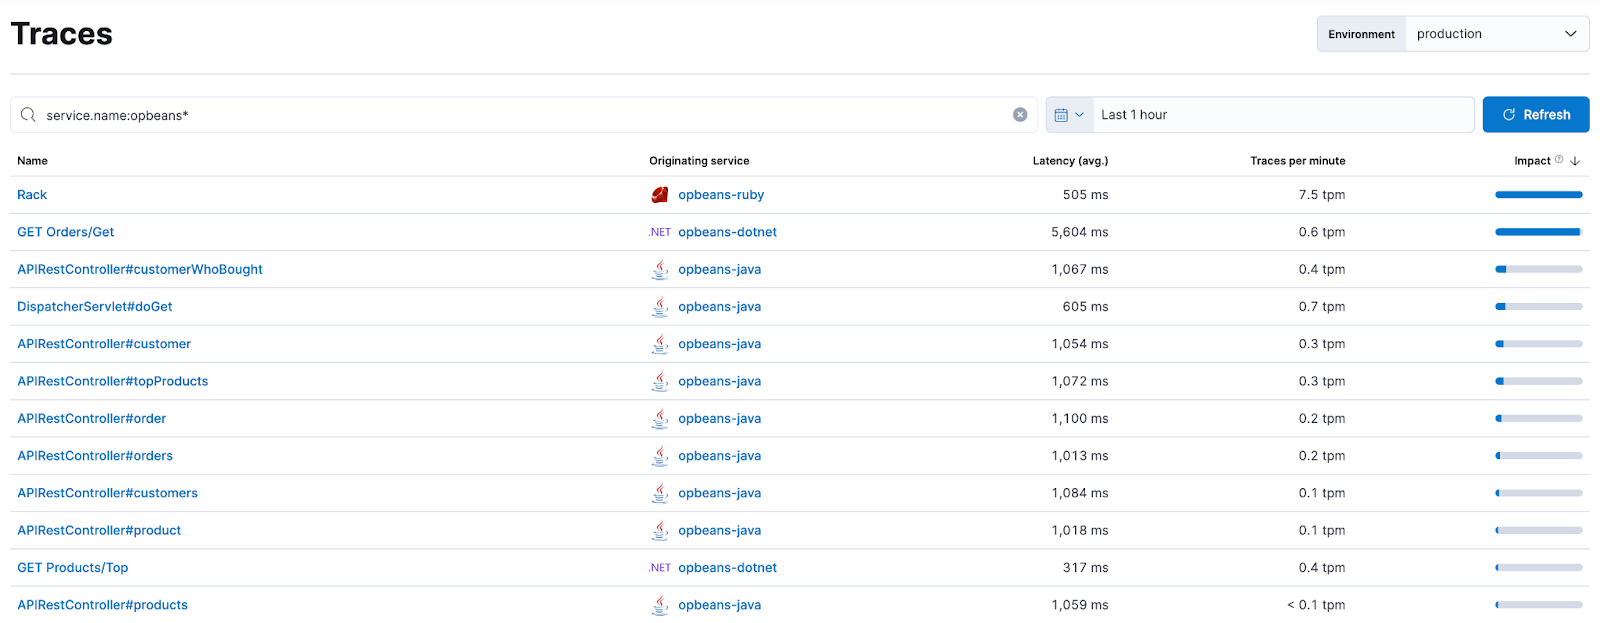
The new Traces app enables you to filter and search transactions, order by key metrics such as latency and impact, and click into specific transactions for further analysis.
Enhanced visibility for Maven build executions within CI/CD
editBy integrating more details on Maven build steps into the APM distributed trace visualization, you can now gain greater visibility into your Continuous Integration / Continuous Deployment (CI/CD) setup. These improvements provide visibility into build executions that publish artifacts or Docker images, or perform Snyk security checks, which increases your ability to troubleshoot and optimize build pipelines.
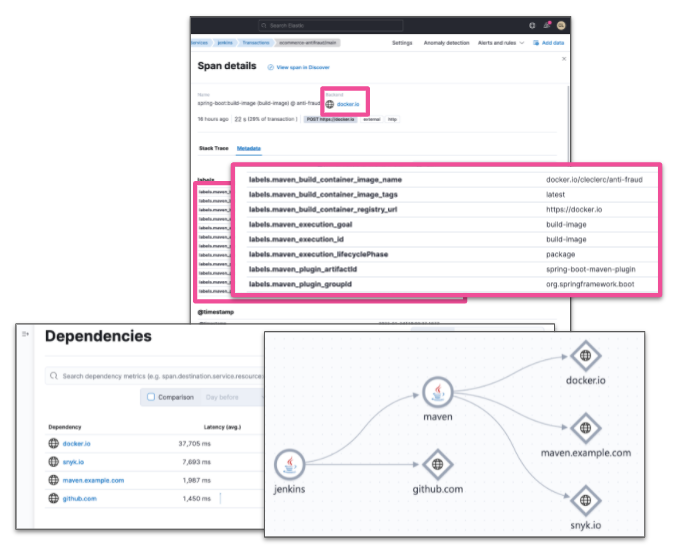
Details are automatically captured on any Maven goal execution that produces a Docker image. Remote systems like Docker registries and Maven artifact repositories used to upload artifacts are not reported.
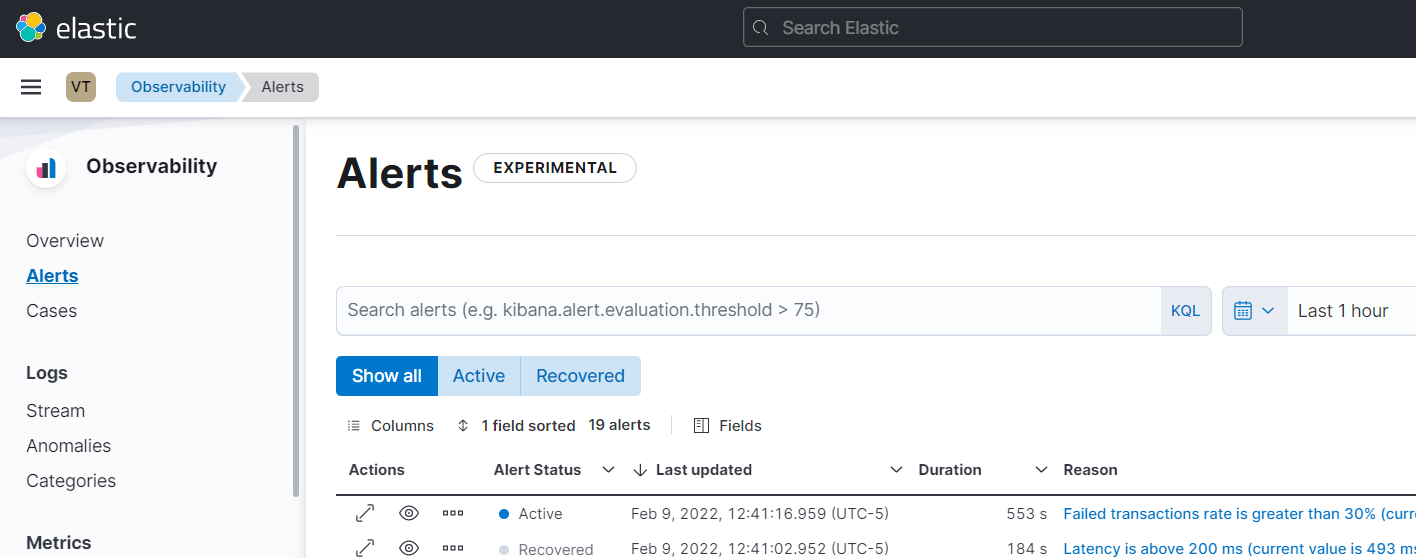
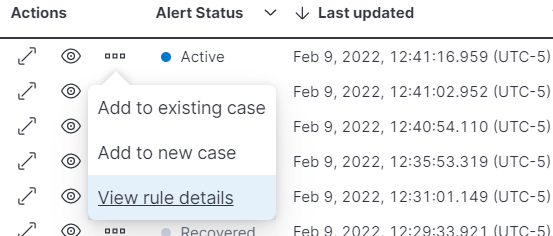
Better alerting views and management
editWe’re pleased to release a number of enhancements that make it easier to view and manage alerts. From within the Alerts app you can now easily view the rule definition for an alert, and filter on active/recovered alerts. Any changes you make to your Alerts app will now persist so you can finetune your dashboard and navigate back and forward without losing your preferences.
The Alerts app is currently an experimental feature within Observability and we encourage you to provide feedback via the Discuss link provided within the app.
Easy secure connection to Elasticsearch from Elastic Agent and Beats
editElasticsearch now has security on by default in on-prem clusters, making it much easier to set up a secure connection from Beats and Elastic Agent. Previously, you had to use a separate tool to create SSL certificates, which added several steps to the setup process. If you don’t want to create your own, Elasticsearch can automatically generate them for you. It will display a fingerprint for the certificate authority in the console output. When you install Beats and Elastic Agent, you can pass this fingerprint to validate the certificate. This makes securing the connection to Elasticsearch as easy as copying and pasting a single string.
For example, when you’re setting up Fleet Server for the first time, Kibana will show you a command to run to install the Elastic Agent. You can pass the fingerprint to the installer like this:
sudo ./elastic-agent install \
--fleet-server-es=https://localhost:9200 \  --fleet-server-service-token=AAEAAWVsYXN0aWMvZmxlZXQtc2VydmVyL3Rva2VuLTE2MzczMzUzMzU1Mzc6VDFTS1h5QkFSQkM5bWJPc1JlTlNhZw \
--fleet-server-policy=2d920850-494c-11ec-8478-9d8359796ea6 /
--fleet-server-es-ca-trusted-fingerprint 25c9d847ec0dc4a03228063662a6a944faf1a35fd0078de786ecd99b58b06ae5
Fleet will automatically pass the SSL certificate information to Elastic Agents enrolled in Fleet. We have similar fingerprint parameters for Elastic Agent running in standalone mode and Beats. Please see the Integrations app in Kibana for instructions or see the documentation.