Kibana highlights
editKibana highlights
editThis list summarizes the most important enhancements in Kibana 7.7.
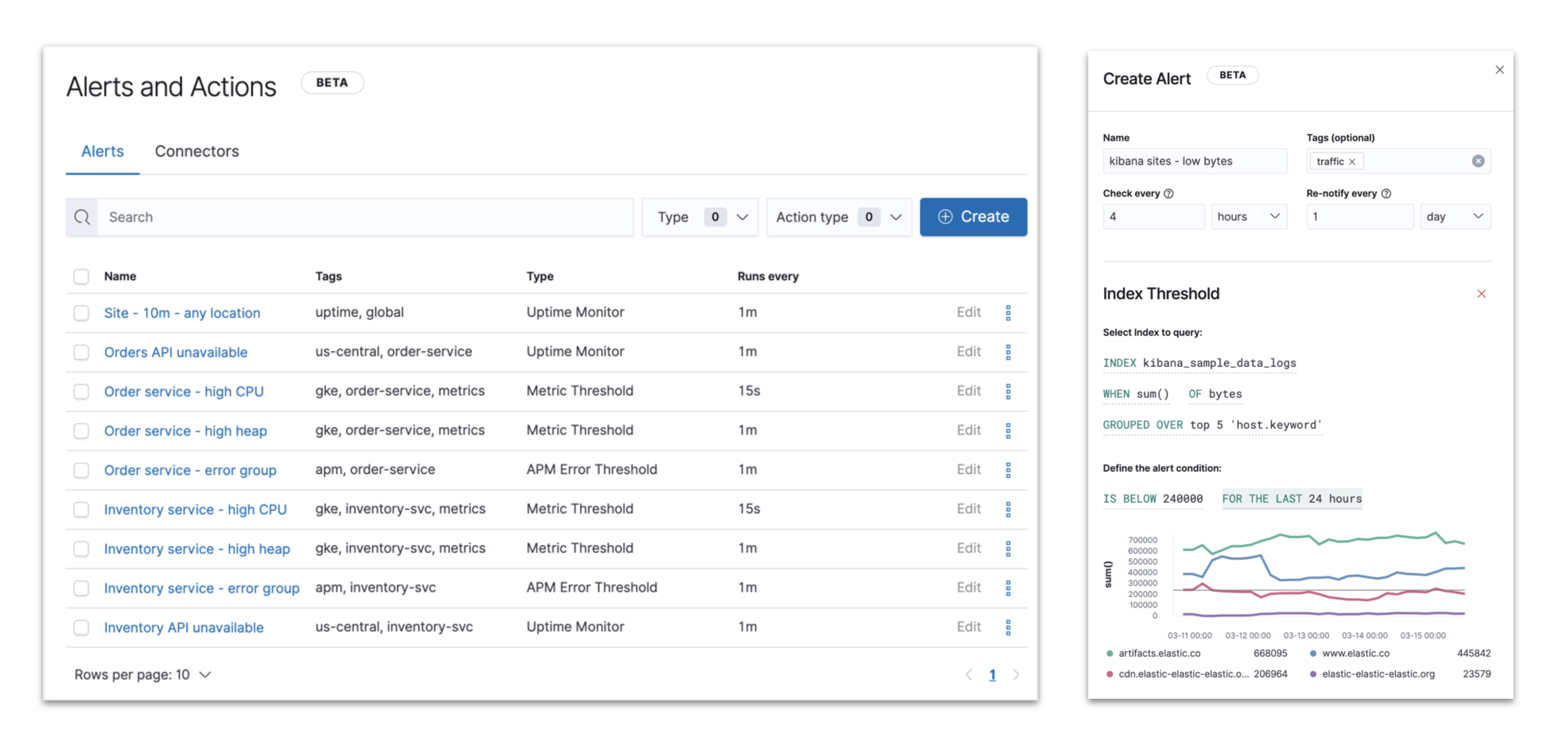
New alerting framework
edit[beta] This functionality is in beta and is subject to change. The design and code is less mature than official GA features and is being provided as-is with no warranties. Beta features are not subject to the support SLA of official GA features. Alerting allows you to detect complex conditions in Kibana apps and trigger actions when those conditions are met. Alerting is integrated with APM, Metrics, SIEM, and Uptime and is centrally managed from Management. Alerting has built-in actions and alerts for you to use.
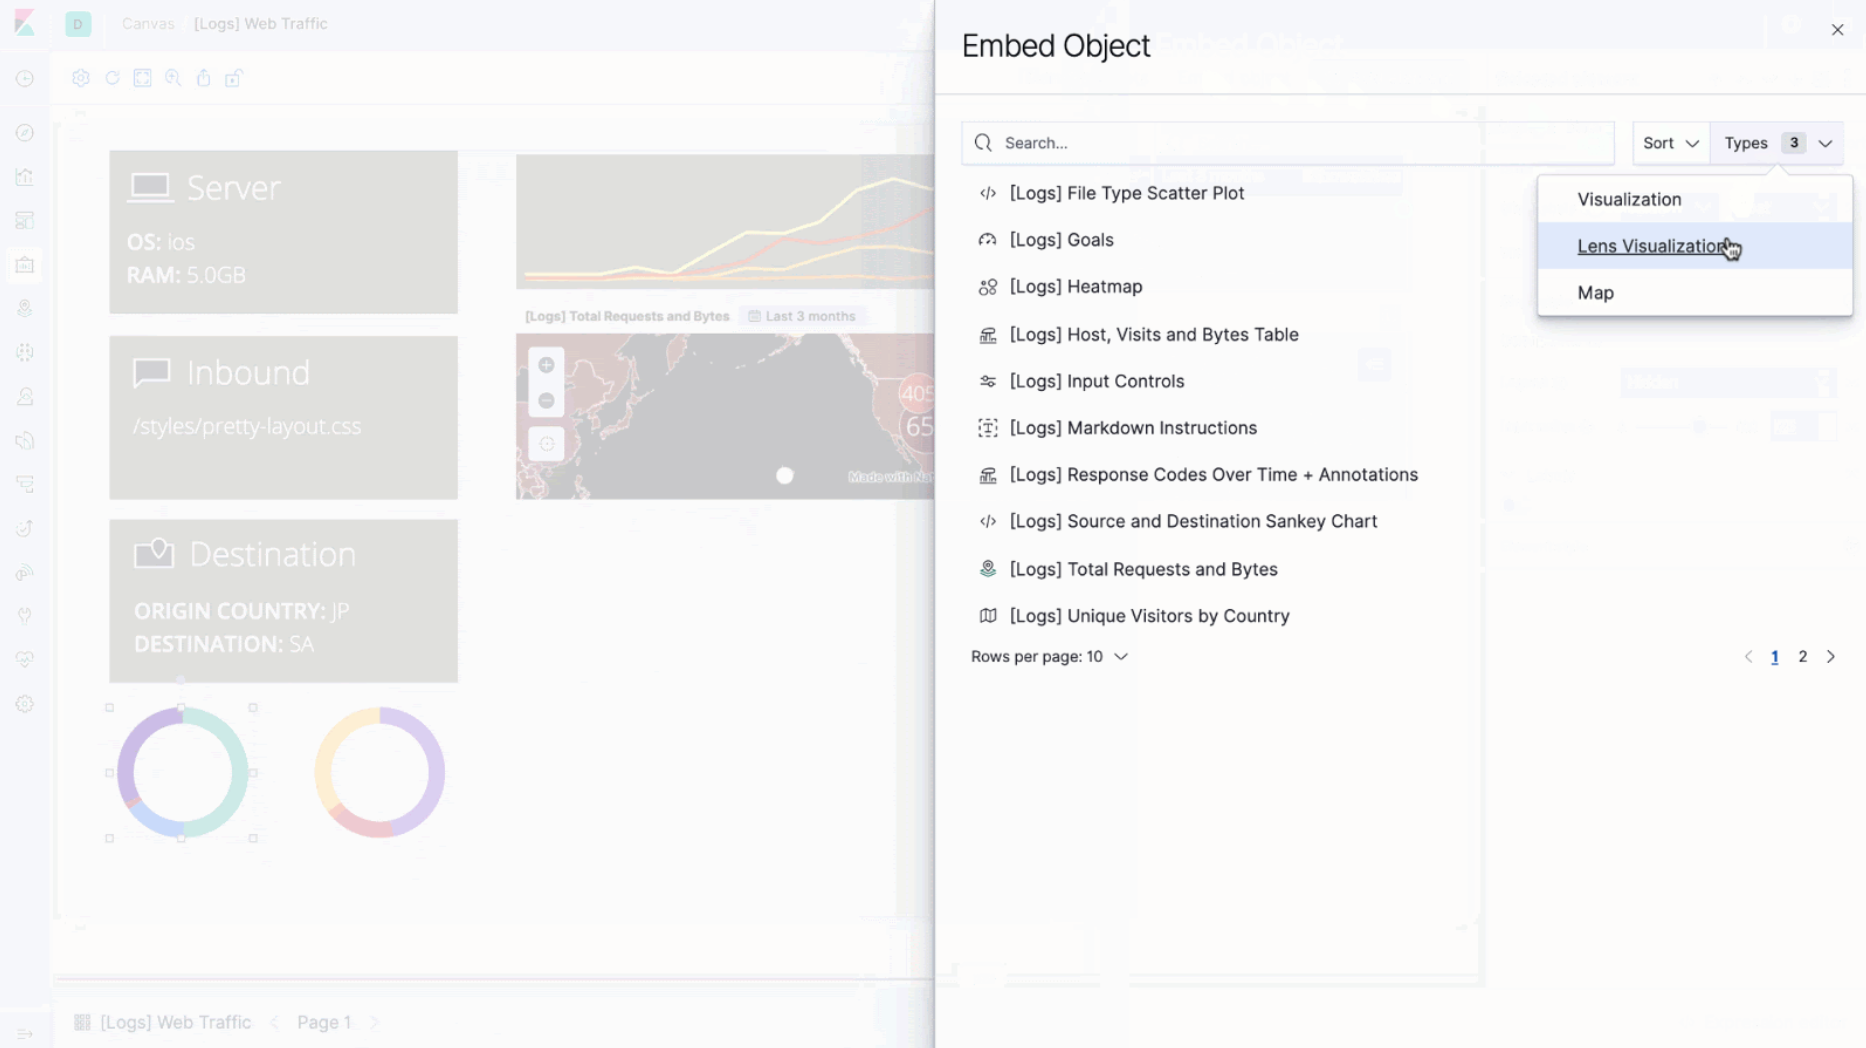
Canvas with your visualizations
editVisualizations that you created in Lens, Visualize, and TSVB can now be embedded in a Canvas workpad. This makes it easier for you to brand your Canvas presentation to your executive team and partners.
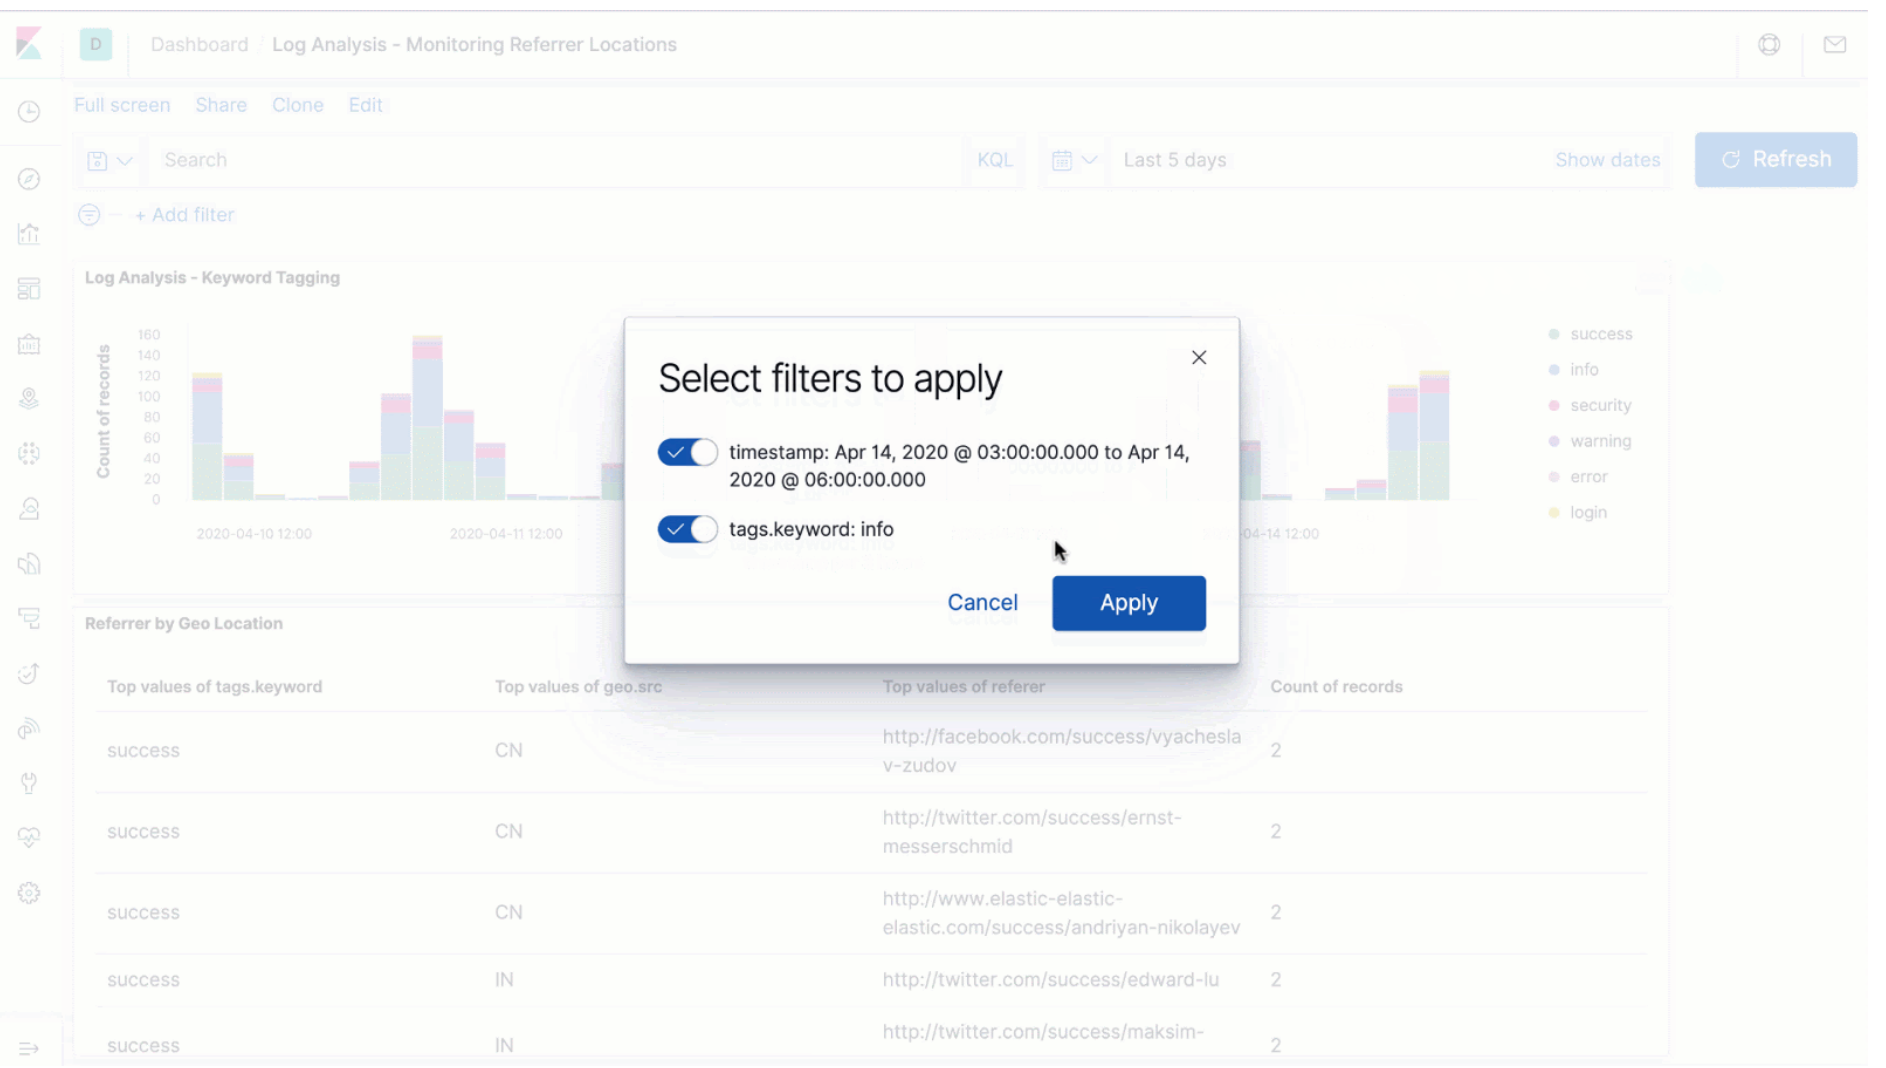
Improved filtering of Lens visualizations in dashboards
editDigging into the Lens visualizations on your dashboard just got faster. You can now filter the data in one Lens visualization, and immediately apply that filter to all Lens visualizations on the dashboard.
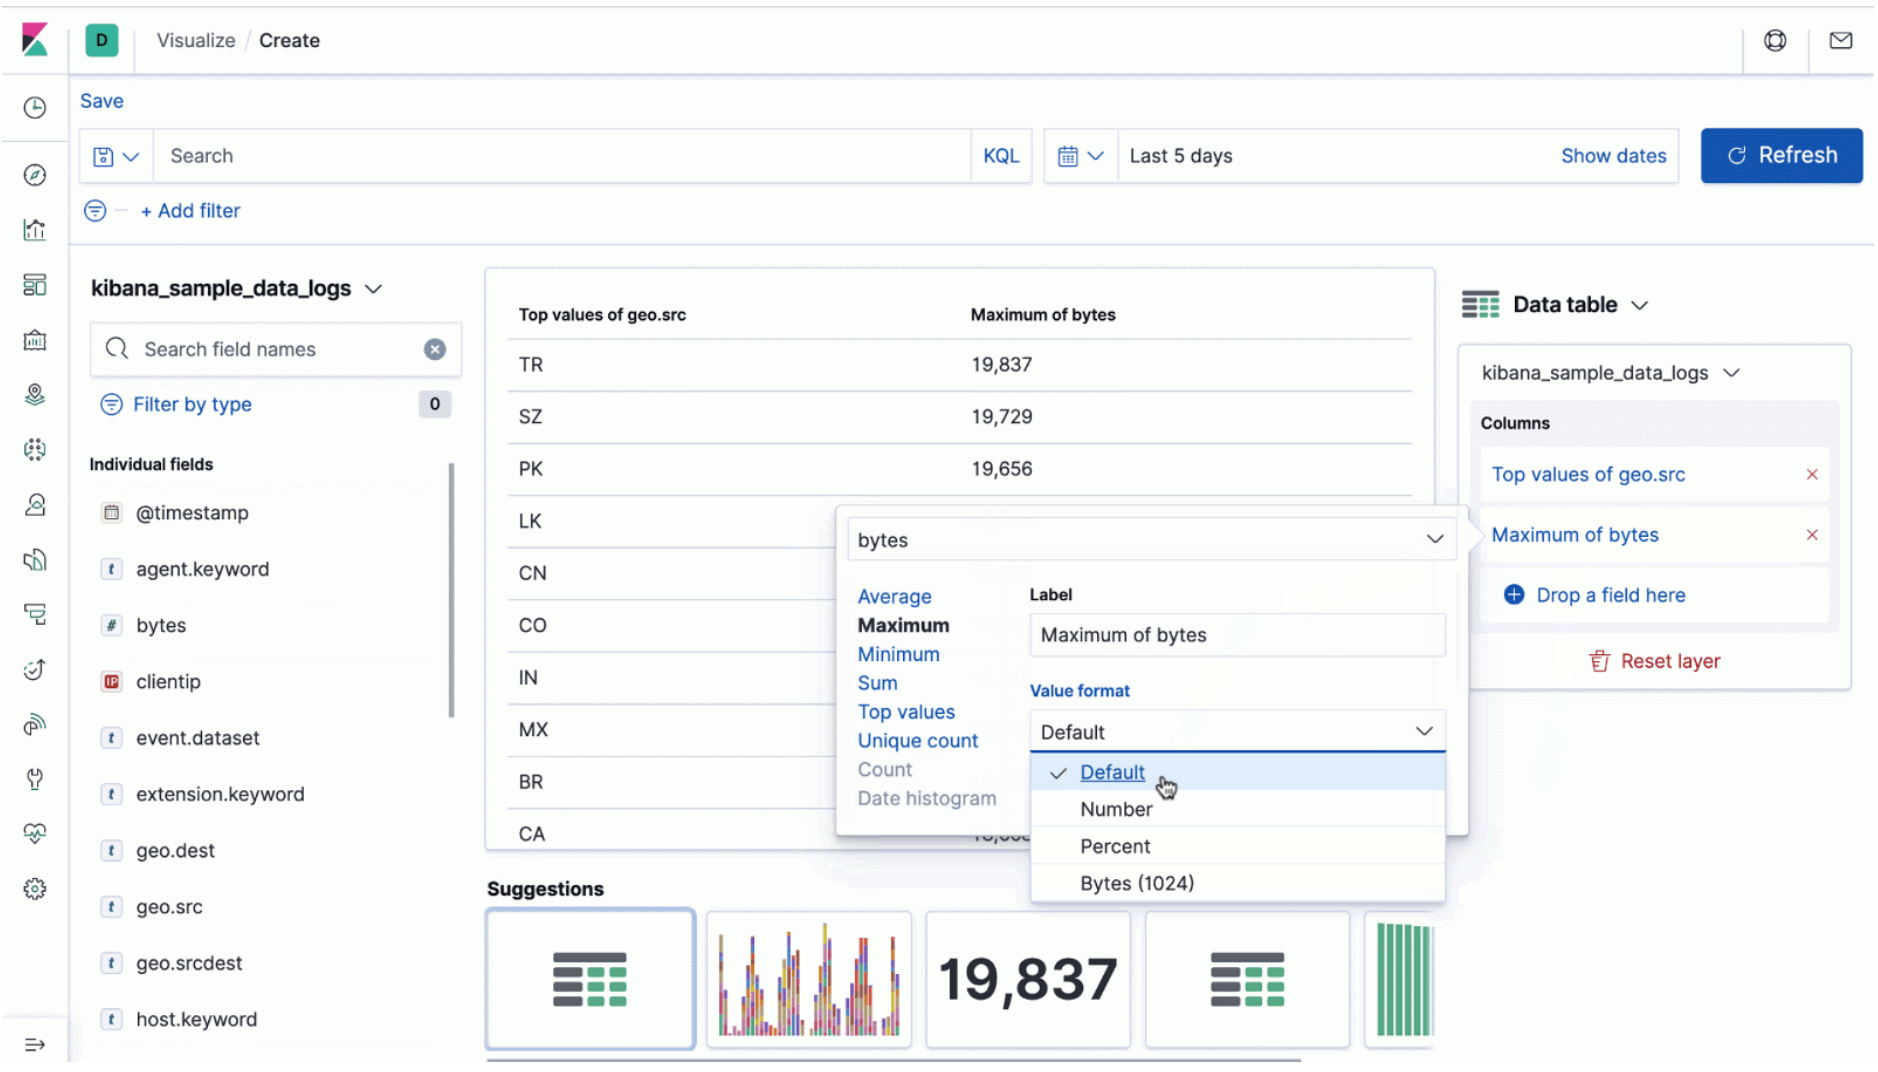
Number formatting in Lens
editTo accurately display the data in Lens visualizations, try out the new number formats. The new dropdown has options for formatting numbers as percentages and bytes. There’s also a field for setting how many decimal places to display.
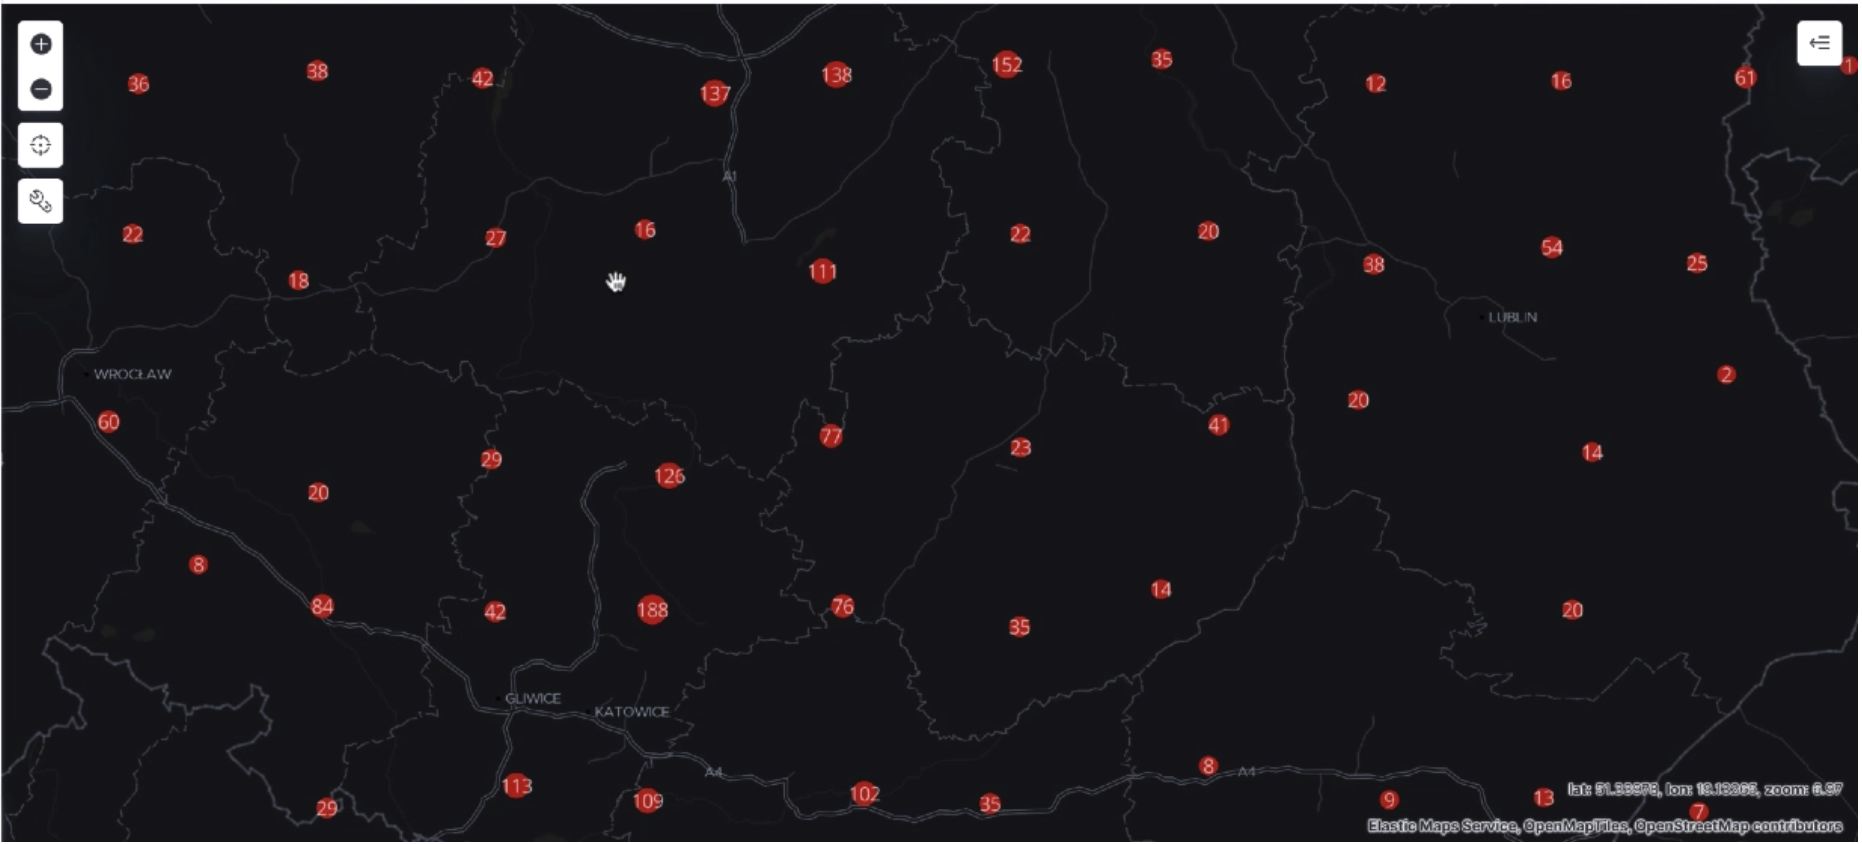
Individual map points on zoom
editElastic Maps improves the way you work with large amounts of coordinate data. With the new default setting, points are clustered on a map until you zoom into an area with less than 10,000 discrete points. Then, you’ll see individual points. This feature is useful for map data points that are in both dense urban areas and rural locations.
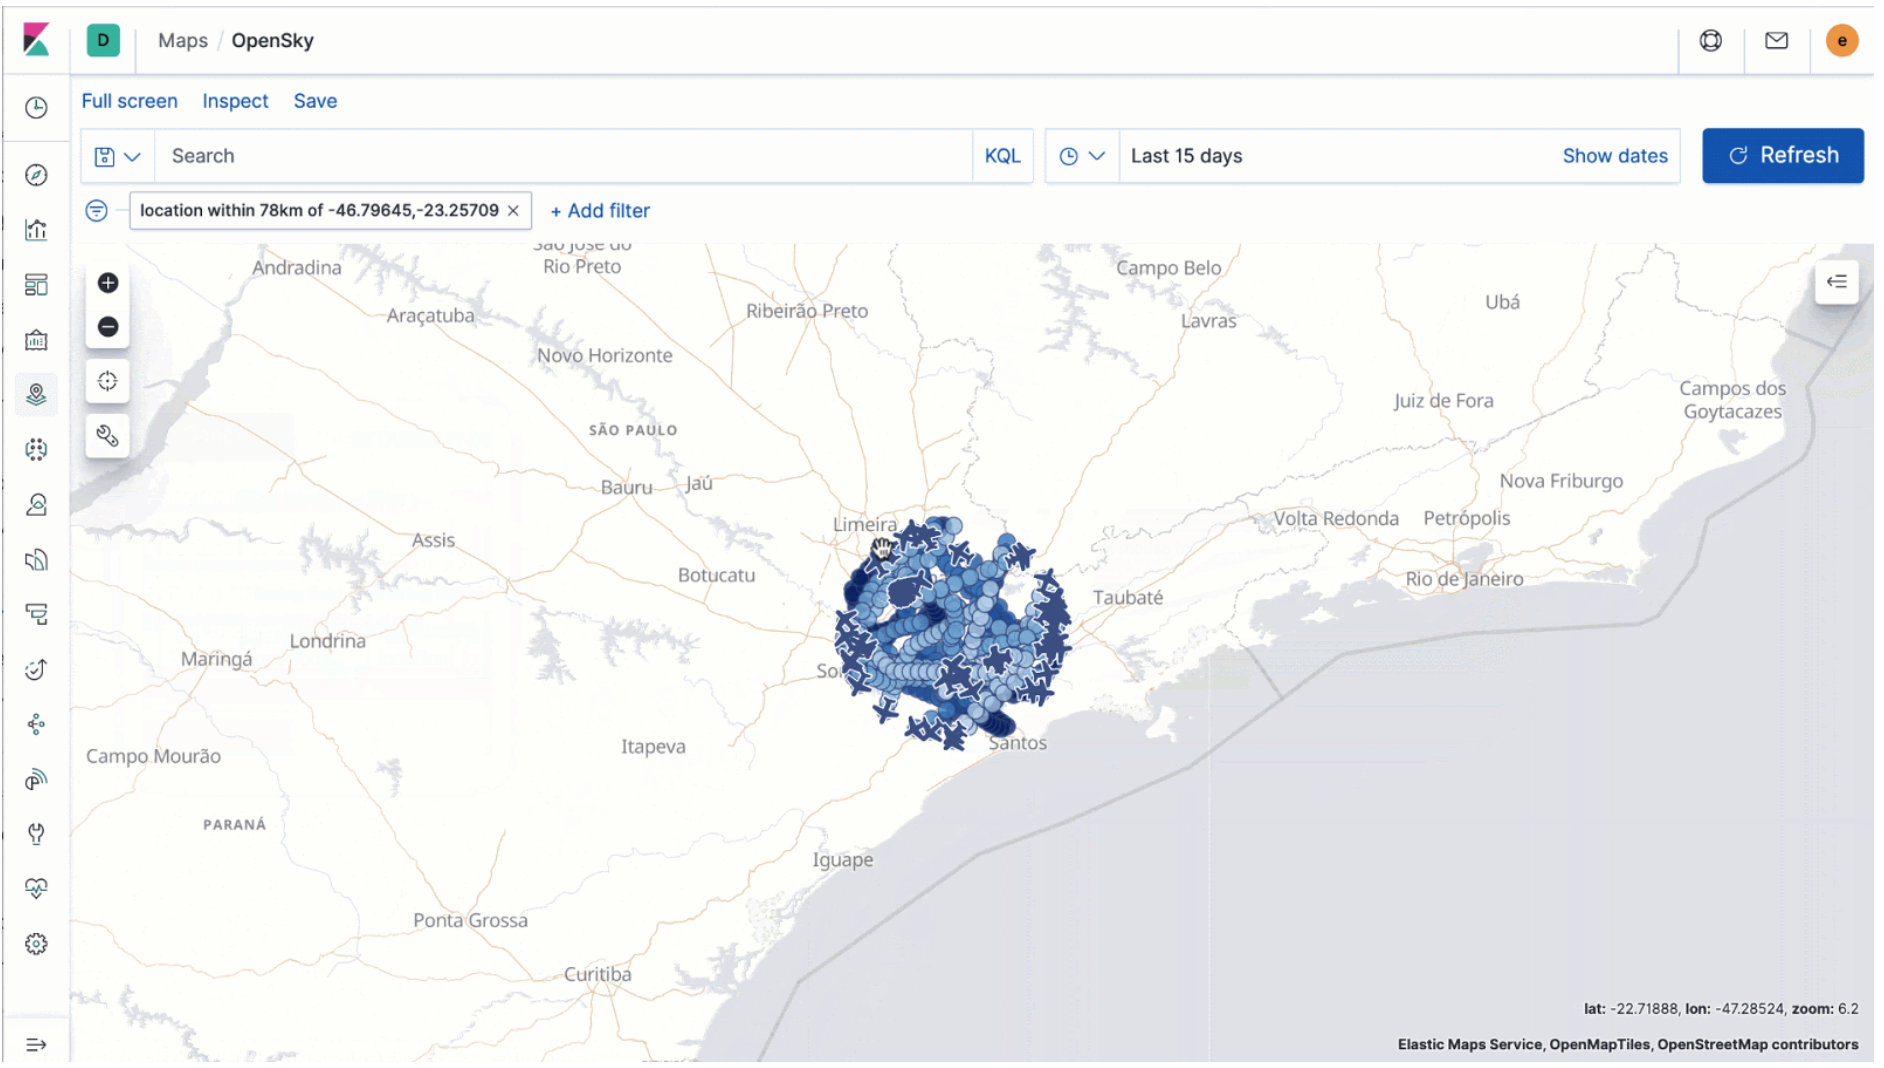
Distance filters in Elastic Maps
editThe distance filter is a new way to filter map data within a specific radius. Simply select a central location, and then draw a circle around it with your mouse. The distance filter is in addition to the tools for filtering data by custom shape and by rectangular bound.
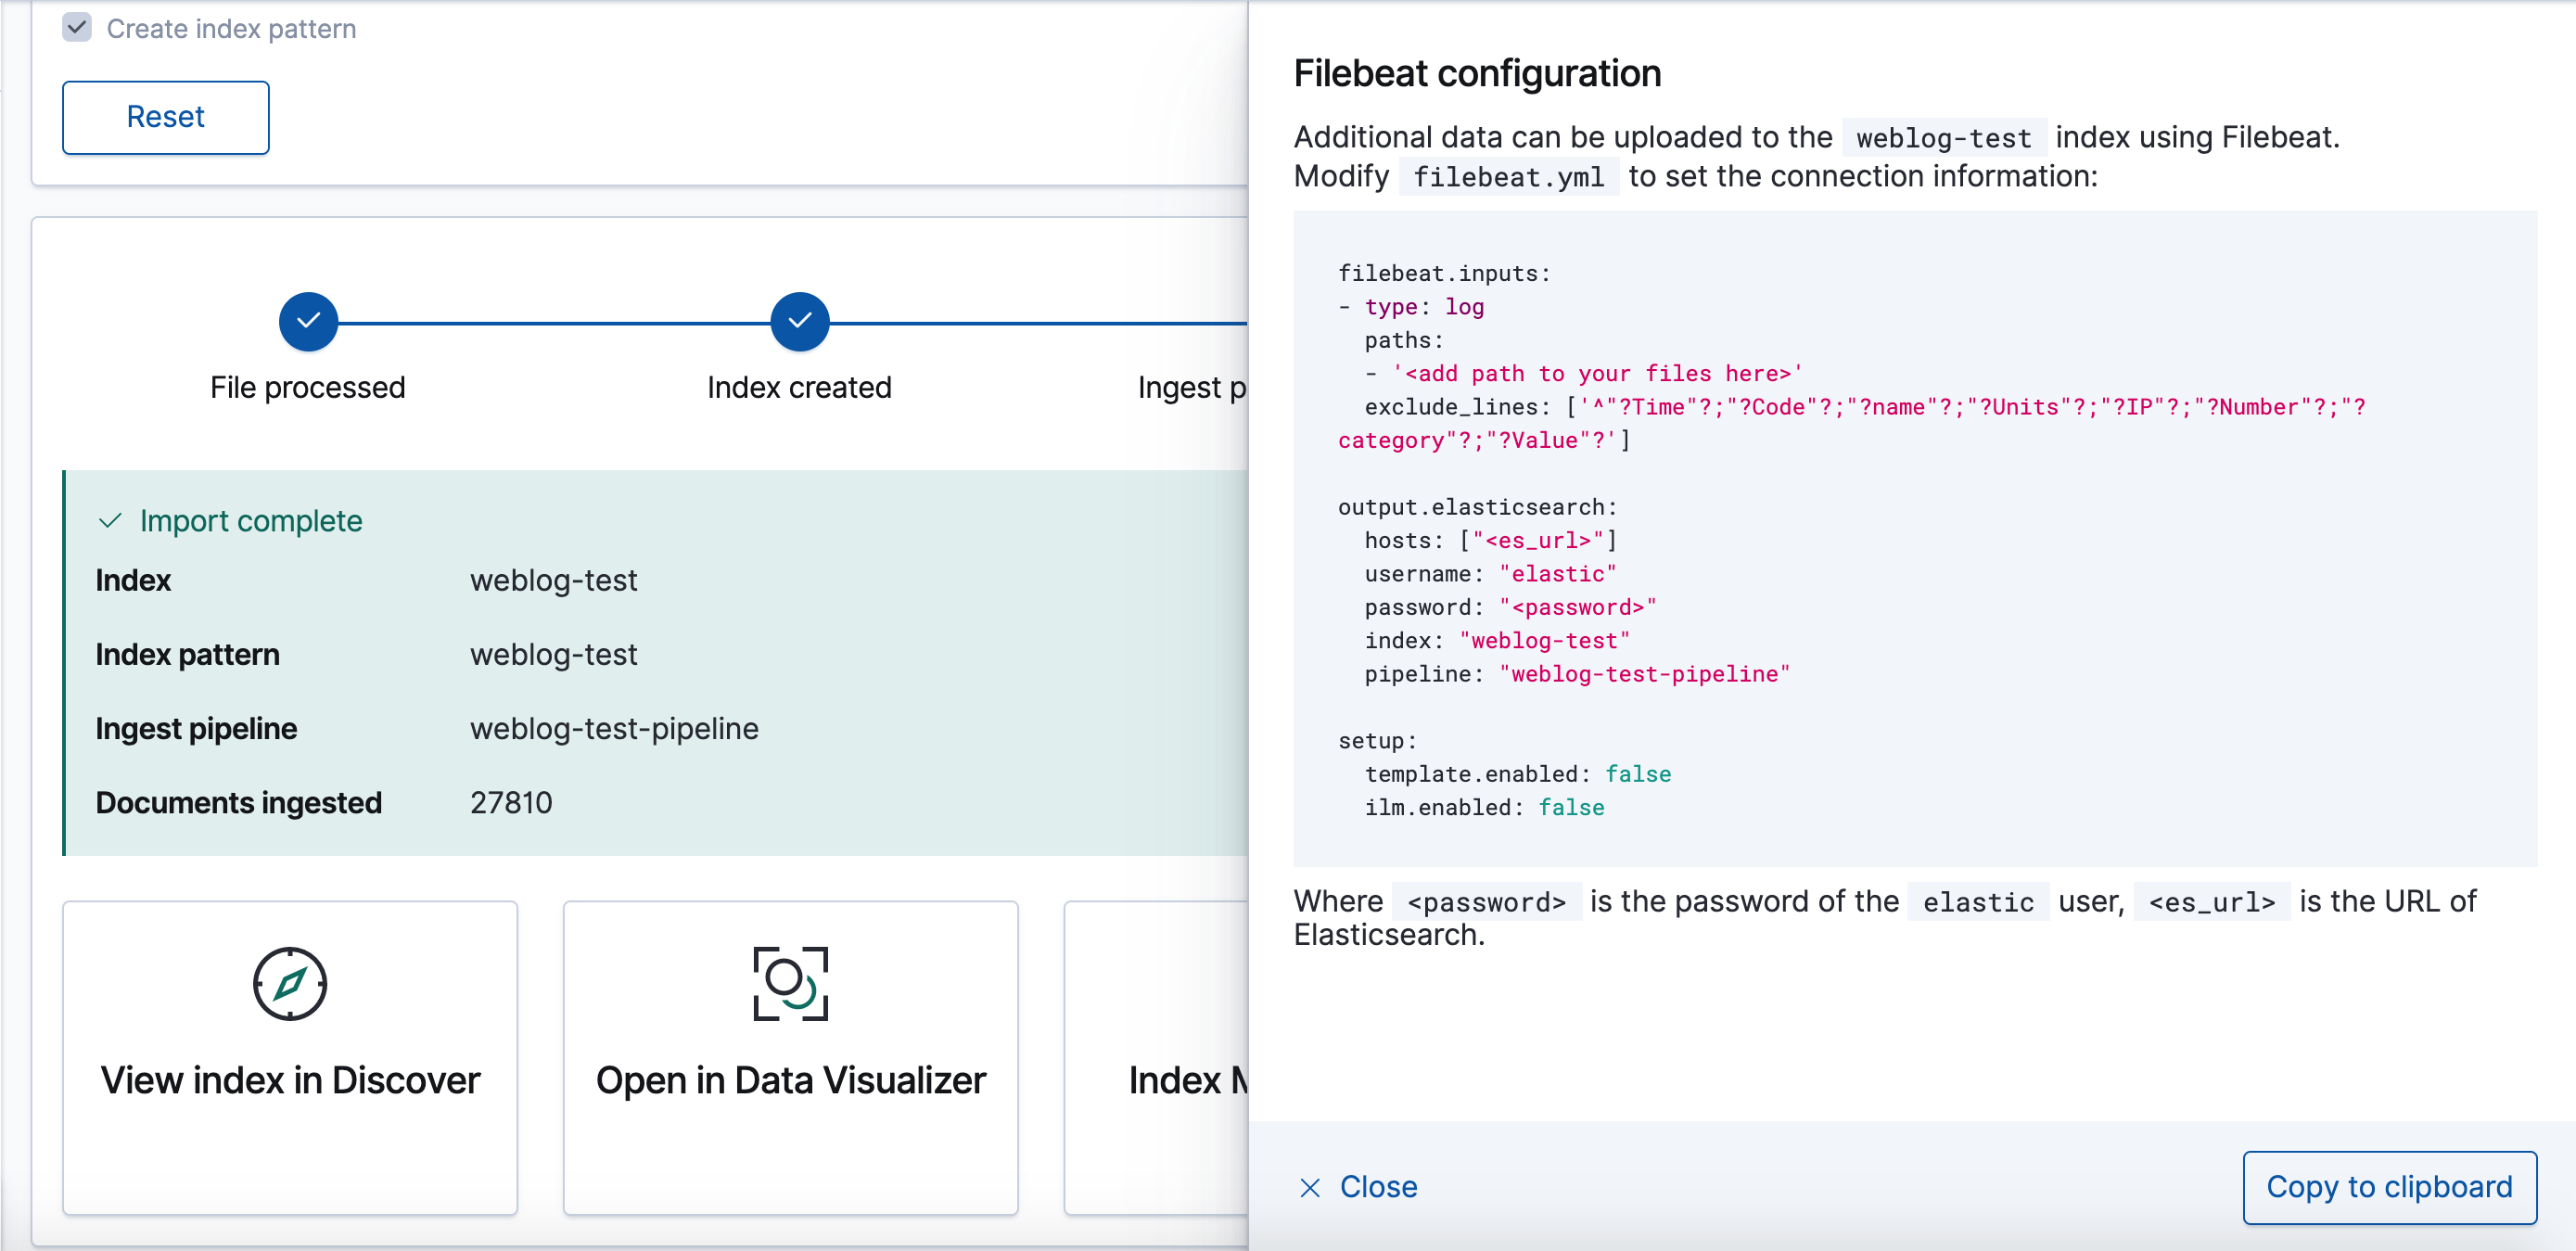
Data Visualizer now recommends Filebeat config
edit[preview] This functionality is in technical preview and may be changed or removed in a future release. Elastic will work to fix any issues, but features in technical preview are not subject to the support SLA of official GA features. When you upload a file to the Data Visualizer, a Filebeat configuration is recommended for you to use. You can then use Filebeat to add more data of the same structure to the same index that was created during an initial upload.
For more information about Data Visualizer, refer to Machine learning.
Learn more
editGet details on these release highlights and more in the Kibana 7.7 release blog. For a complete list of enhancements and other changes, check out the Kibana 7.7 release notes.