APM highlights
editAPM highlights
editThis list summarizes the most important enhancements in APM. For the complete list, go to APM release highlights.
- Experimental Jaeger integration
-
Elastic APM now integrates with Jaeger, an open-source, distributed tracing system. This integration allows users with an existing Jaeger setup to switch from the default Jaeger backend, to ingesting data with Elastic’s APM Server, storing data in Elasticsearch, and visualizing traces in the APM app. Best of all, this can be done without any instrumentation changes in your application code.
See Jaeger integration for more information.
- Experimental API Key authentication
- You can now secure the communication between APM Agents and APM Server with API keys. API keys are easy to create and manage, and provide finer authorization rules than secret tokens.
- SIEM integration
-
There are two, brand-new integrations with Elastic SIEM:
HTTP data collected with Elastic APM is now available in the SIEM app, enabling you to hunt for security threats with your APM data.
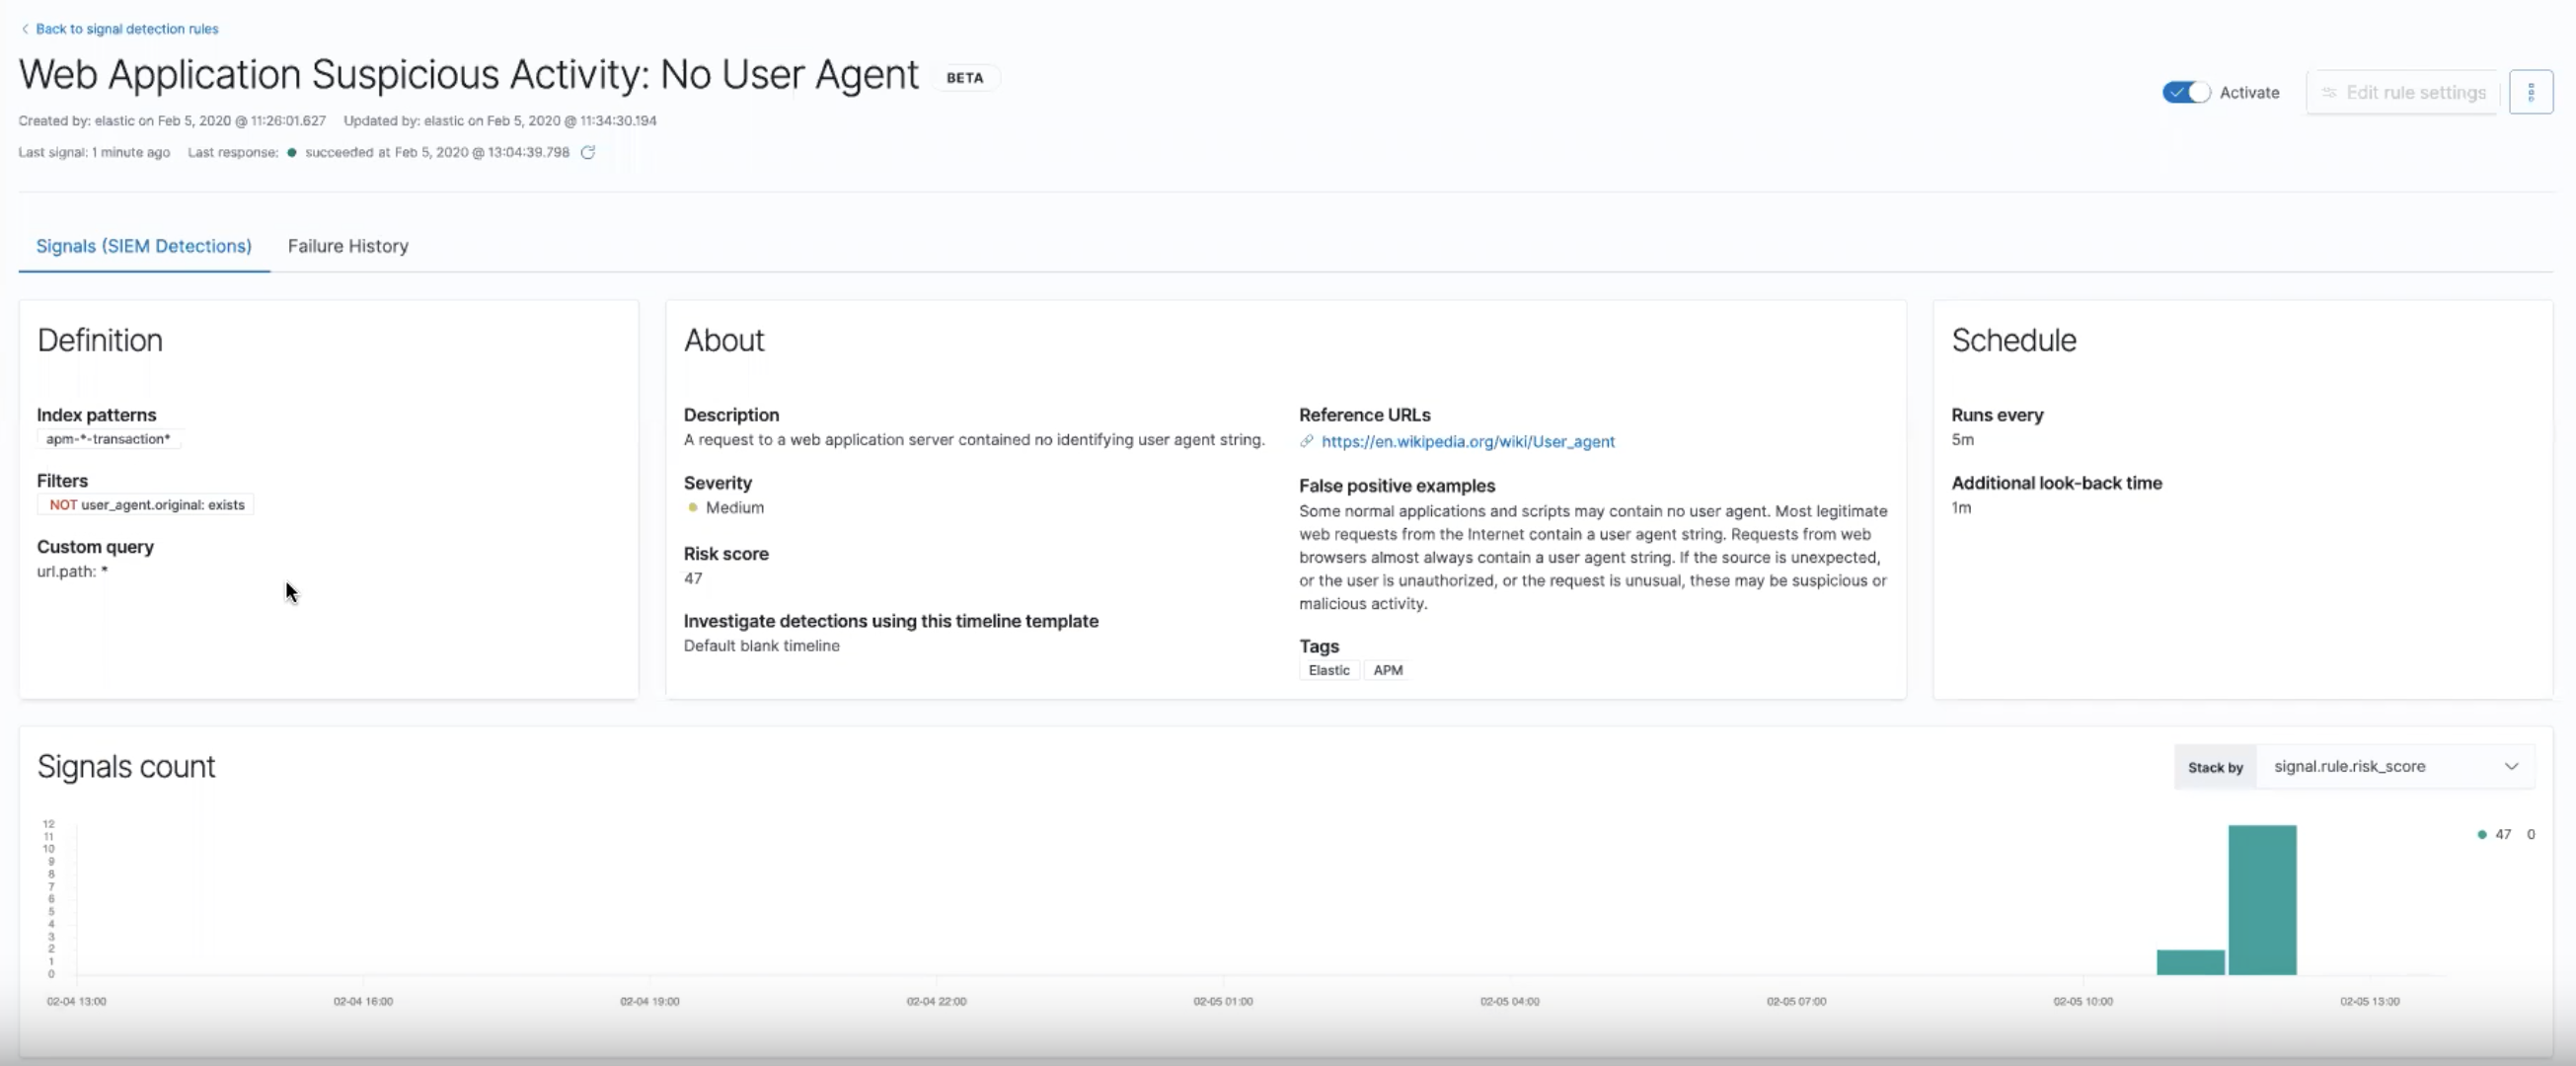
The SIEM Detections feature automatically searches for threats and creates signals when they are detected. The SIEM app ships with four prebuilt rules, specifically for the APM use case: No User Agent, POST Request Declined, Unauthorized Method, and sqlmap User Agent.
See the SIEM hosts UI and SIEM prebuilt rules for more information on using the SIEM app.
- Chained exceptions
-
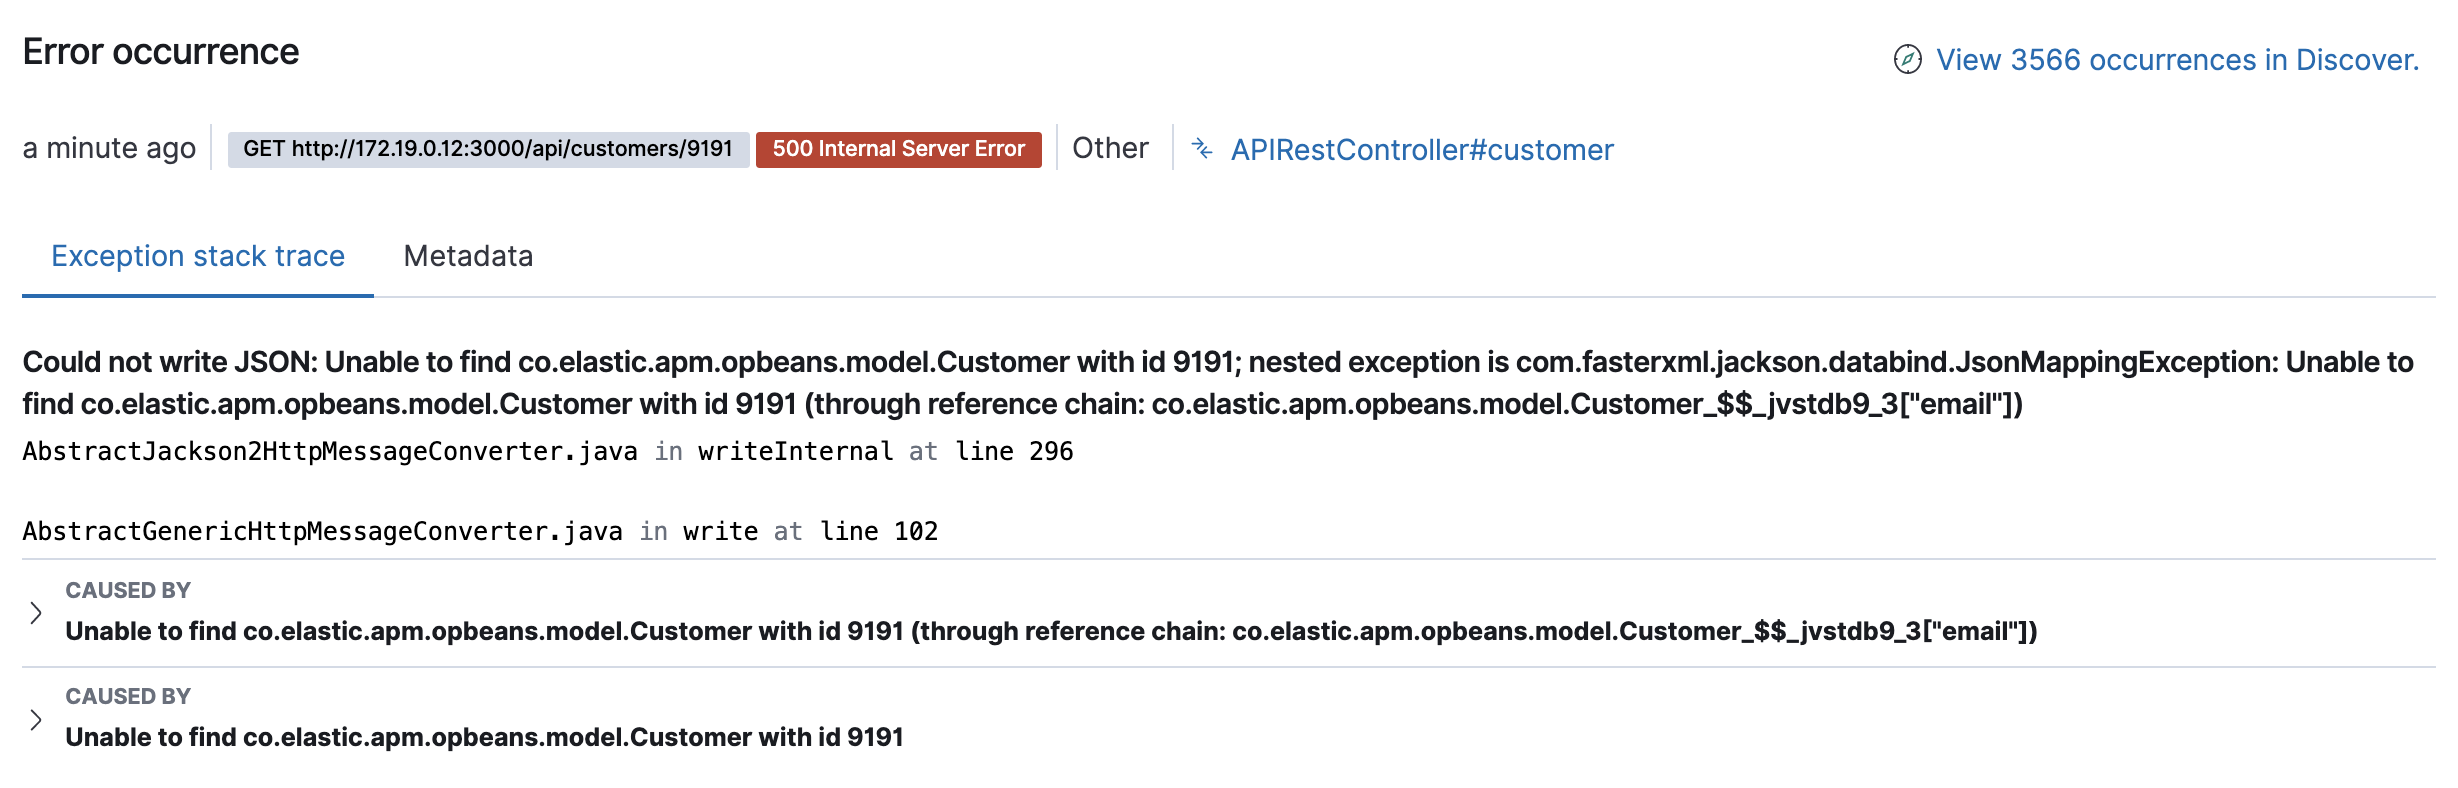
Sometimes, an exception can cause or be caused by another exception. APM Agents and the APM app now support chained exceptions, and you can visualize when this happens in the APM app!
- Deployment annotations
-
The APM app now displays deployment annotations on all transaction charts. This feature automatically tags new deployments, so you can easily see if your deploy has increased response times for an end-user, or if the memory/CPU footprint of your application has increased. Being able to quickly identify bad deployments enables you to rollback and fix issues without causing costly outages.
Deployment annotations are automatically enabled, and appear when the
service.versionof your app changes.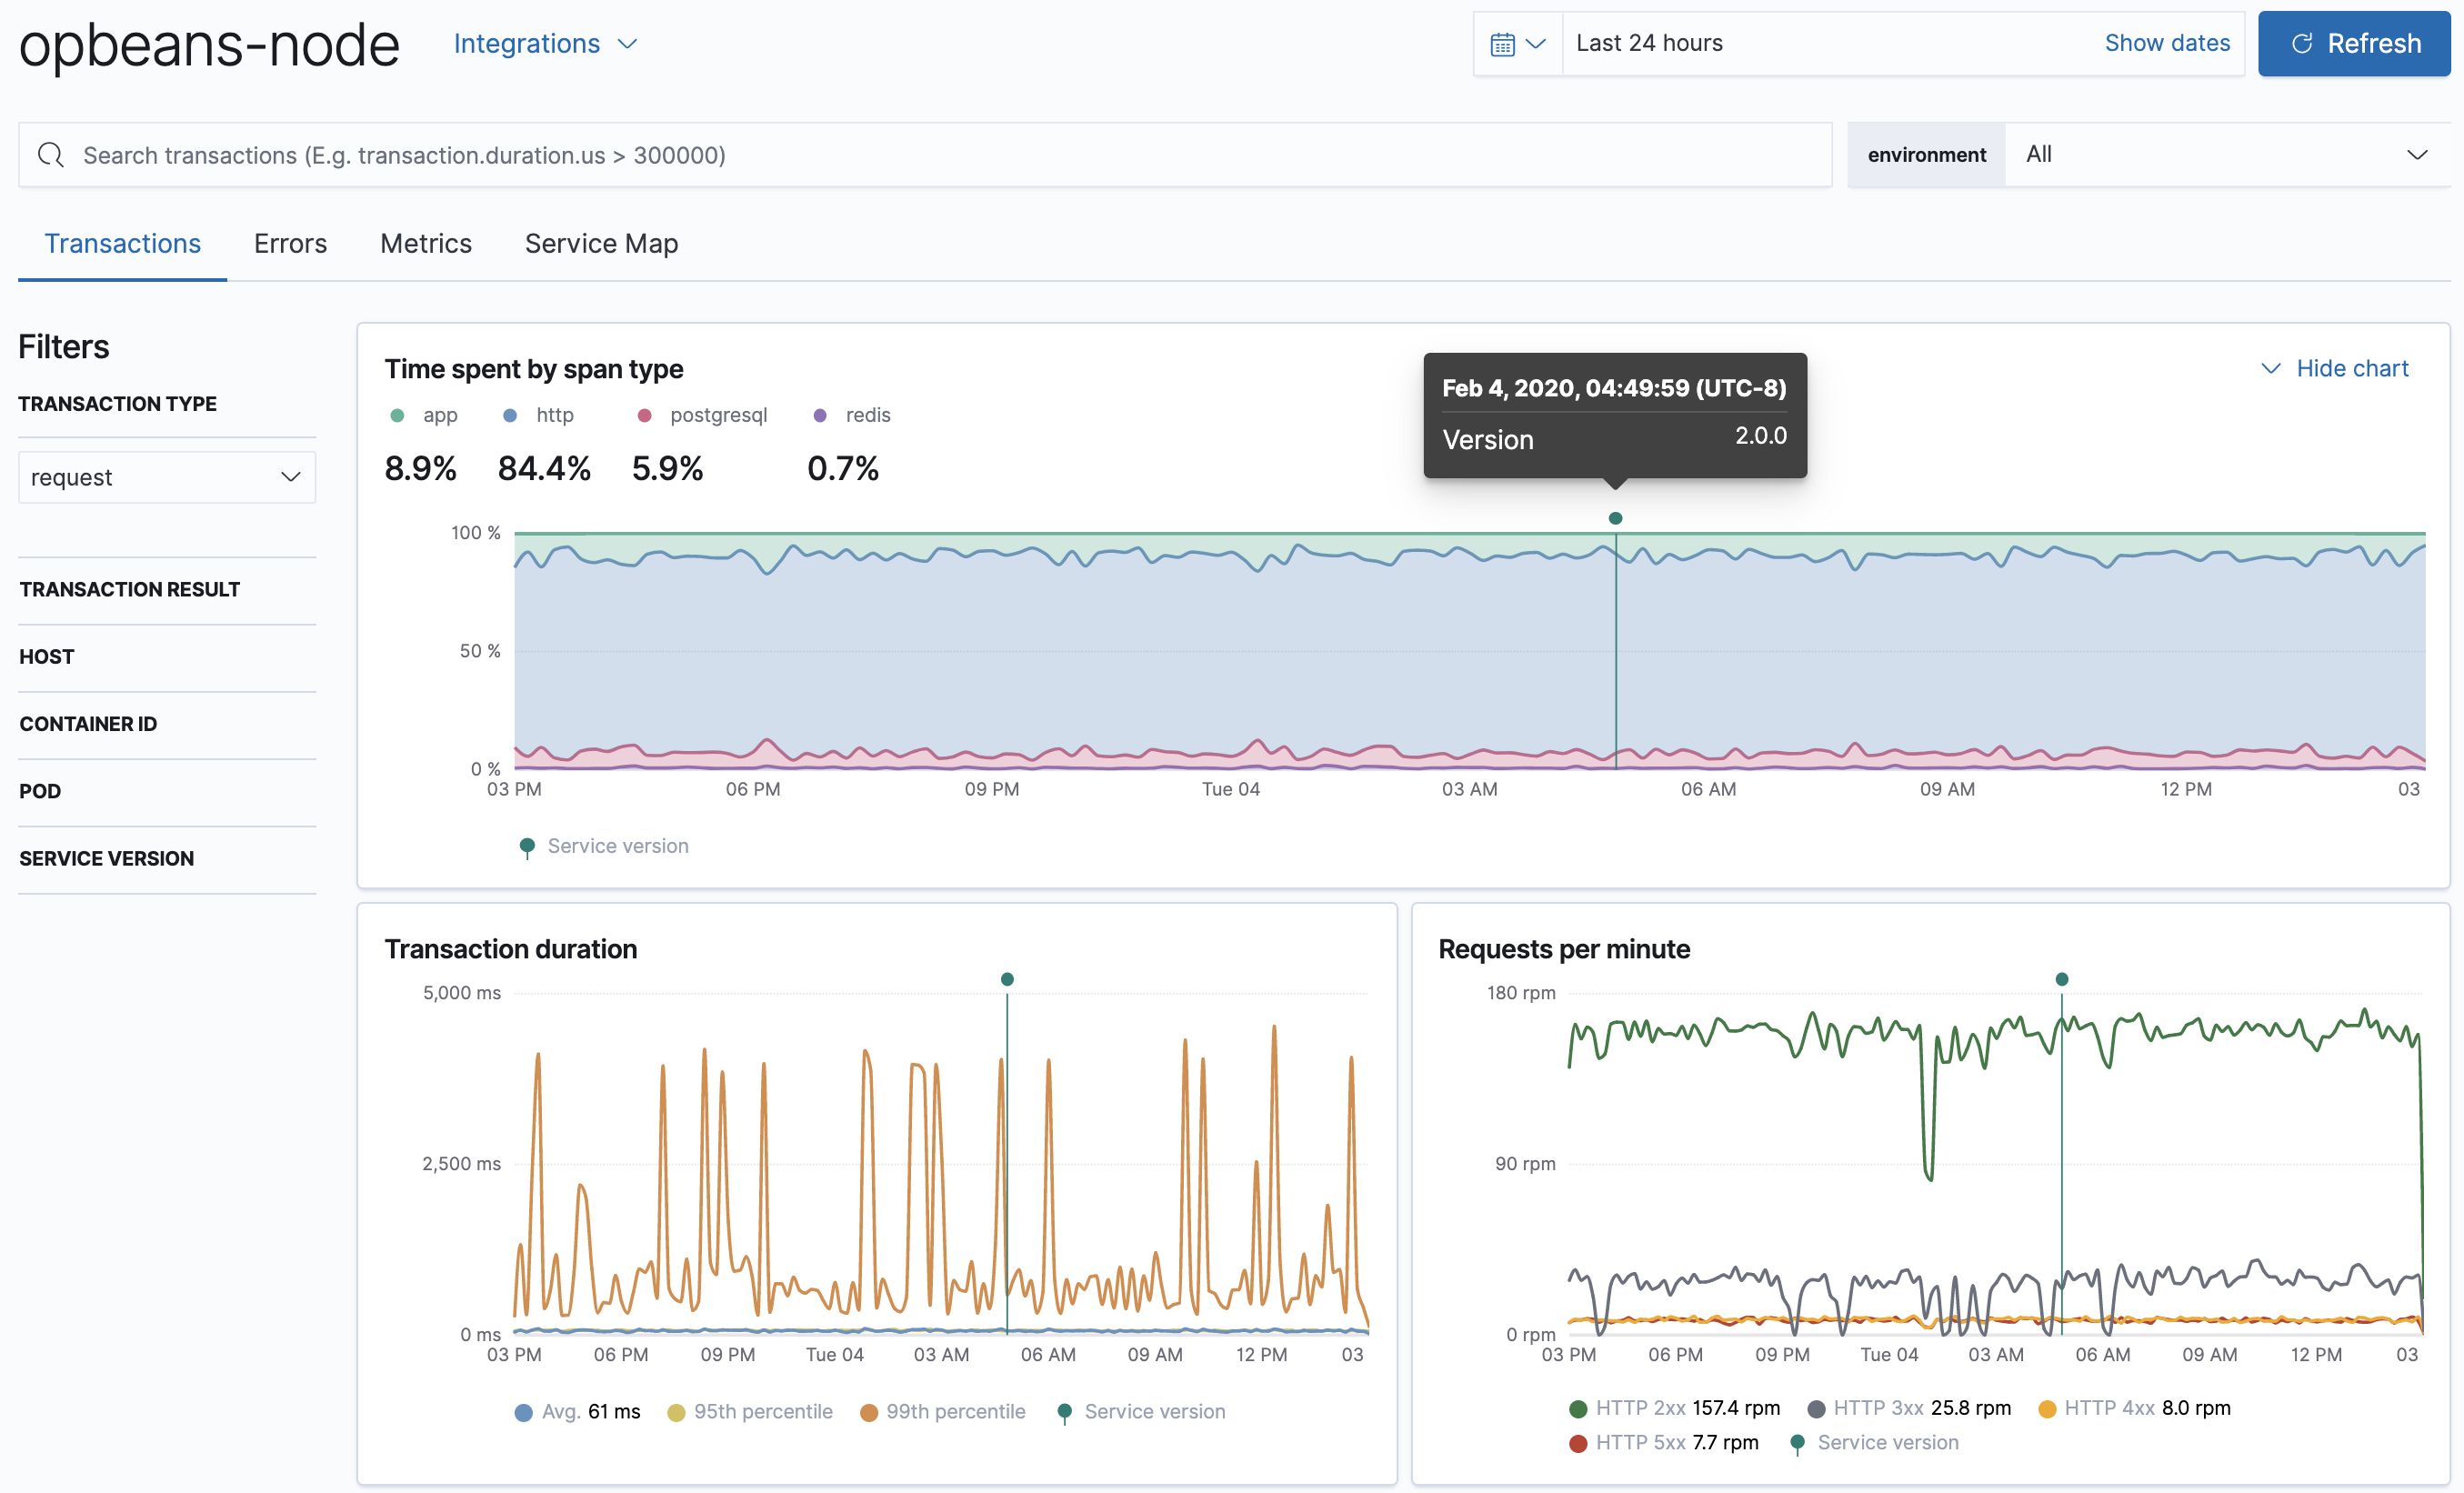
- Index configuration
-
Index defaults can now be changed in Kibana. If you use custom index names for your APM data, this feature makes it very easy to update the indices that the APM app queries. Simply navigate to APM > Settings > Indices, and make your changes! Index settings in the APM app take precedence over those set in kibana.yml.
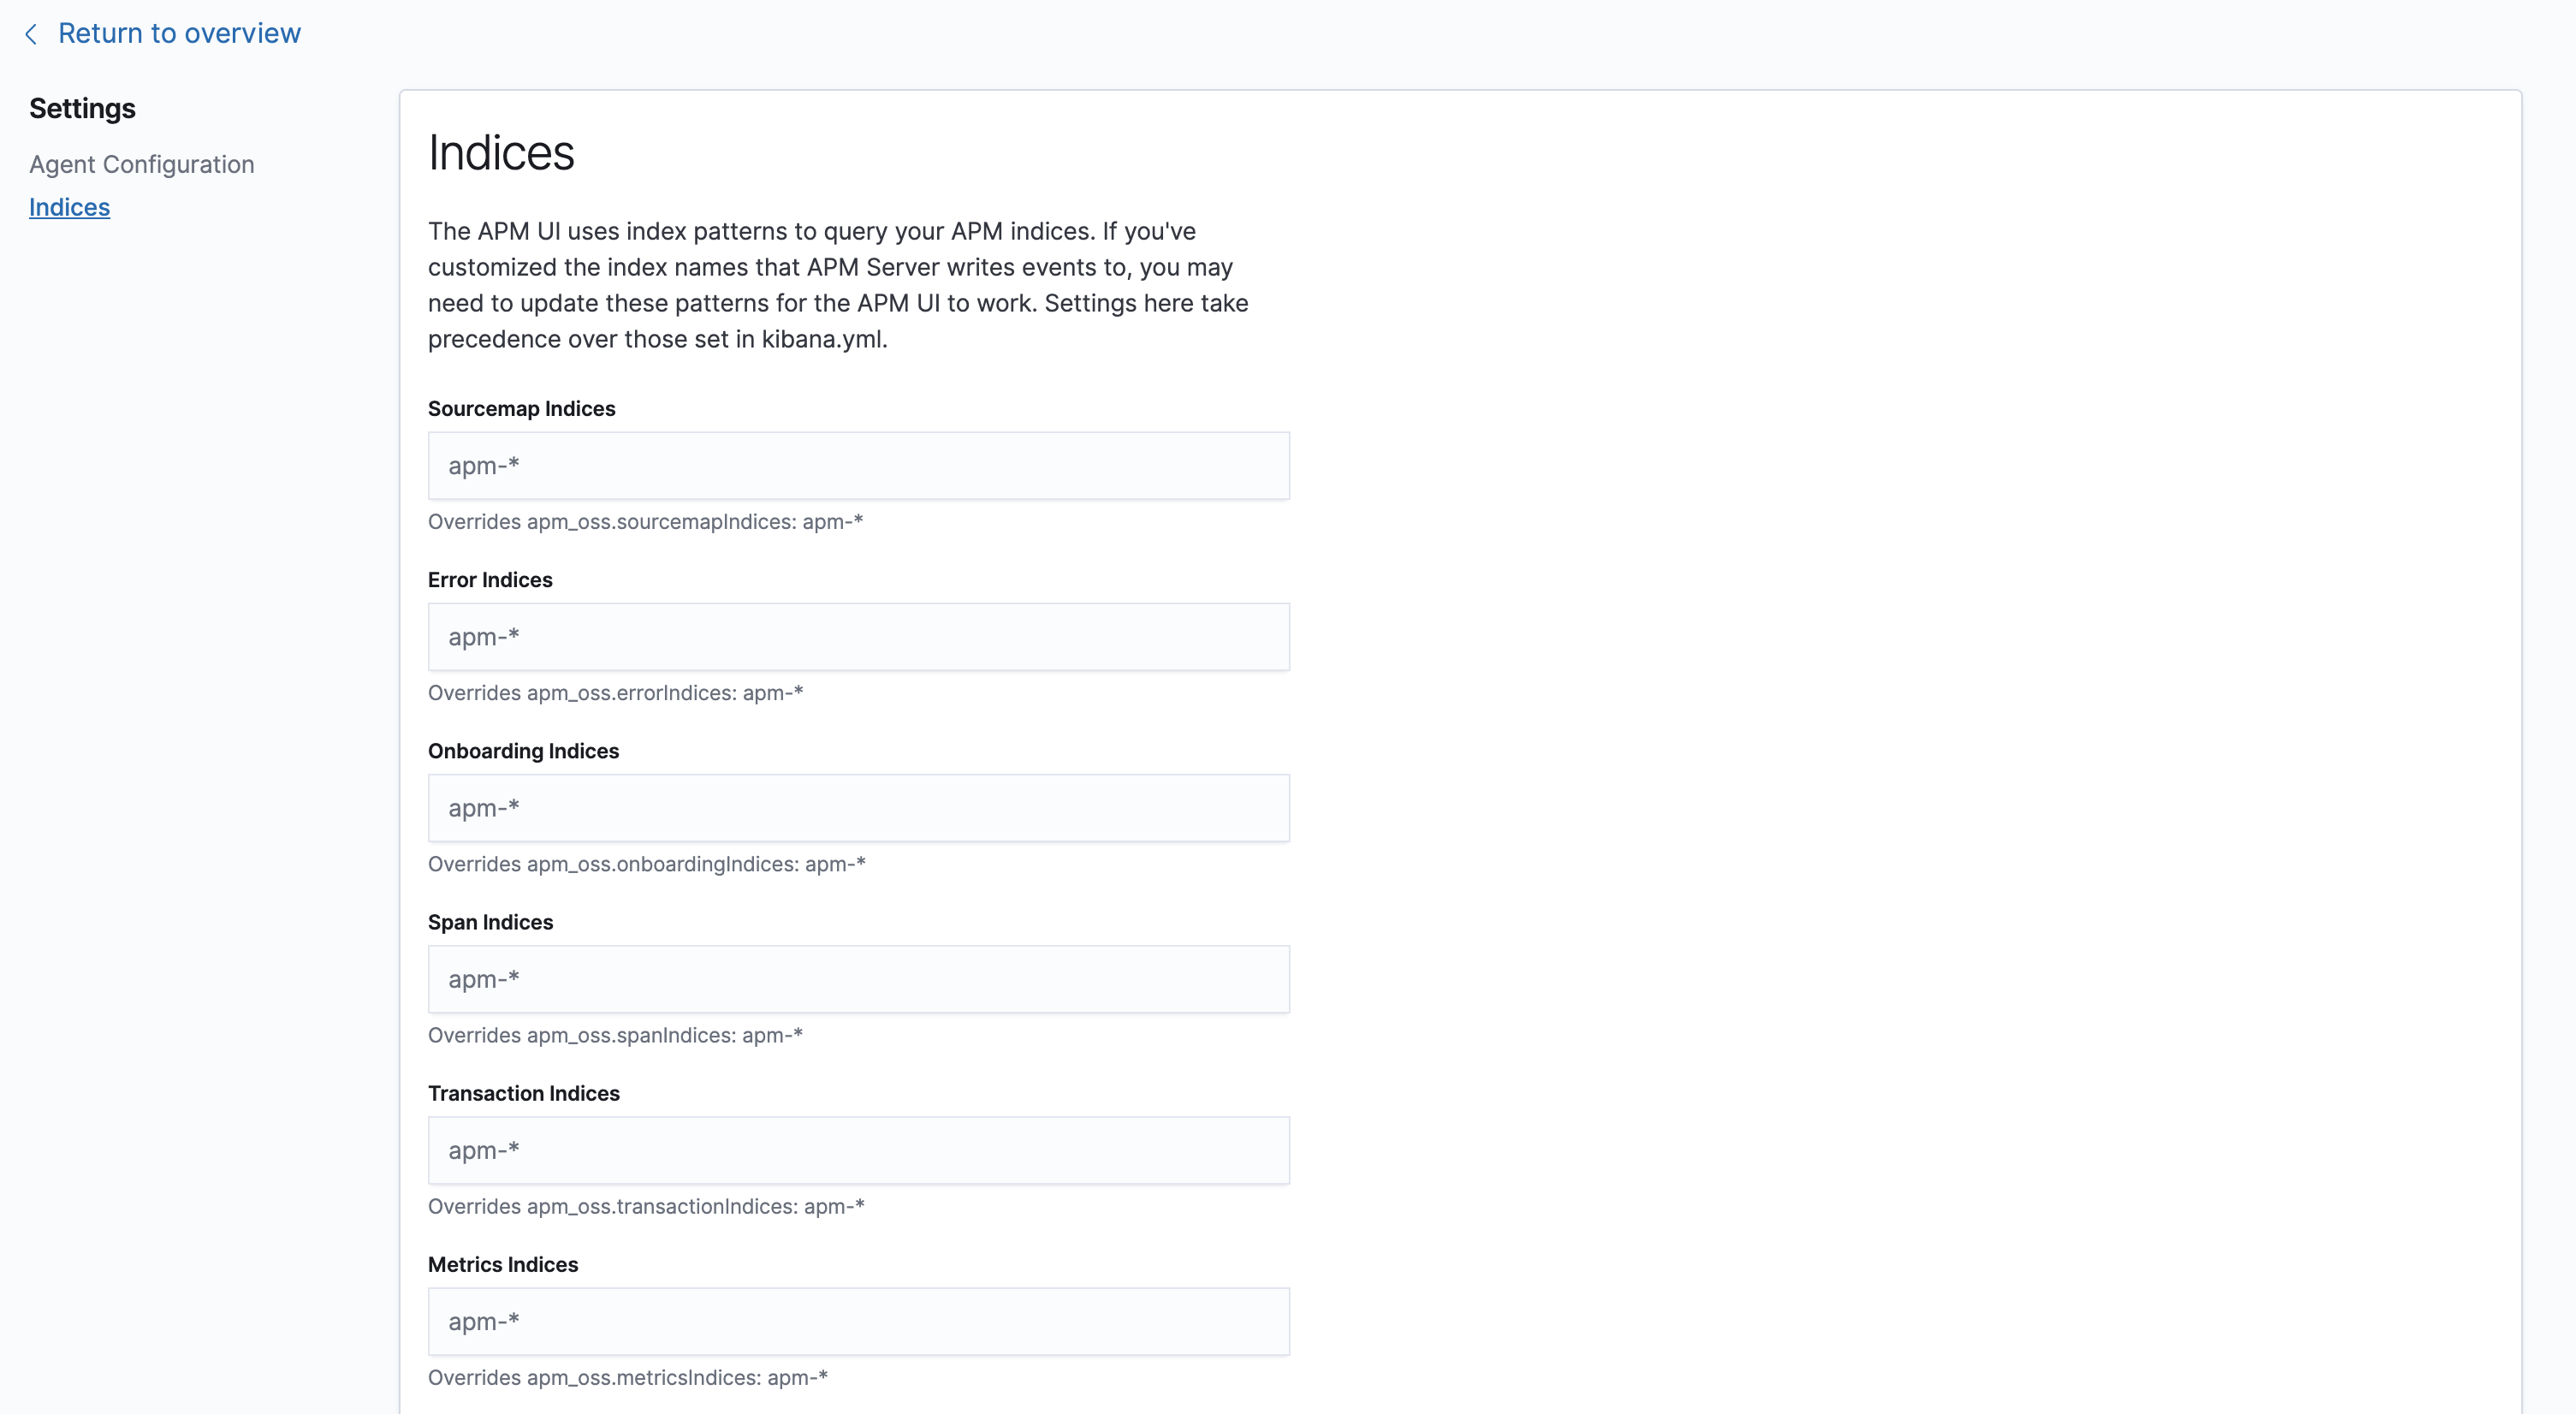
See APM Settings in Kibana for more details.
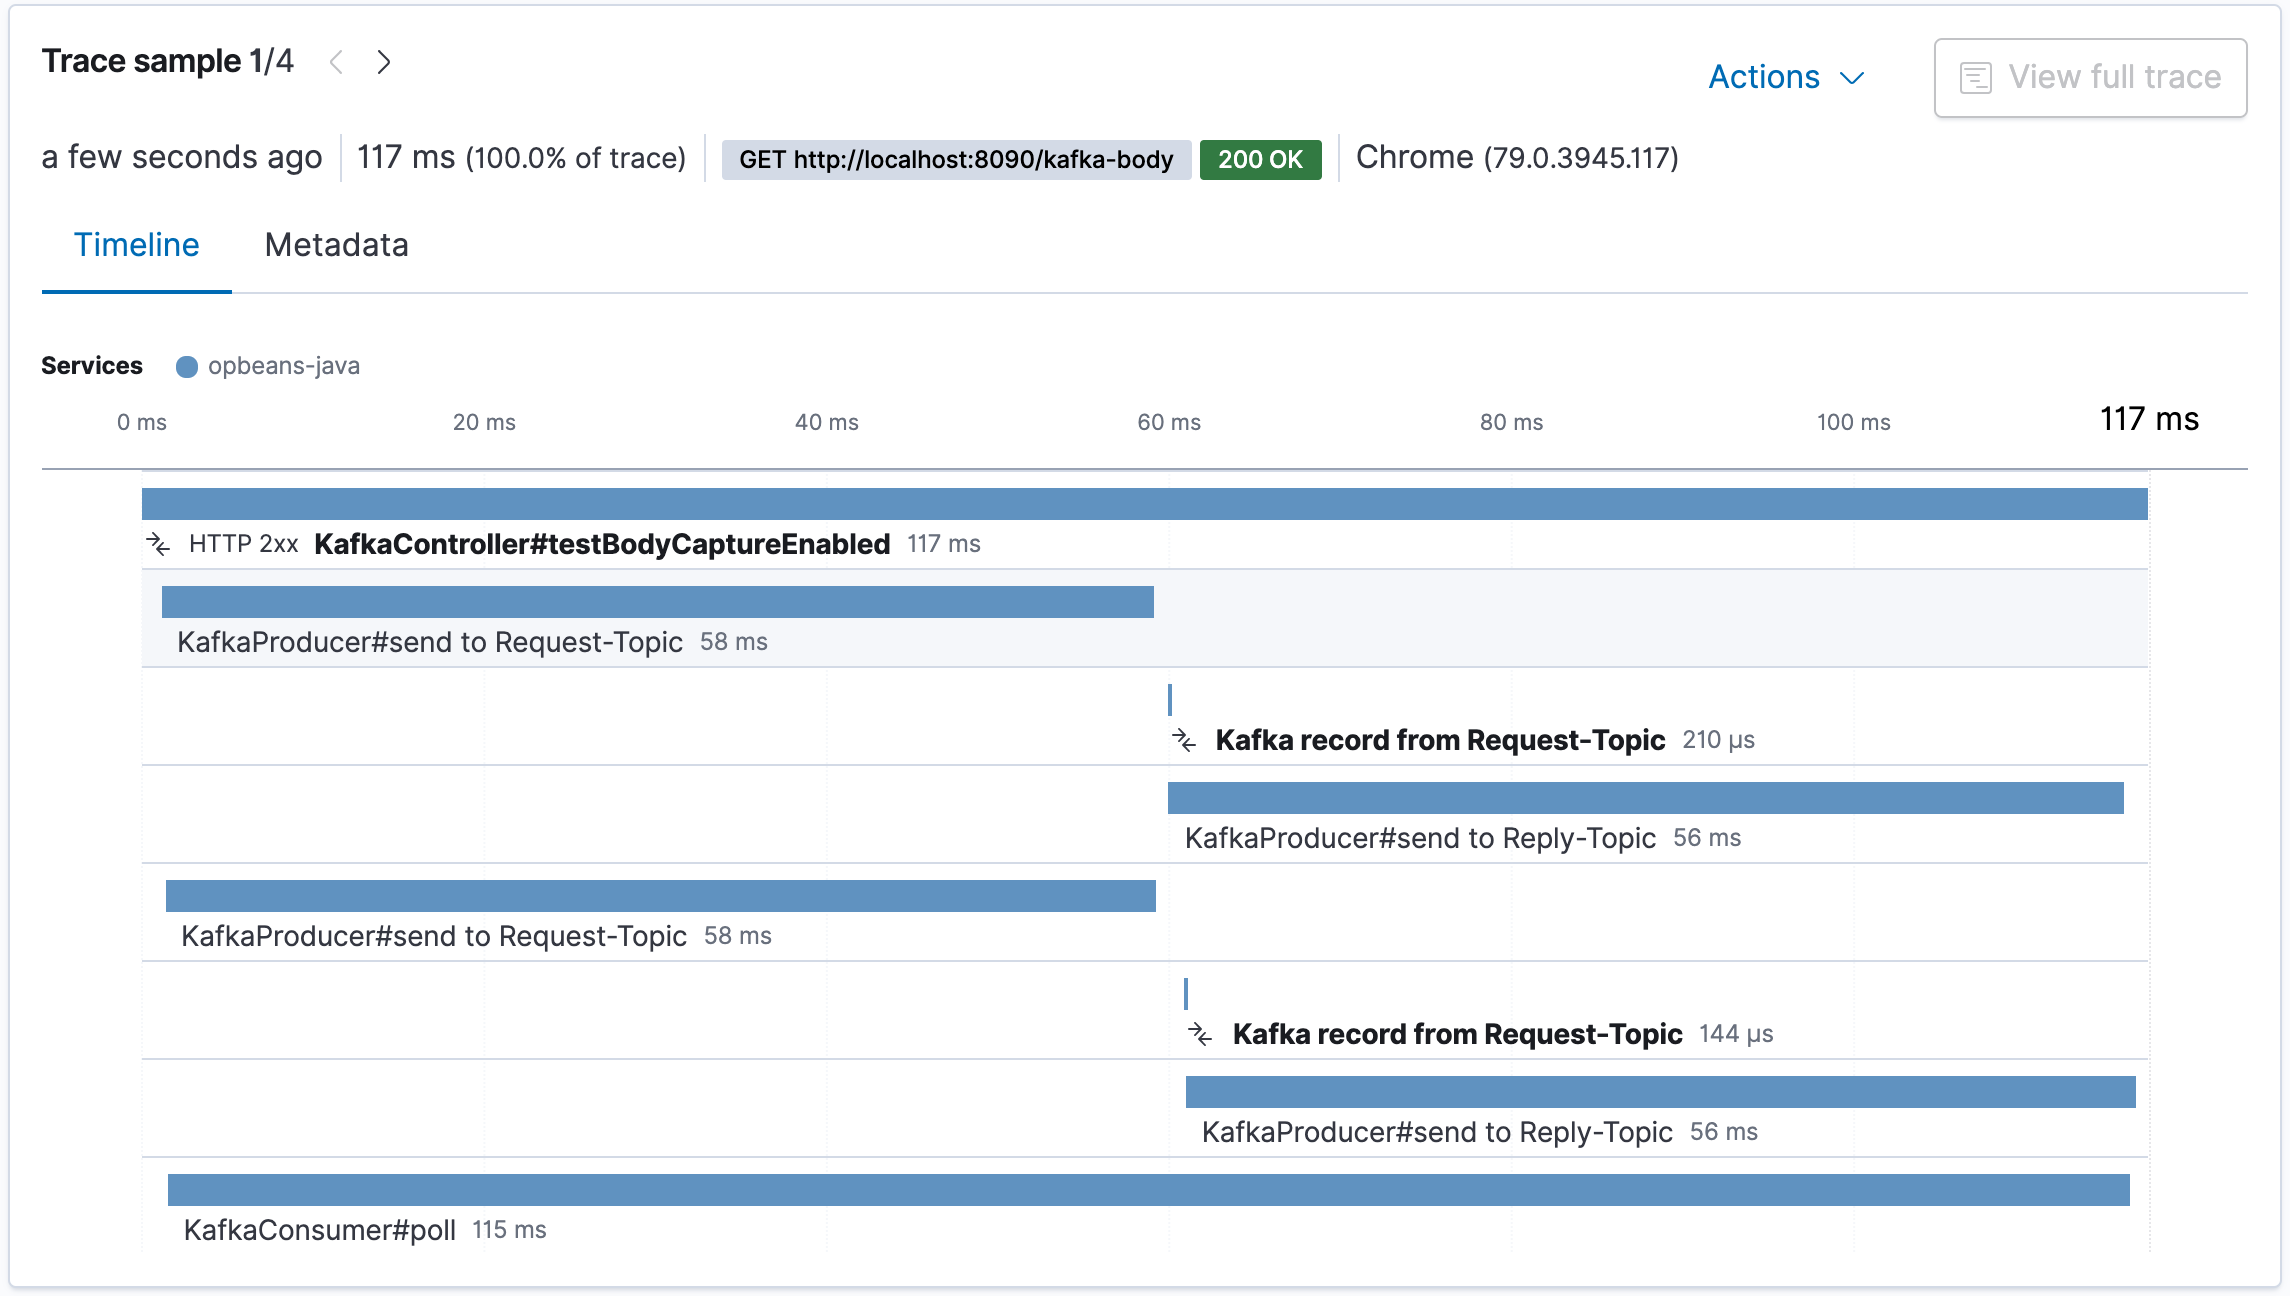
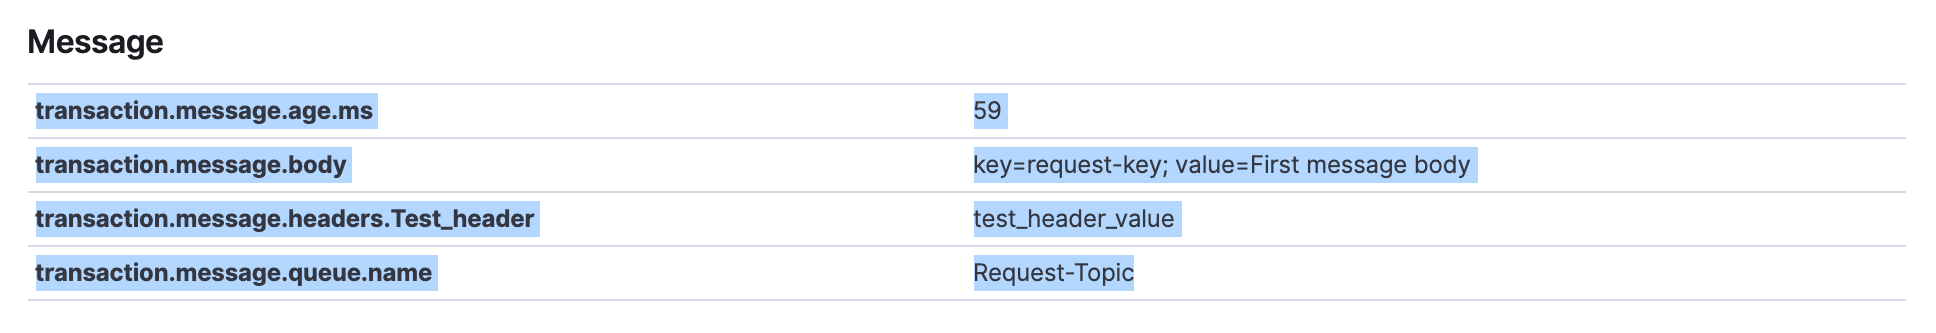
- Java Agent support for Kafka and JMS
-
The Java Agent now supports Kafka and JMS, enabling you to visualize end to end traces that include the messaging service used to communicate between services. In addition, you can now see the time your request spent waiting in the queue.
See the APM Java Agent’s Supported technologies for more information.