Kibana highlights
editKibana highlights
editThis list summarizes the most important enhancements in Kibana 7.11.
Alerting is generally available
editThe first Beta version of the new Kibana Alerting was released in 7.7. In 7.11, Alerting is generally available (GA), which means that it is officially recommended for use in production. Alerting guides you through building your alerts, provides seamless integration with Elastic Security and Elastic Observability, integrates with the external systems where your workflows run, and more. For more information, check out the Kibana alerting GA 7.11 blog.
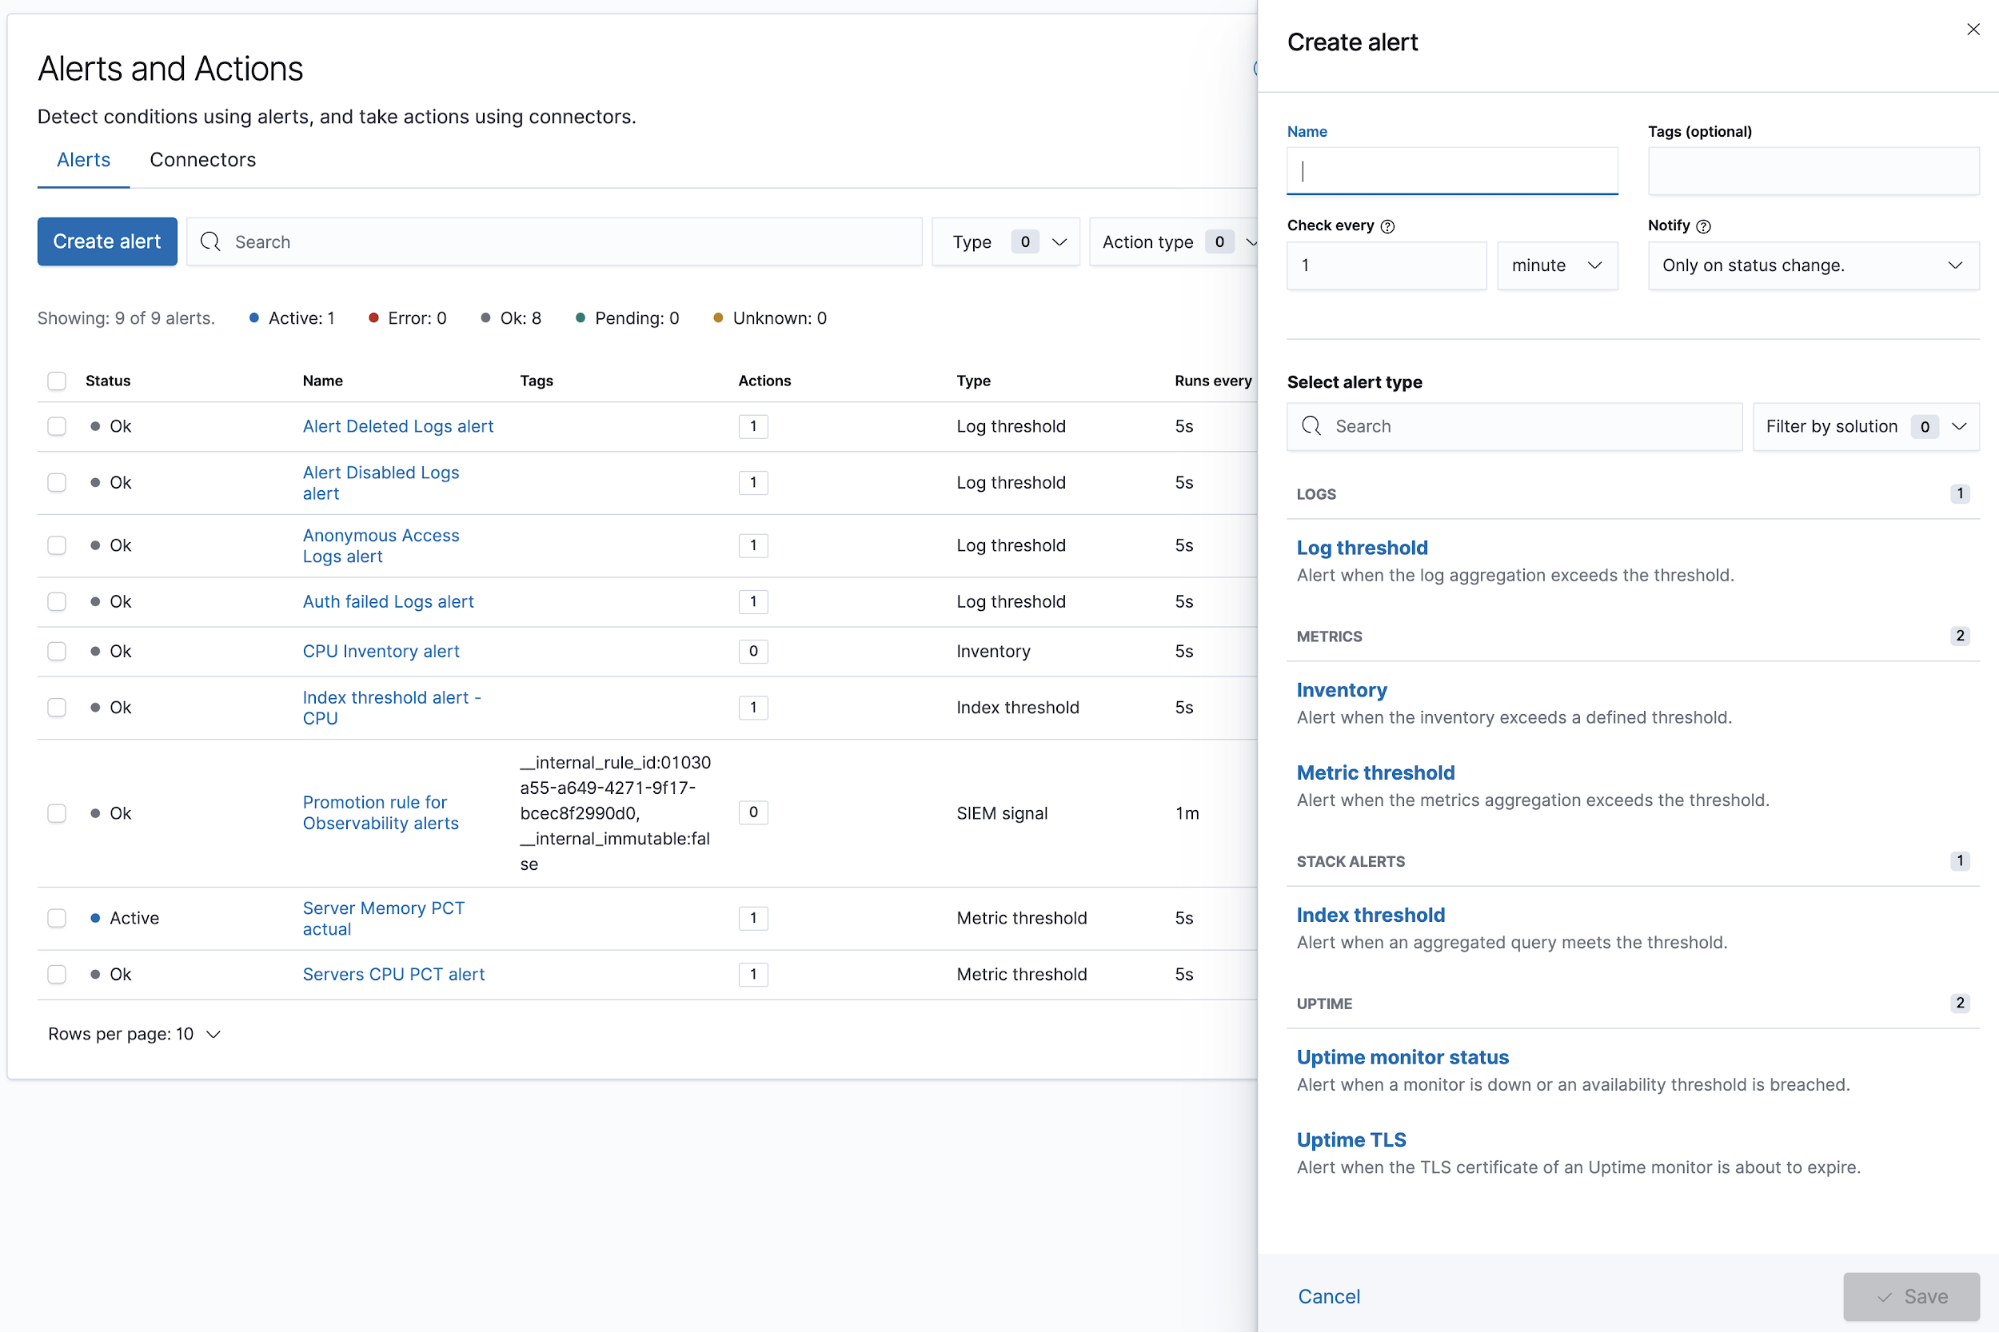
With 7.11, comes the following enhancements:
- Set up an alert to produce a notification or incident only when the alert changes state.
- Optionally set your PagerDuty incidents to auto-resolve once your alert returns to normal.
-
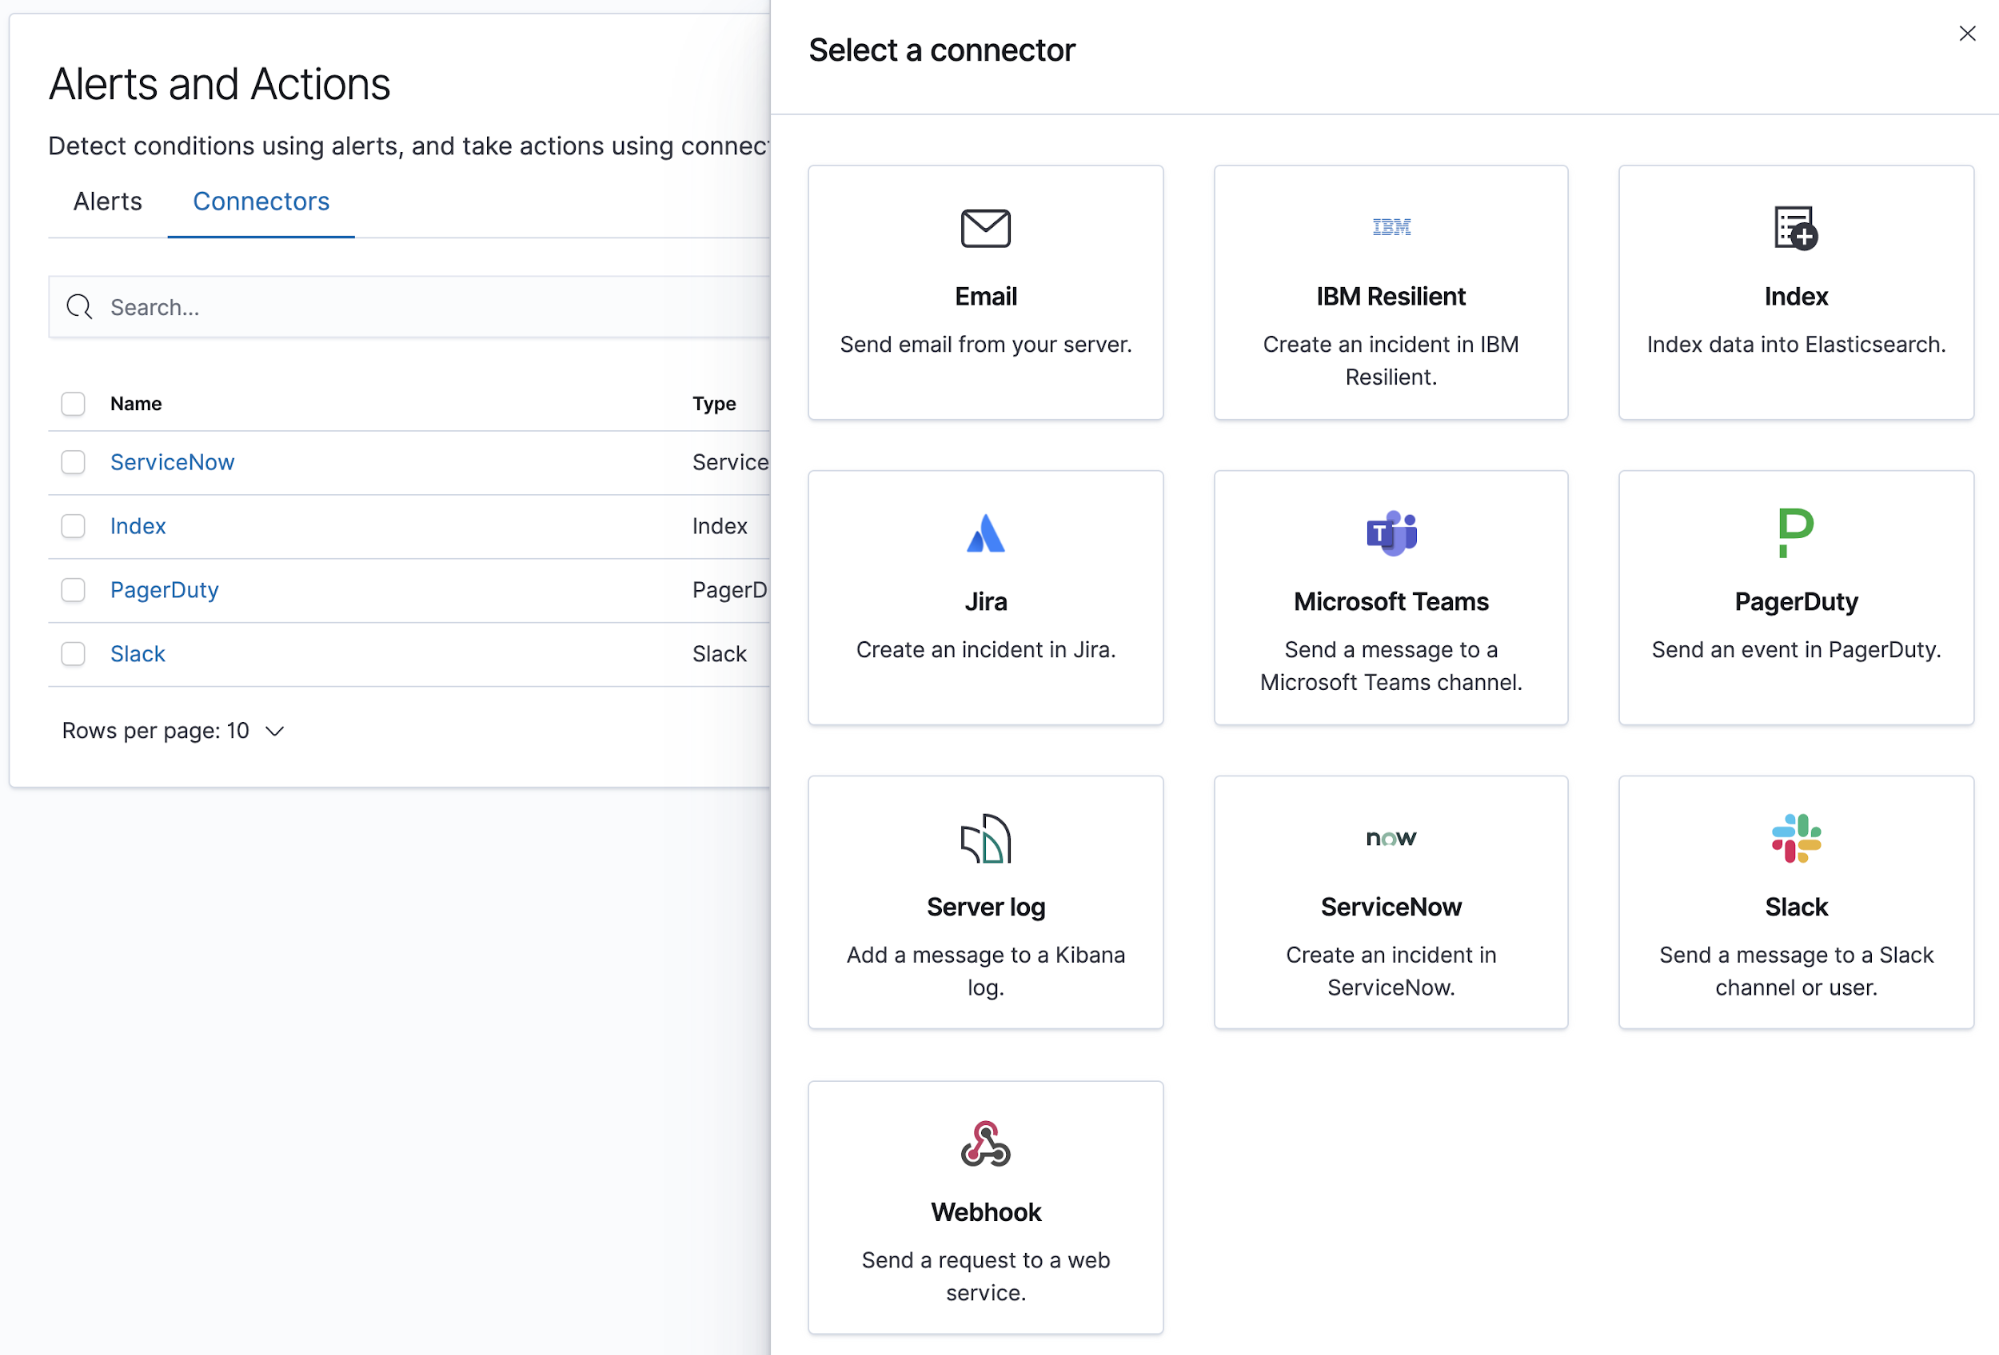
Use Microsoft Teams as part of the ever-growing collection of connectors.
Anonymous access and improved audit logging
editAnonymous access gives users access to Kibana without requiring them to provide credentials. This is useful if you want your users to skip the login step when you embed dashboards in another application or set up a demo Kibana instance in your internal network, while keeping other security features intact. To get started with anonymous access, check out the docs.
Also in 7.11, Kibana’s audit logging was completely revamped. When configured, Kibana will record a wide array of user activity in a dedicated log file. These logs are compliant with the ECS specification, and are easily ingested using Filebeat’s Kibana module. Check out the docs to configure the new audit logger, and gain more insight in your user’s activity.
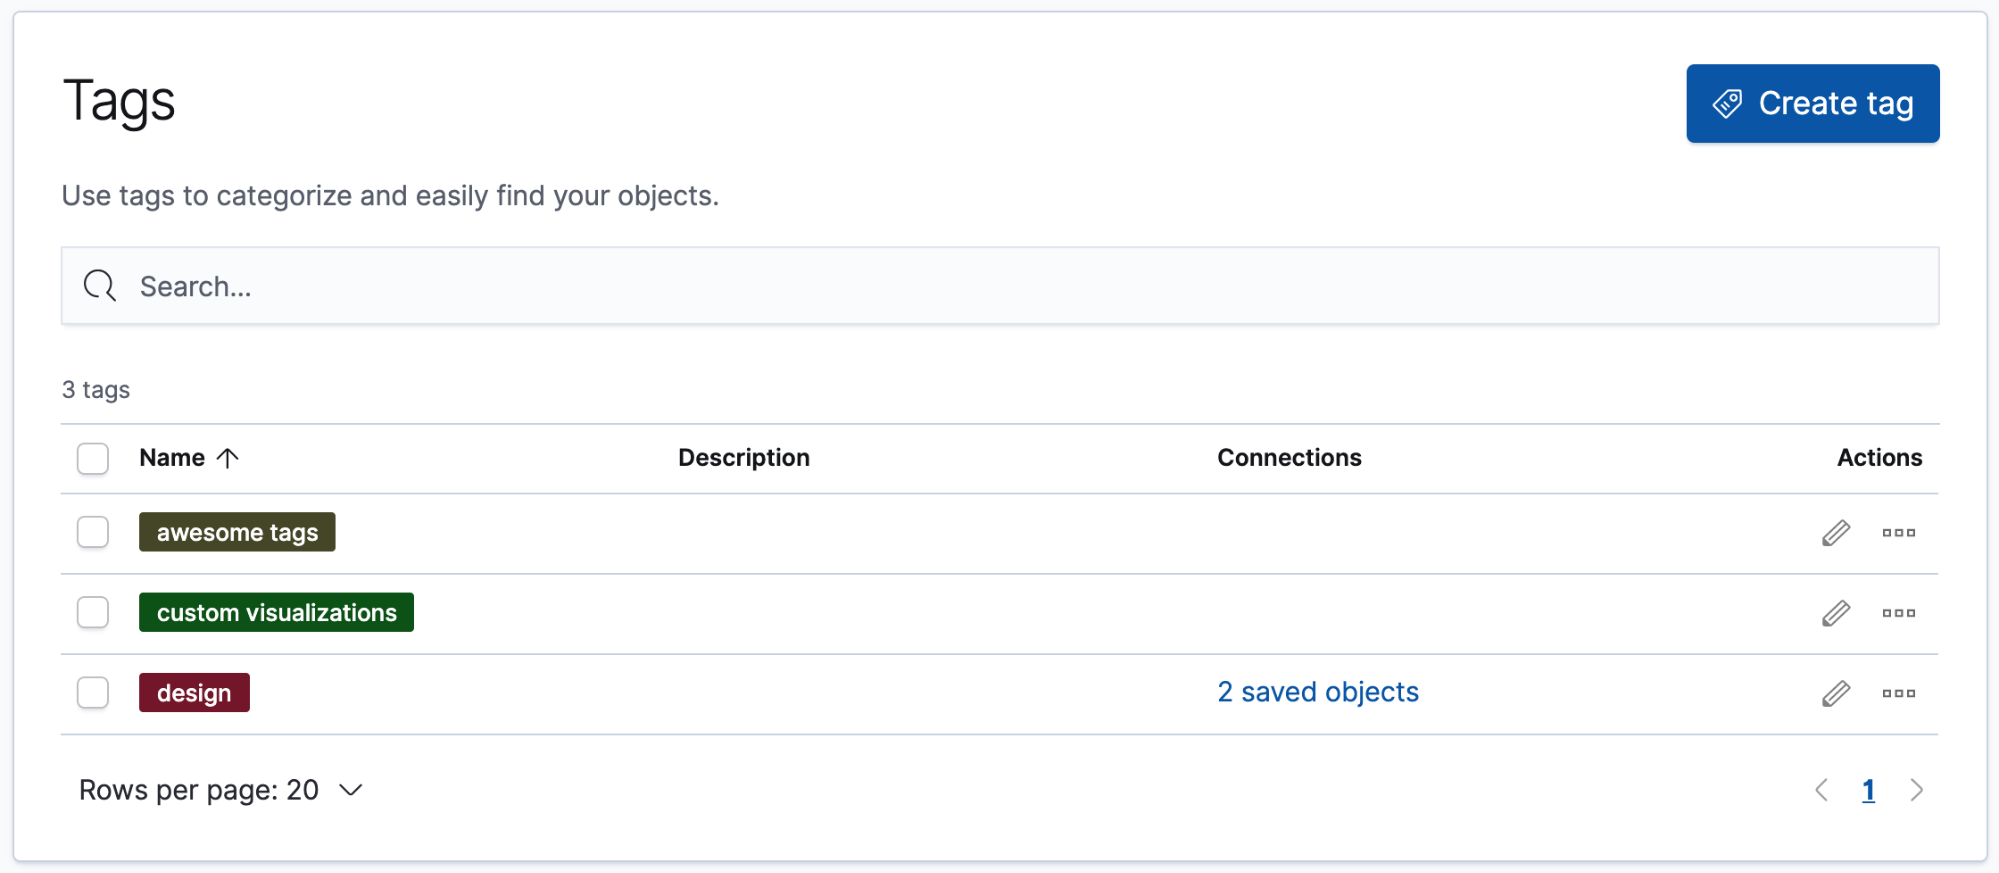
Introducing tags for content management
editTags makes it easier for you to manage your content. Tags are keywords or labels that you assign to Kibana saved objects, such as dashboards and visualizations, so you can classify them in a way that is meaningful to you.
The biggest advantage of tags is that they allow you to quickly group and manage related objects. For example, if you tag objects with “design”, you can search and filter on the tag to see related objects. See Tags for information on saving tags with your content, filtering on them, and searching across Kibana for related assets.
Navigational search deep links into apps
editIn 7.10, Kibana added navigational search, so you can rapidly move to a dashboard, visualization, or application in just a few keystrokes. This release enhances search suggestions to include deep links into applications, allowing you to directly navigate to the views you need most.
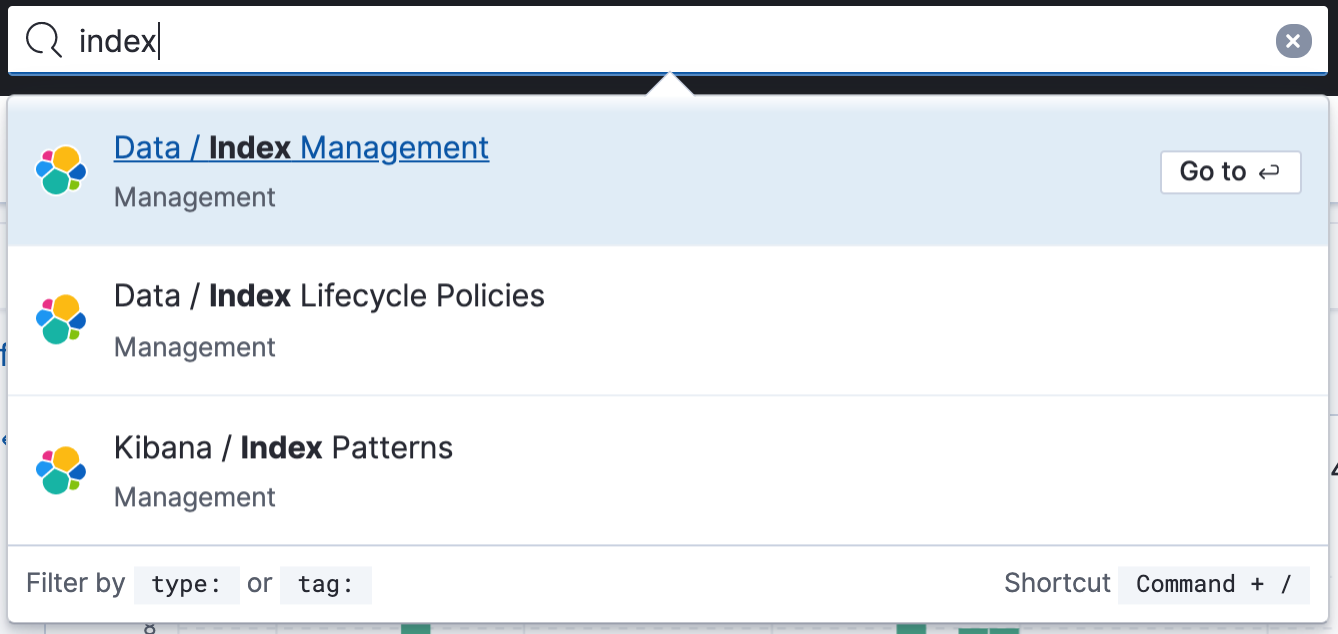
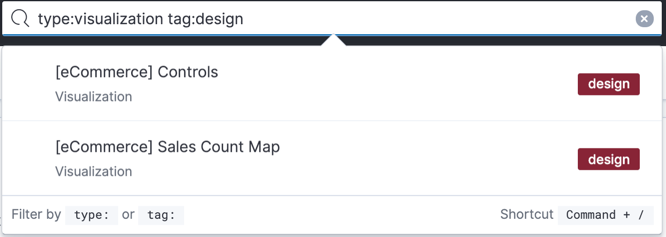
The enhanced search syntax in 7.11 lets you filter results by type and by tag.
For example you can find objects by type using the syntax type:dashboard dashboard_name
and by tag using tag:tag-name. See
navigational search for more examples.
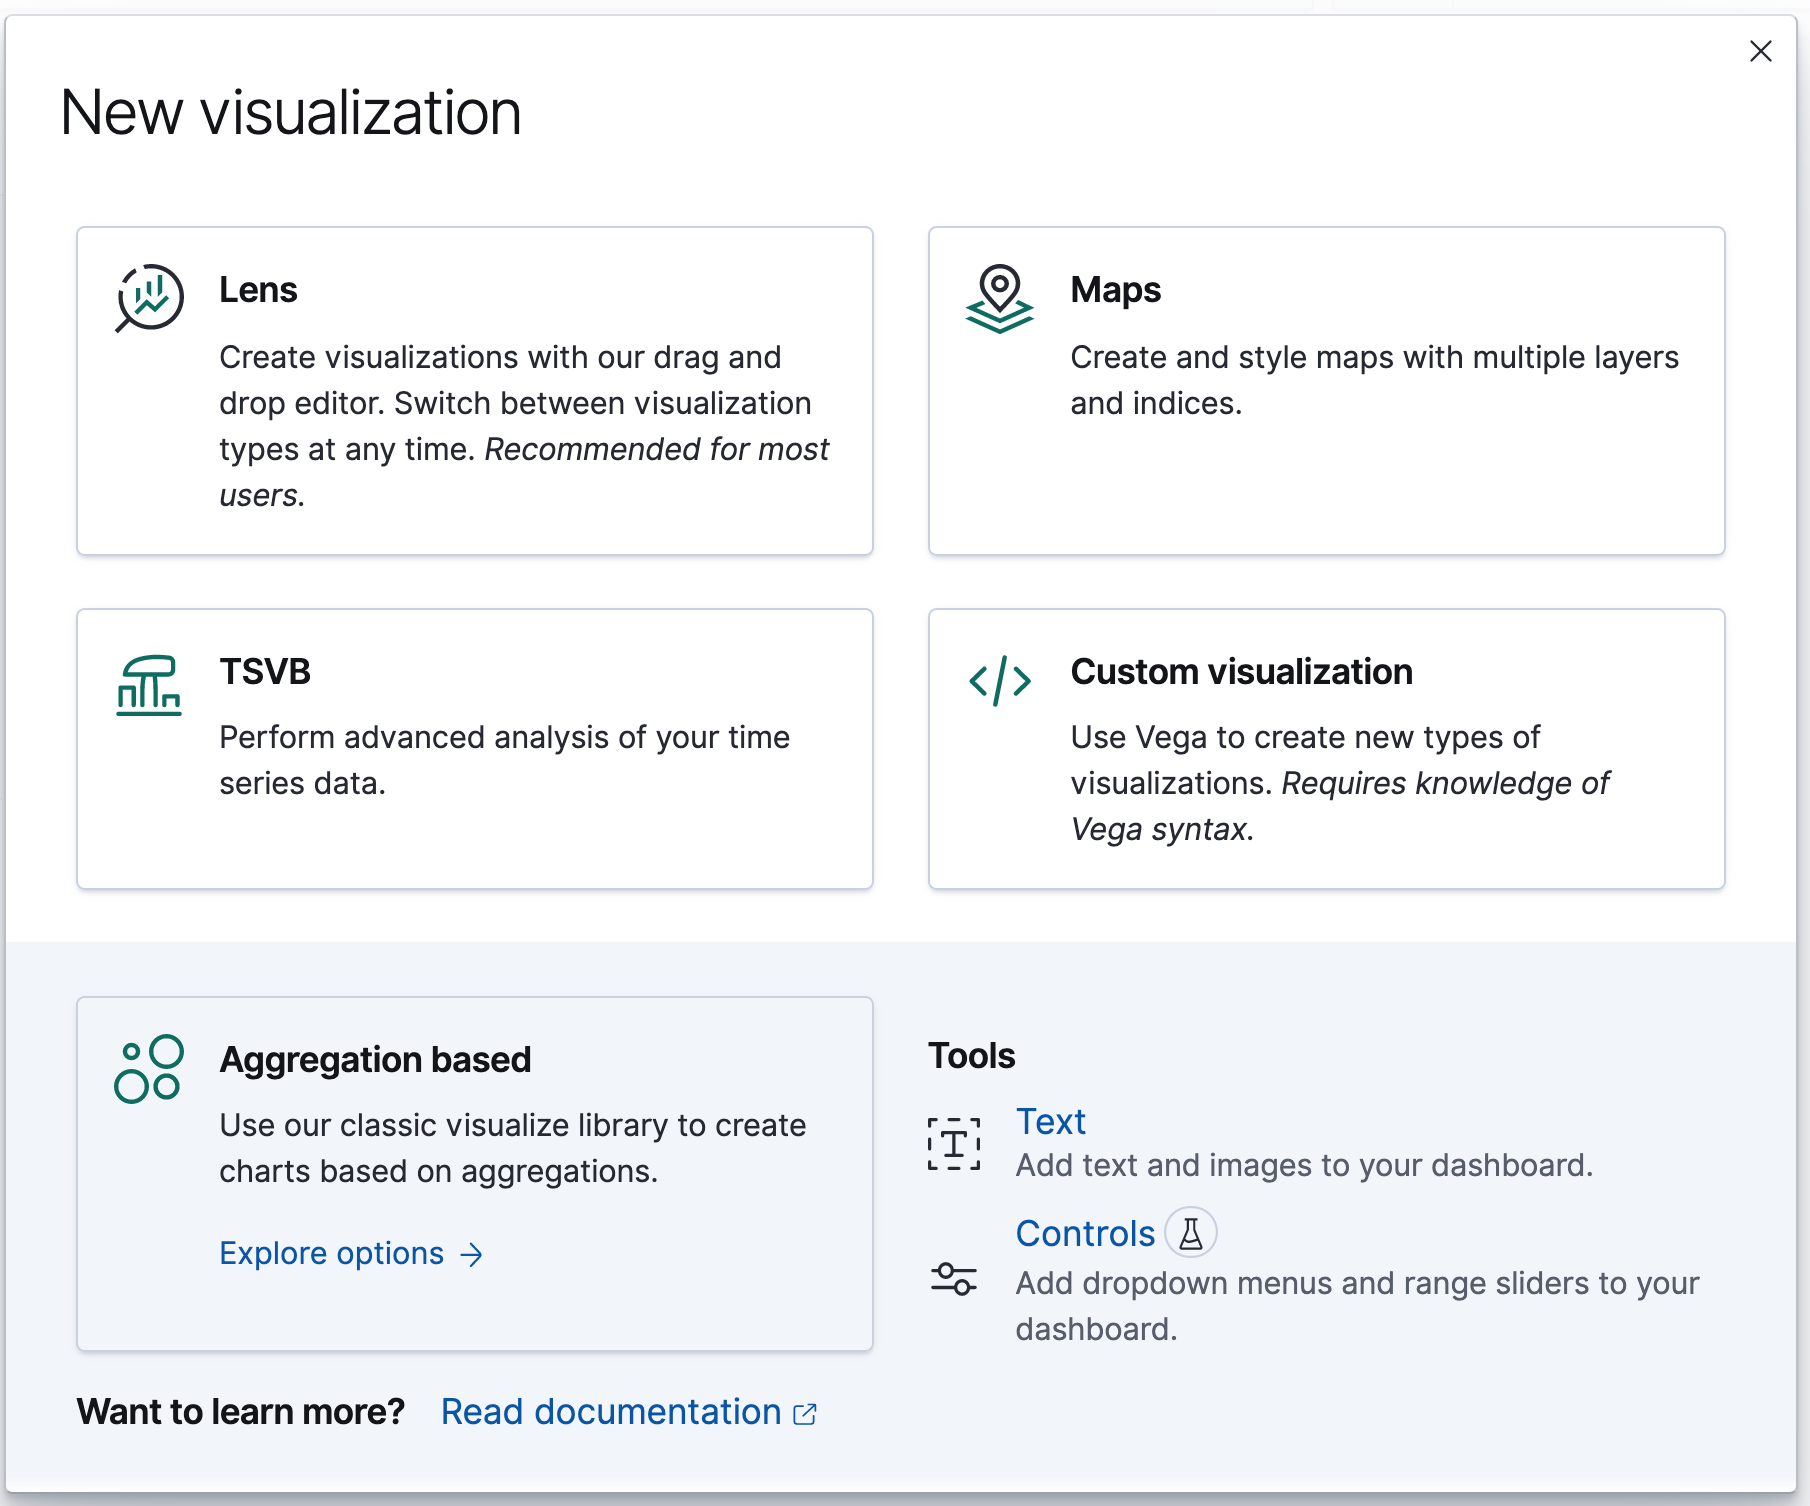
Simplified visualization workflow
editKibana simplifies the visualization workflow by providing guidance for which visualization editor to use for your type of data. To view the new visualization selector, open Dashboard, click Create visualization, and then click Create panel. Lens, Kibana’s' drag and drop editor, is recommended for most users.
Maps—Elastic Maps Server, tracks layer, & more
editElastic Maps Server
editThe Elastic Maps Service powers Maps for most instances of Kibana. In 7.11, for customers in a secure, air-gapped environment, you can now use the same maps and boundaries that come with Kibana by default. The Elastic Maps Server can be downloaded and deployed to your self-managed environment.
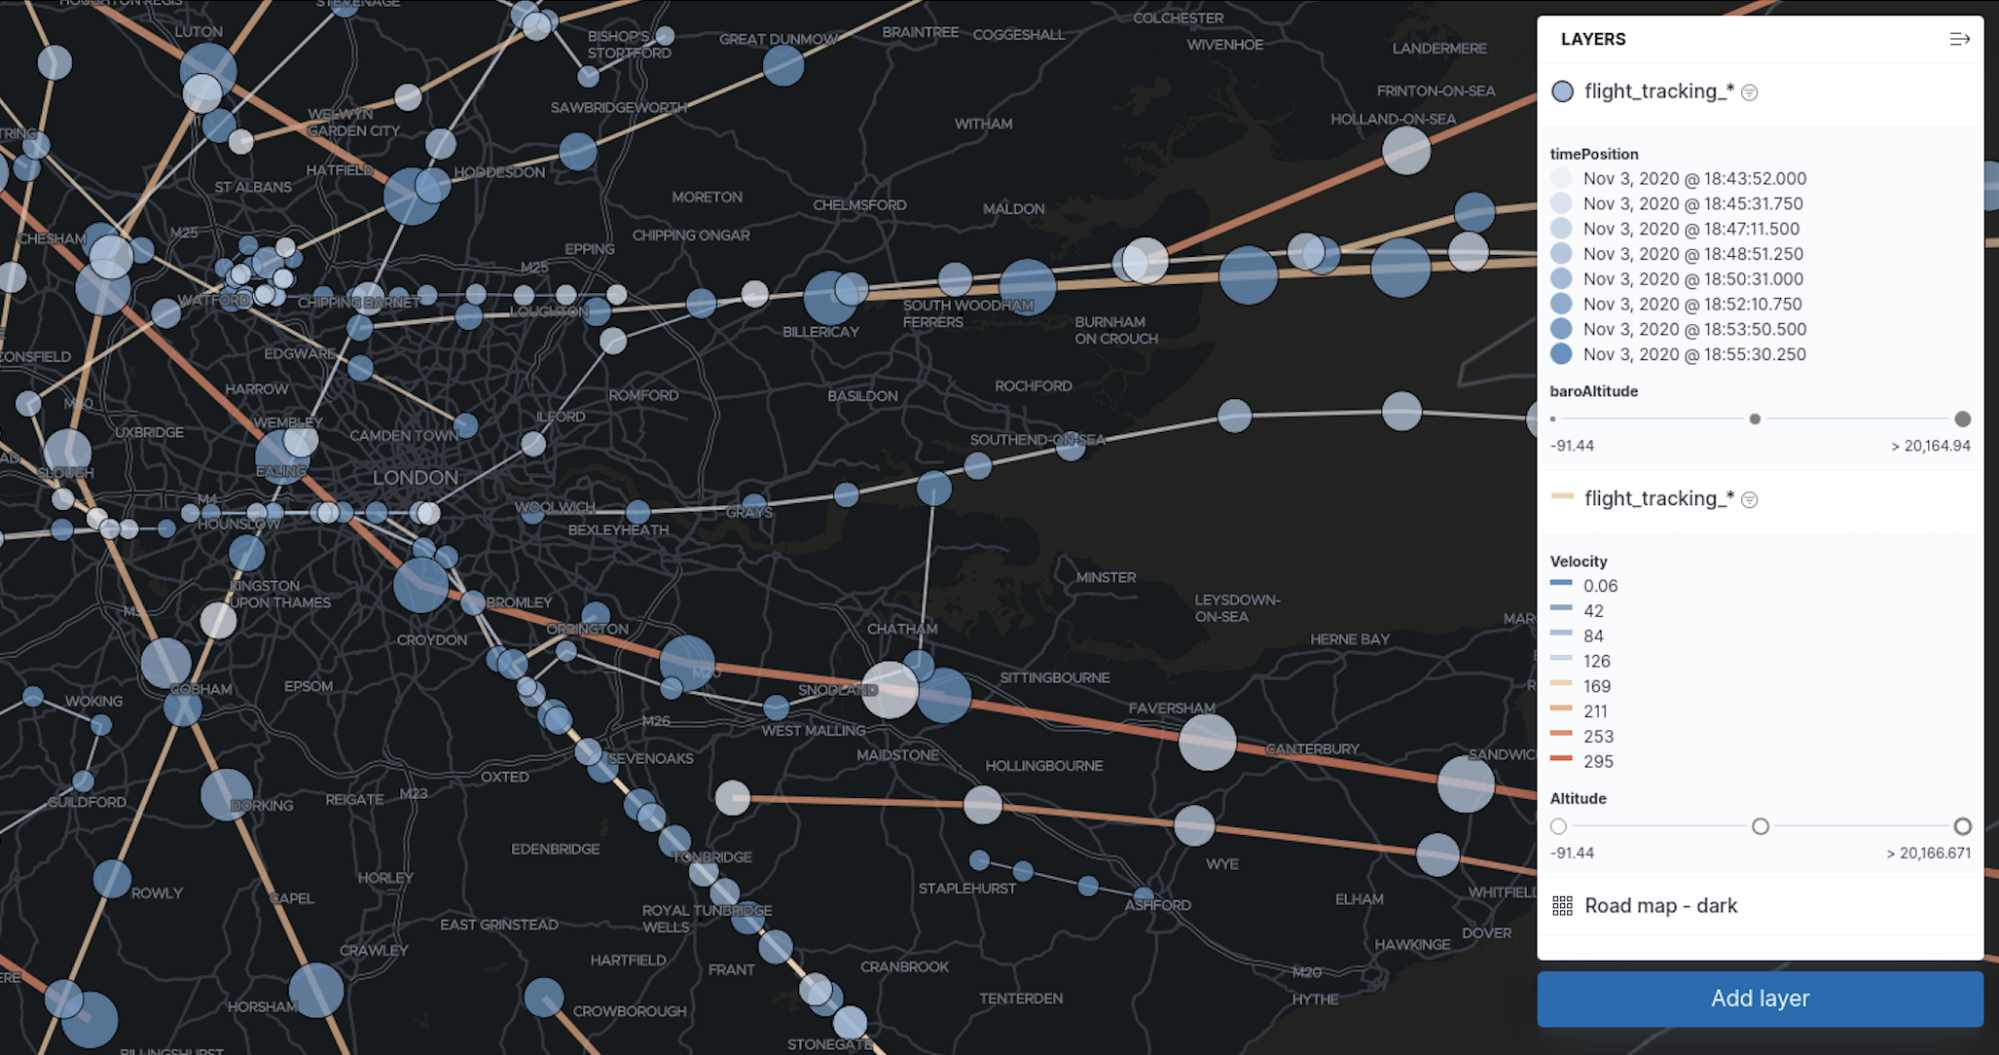
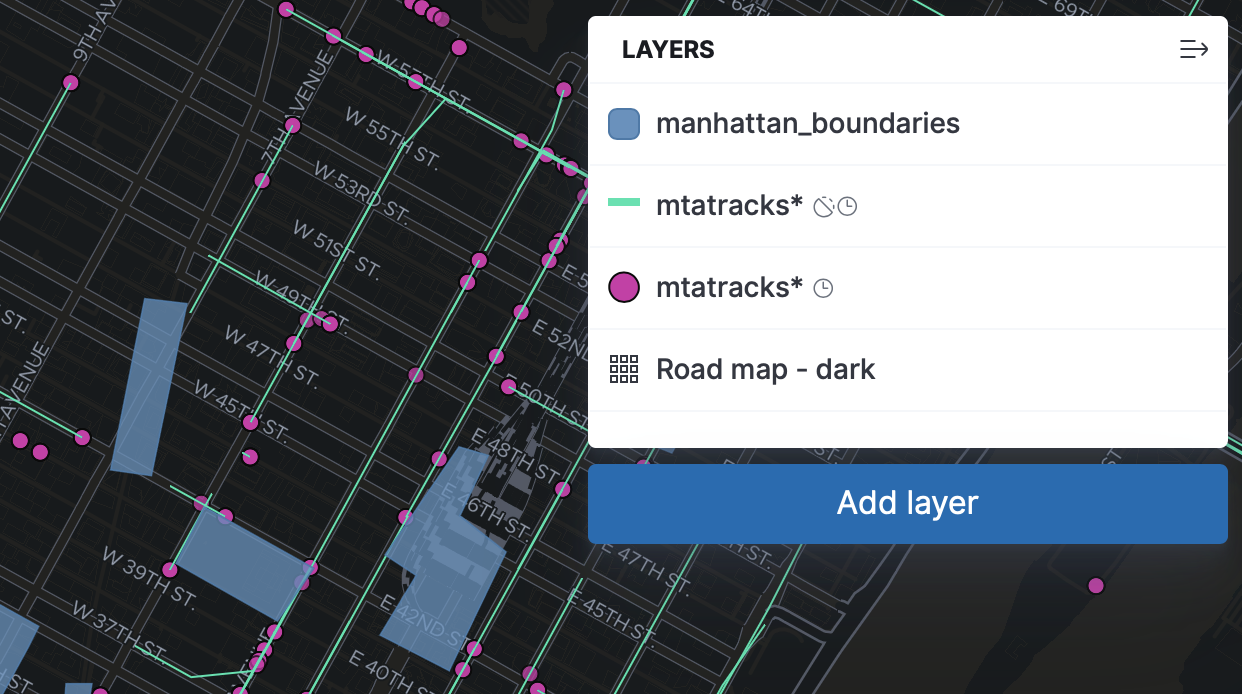
Tracks layer
editThe new tracks layer is a simple way to connect the dots, taking an index of point locations by time and displaying them as a line. This is good for customers working with GPS, sensor, or location-tracked time-series data, who want to visualize the routes and paths of their data.
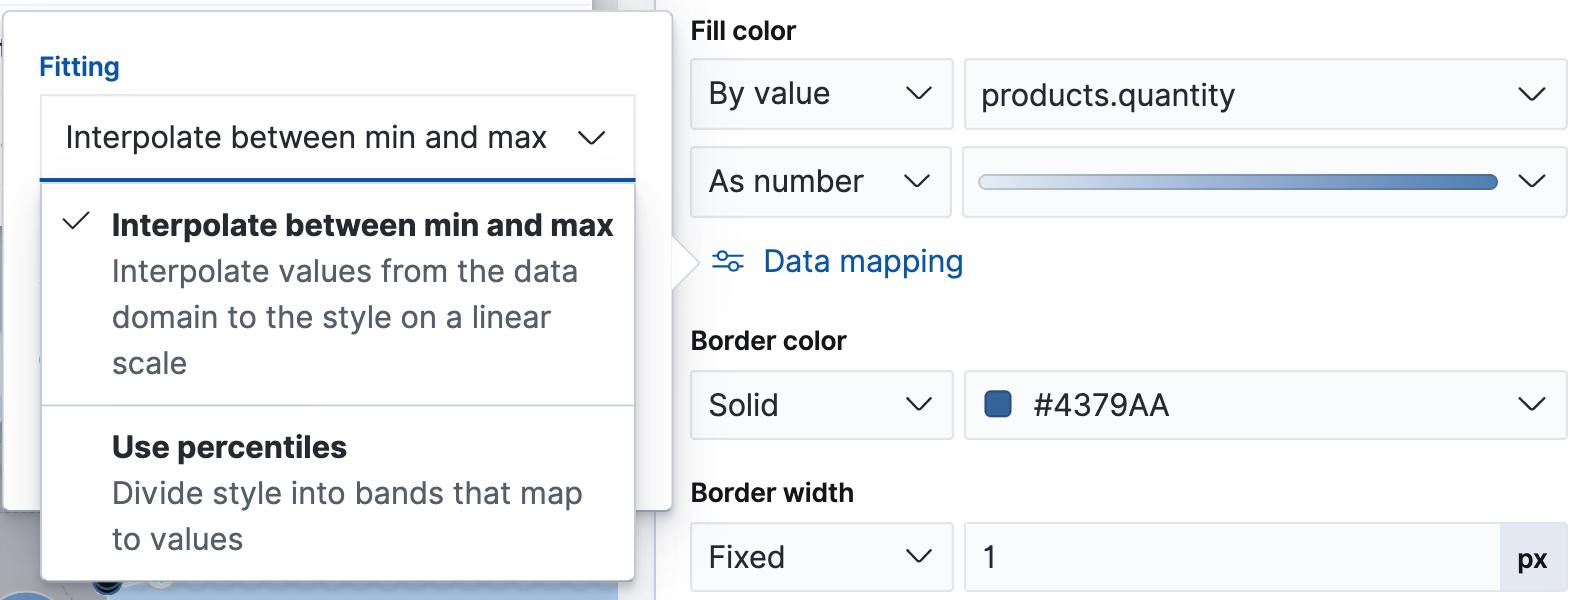
Style by percentile
editMaps has a new option for styling layers. Now you can apply color by percentile data ranges, making it easier to separate above and below the mean. You can add any number of percentile ranges.
Geo alerts (Beta)
editIn 7.10, Kibana introduced a new location-driven alert called the tracking alert. Enhanced in 7.11, the tracking alert now allows you to trigger alerts when entities enter, leave, or cross a boundary. Further, there’s a new geographic alert based on containment. You can now monitor the location of an entity as long as it is within a specified boundary with the containment alert.
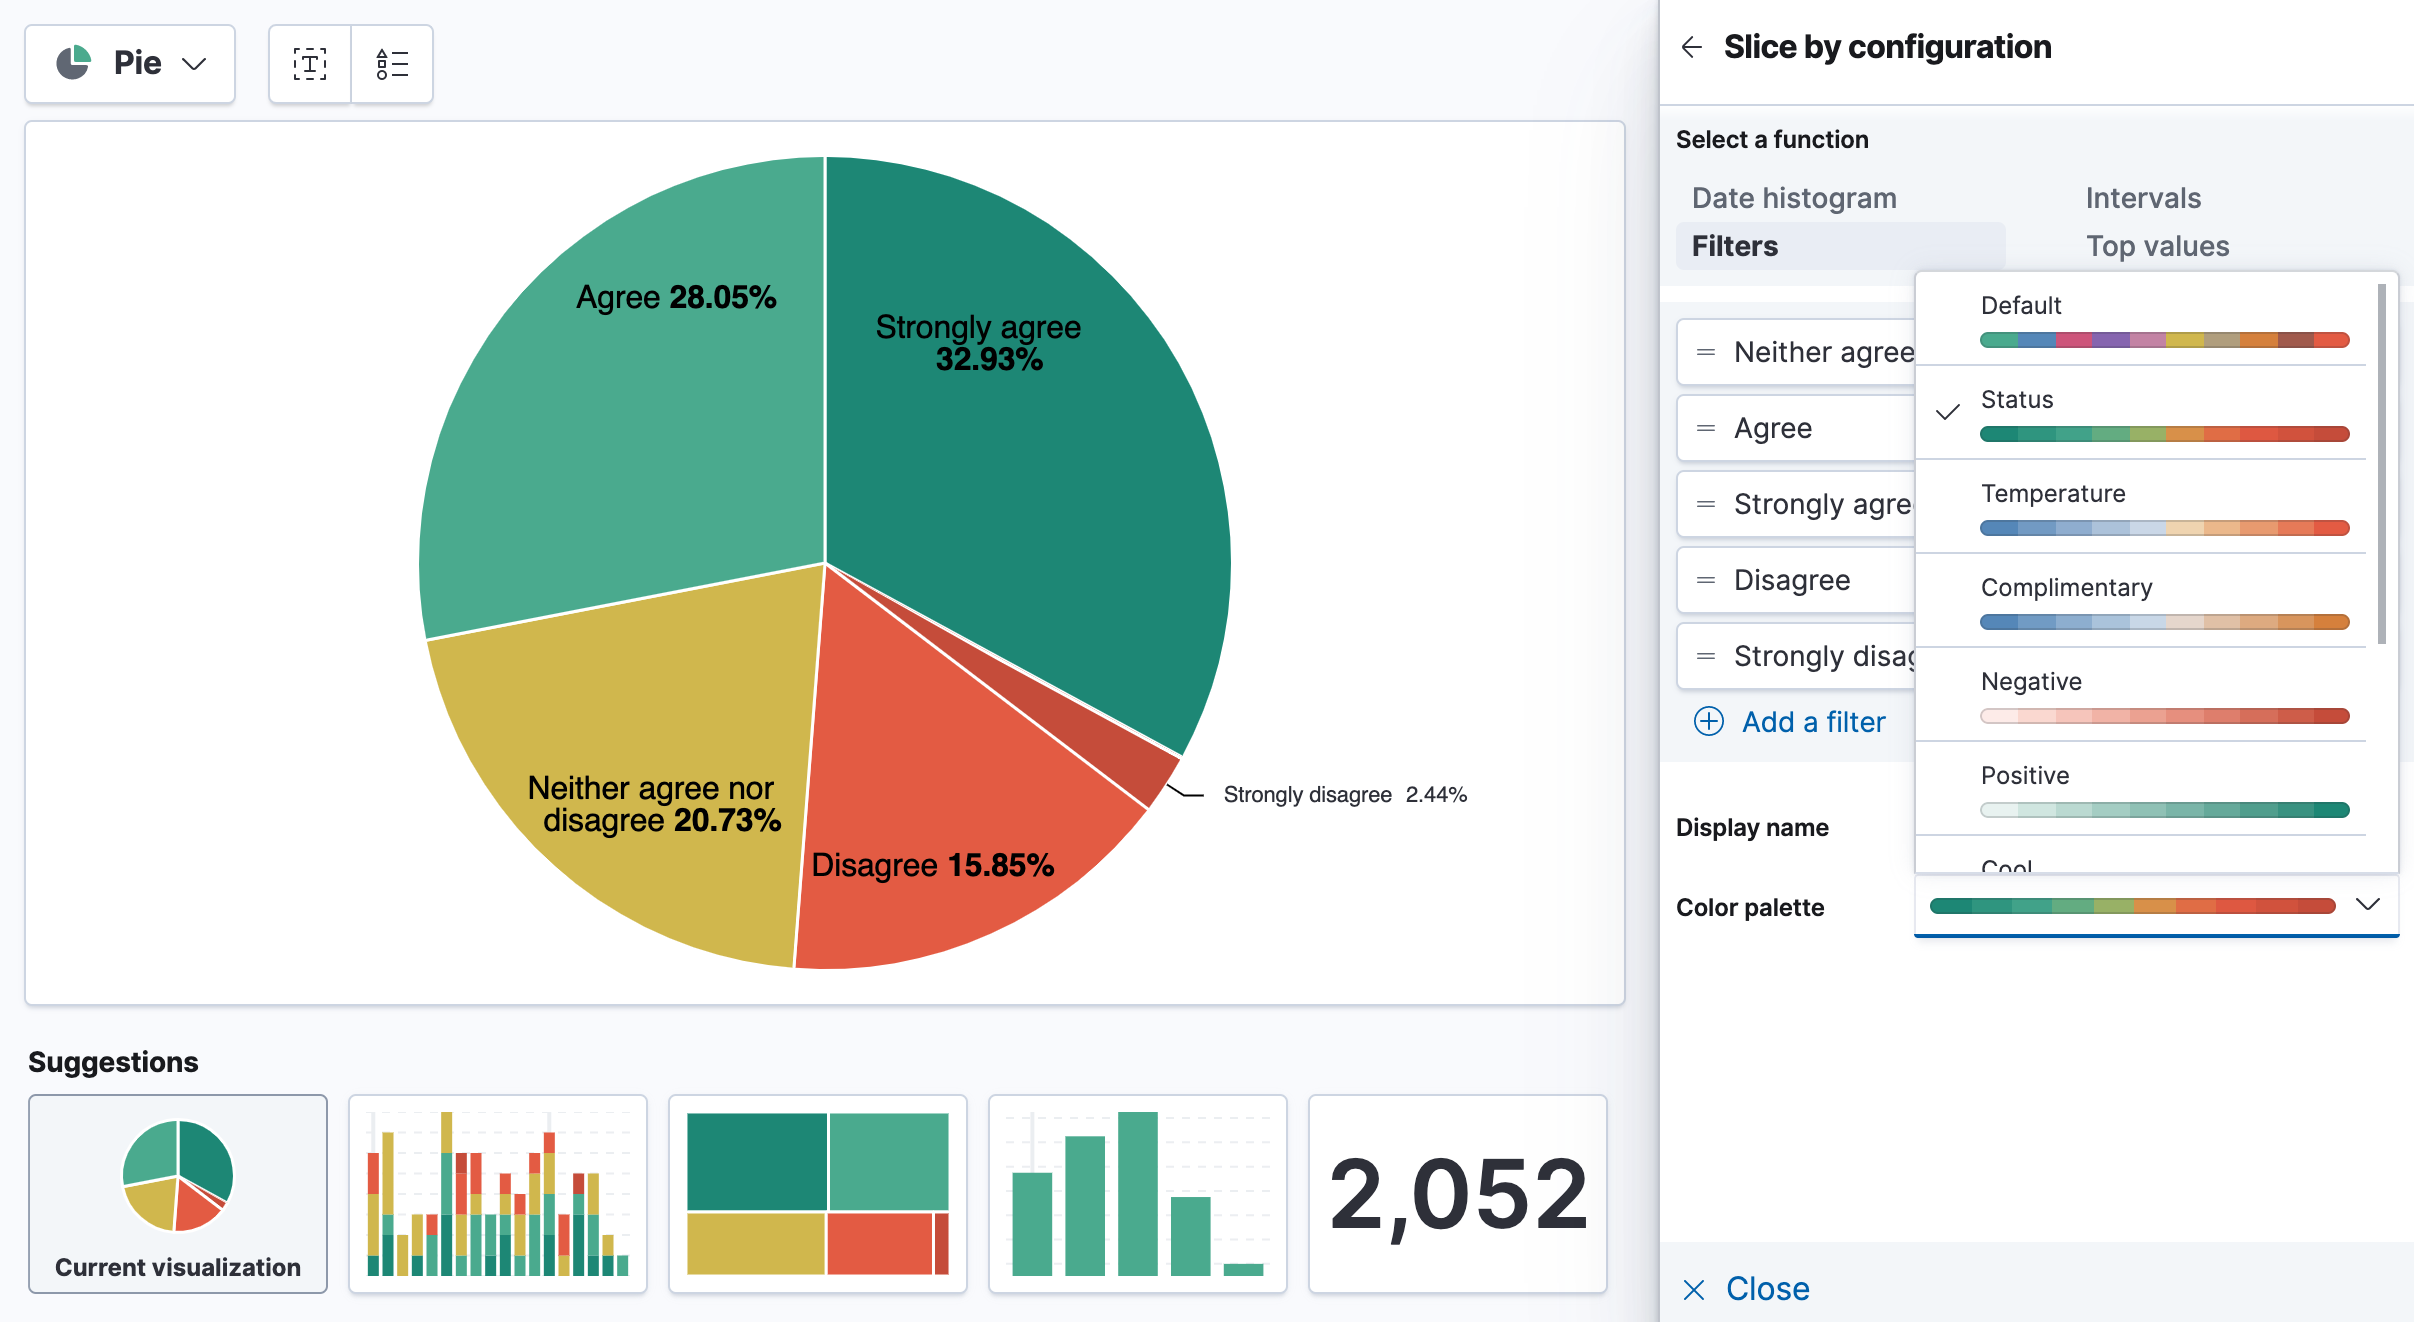
Lens has new palettes
editChoose from one of the new Lens palettes to make your visualizations really stand out. Use a diverging palette to show status, a gradient palette for a muted look, or a backwards compatible palette to blend with existing dashboards.
Lens now supports drag to reorder in all chart types. Reprioritize how the data displays in your visualizations by reordering the fields in the editor.
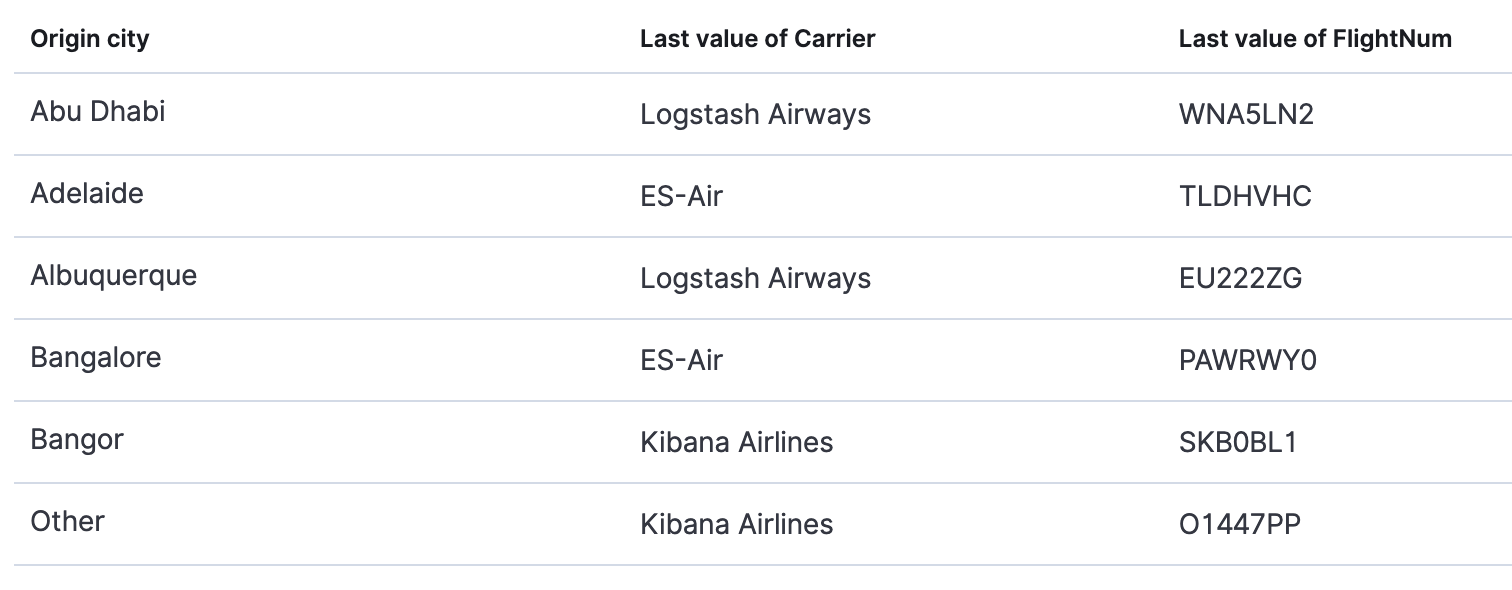
Lens also has improved tables—click the column header to sort in place, or use the newly introduced last value metric to create detail tables. For example, visualize the most recent flight that has departed a given city.
More new Lens features:
- Download Lens panels as CSV from a dashboard.
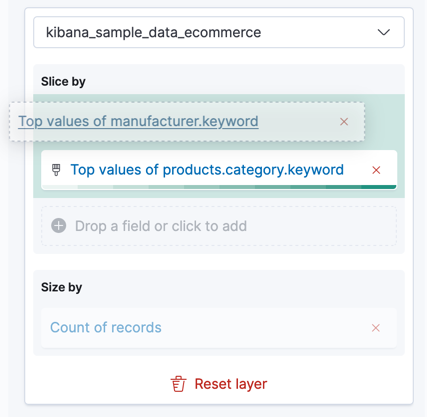
- When you configure the Top values function, group “Other” values by default.
- From the editor, apply the Median function to fields.
Drilldowns offers new trigger types
editWhen the drilldown feature was first introduced, it offered the ability to click on a chart element, known as a “trigger.” This release adds two new trigger types for use with URL drilldowns.
Context menu trigger
editA context menu trigger allows you to attach a drilldown to the panel context menu. This trigger is useful for navigating to contextual information related to a panel.
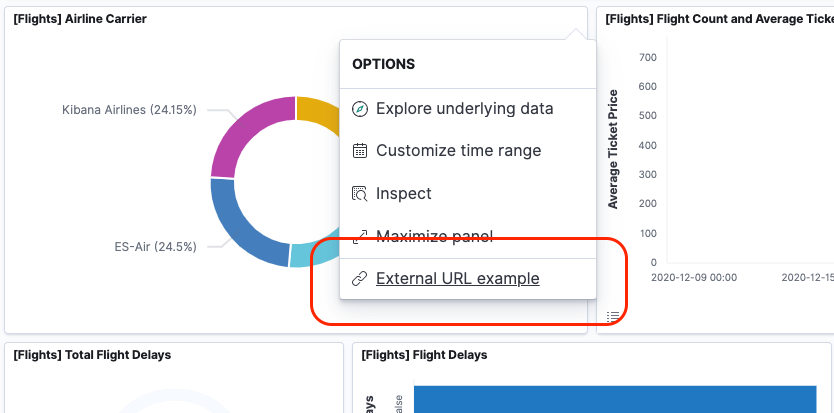
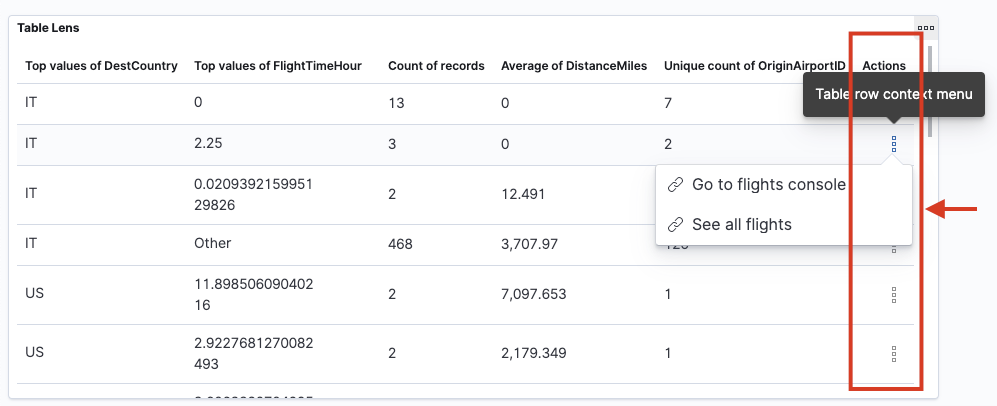
Table row trigger
editPreviously, Kibana supported attaching a drilldown to a table. The table row trigger expands on this functionality by allowing you to configure the URL with one or more specific columns from a Lens table.
When your URL requires multiple parameters, you can present them in a table, and use the URL template to format and concatenate the values.
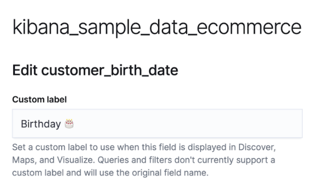
Fields now support custom labels
editCustom labels are especially useful for displaying long field names in much shorter versions. These labels appear in Discover, Maps, and Visualize (not yet in TSVB, but coming soon). To add a custom label to a field, go to Stack Management > Index Pattern. Details are in the documentation.
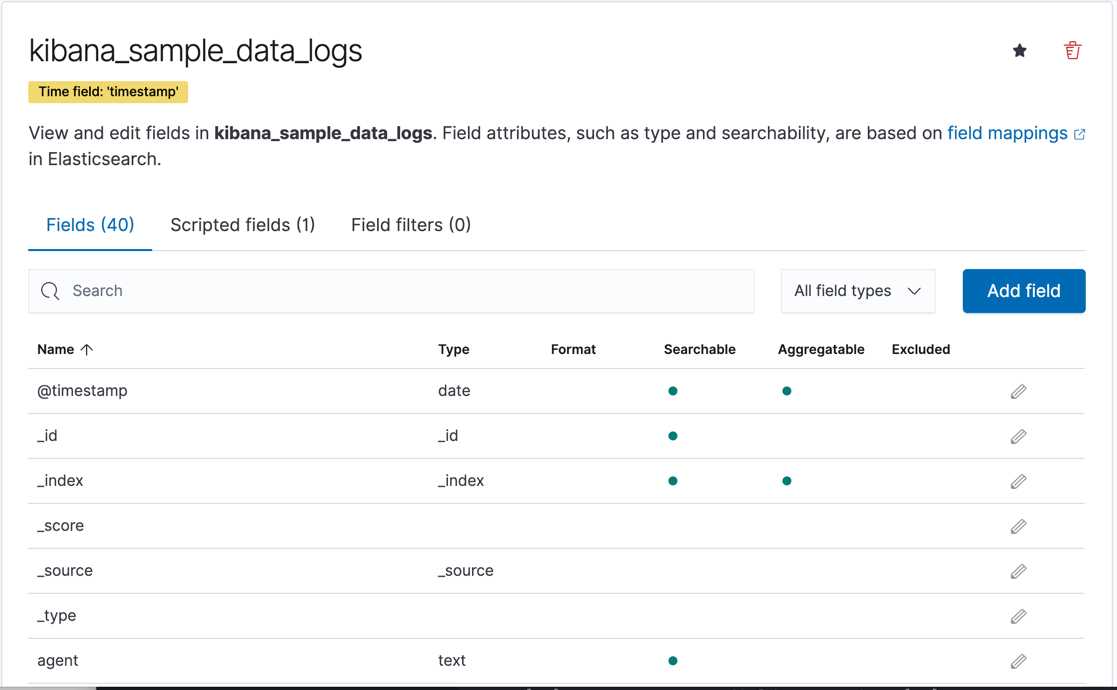
Index patterns automatically refresh
editUpdates to index patterns are now automatic, so you’ll no see longer the refresh icon in Stack Management > Index Patterns. When a new field is added to the index, the index pattern field list is updated the next time the index pattern is loaded, for example, when you load the page or move between Kibana apps.
Machine learning jobs are now space-aware
editAnomaly detection and data frame analytics jobs are space-aware starting in 7.11. Spaces enable you to organize your machine learning jobs and other Kibana saved objects into meaningful categories. Once a machine learning job is limited to a Kibana space, users only see the job if they are assigned to the same space. Extra checks for spaces have been added when deleting jobs, and a warning is shown if any jobs are missing their saved objects.
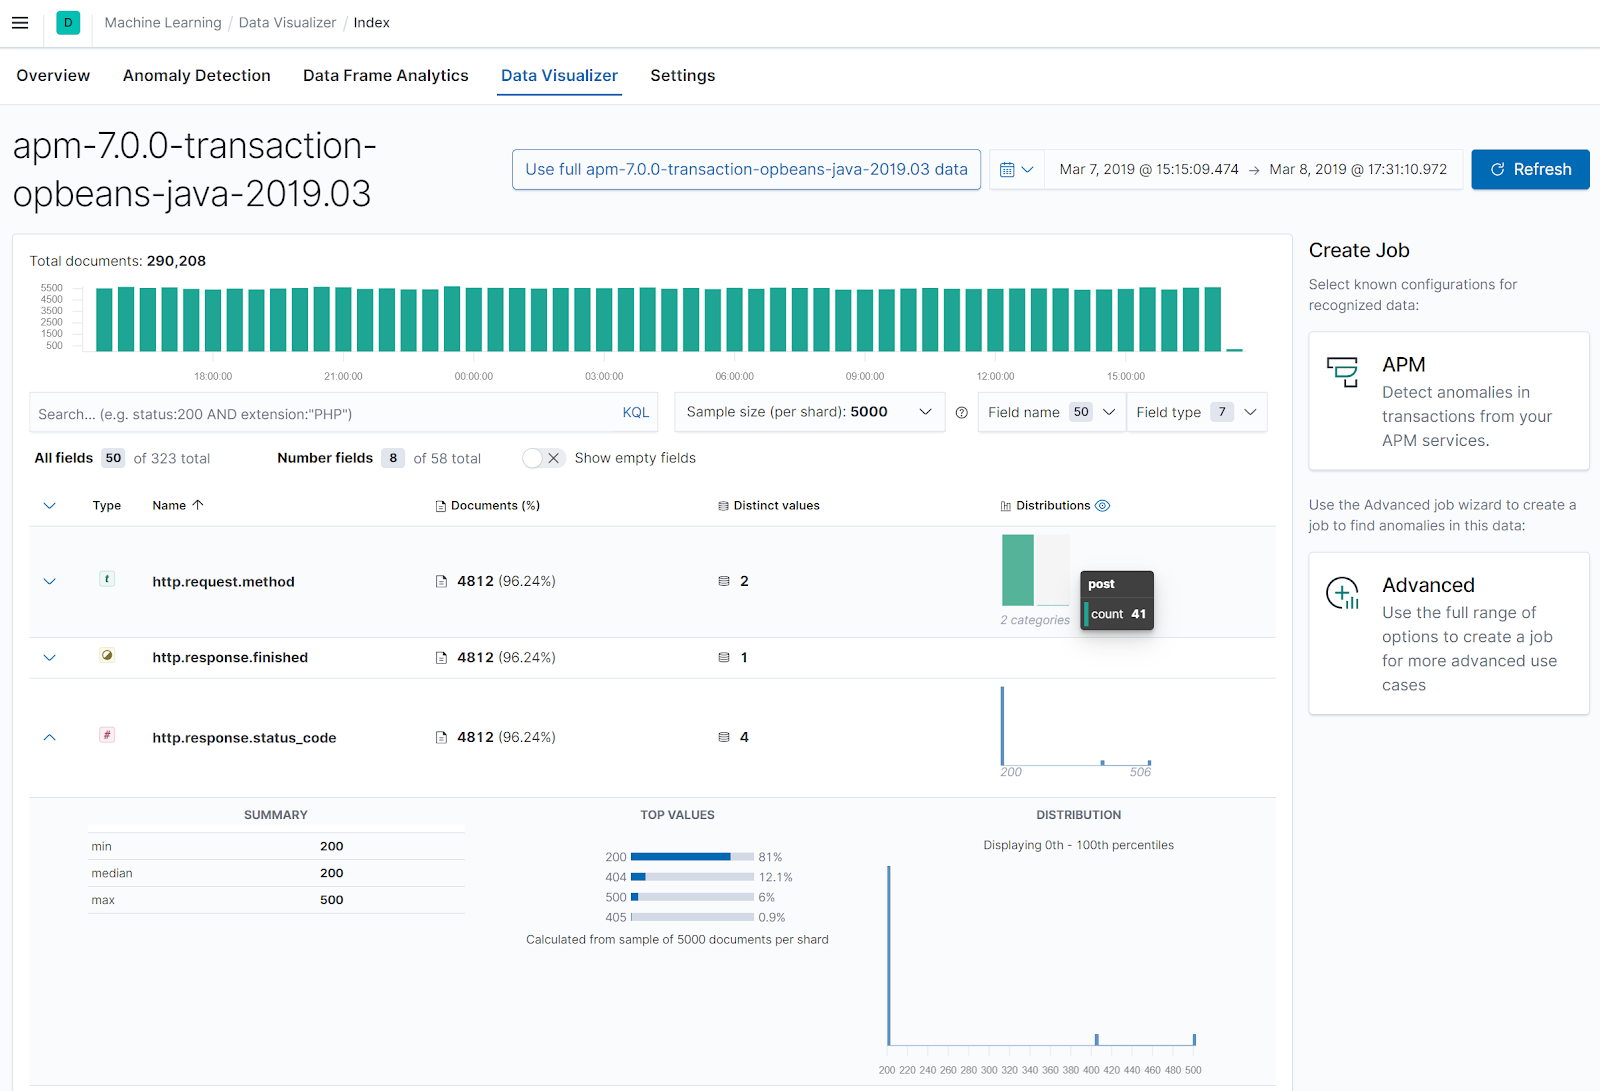
Index Data Visualizer has new design
editThe Machine learning Data Visualizer provides a view into your indices to give a better understanding of the fields in the data set prior to creating anomaly detection or data frame analytics jobs. The Data Visualizer went through a major redesign and the previous card based display is switched to a table. It has the benefit of a more compact layout, a new document count chart, and expanded rows for viewing details on individual fields.
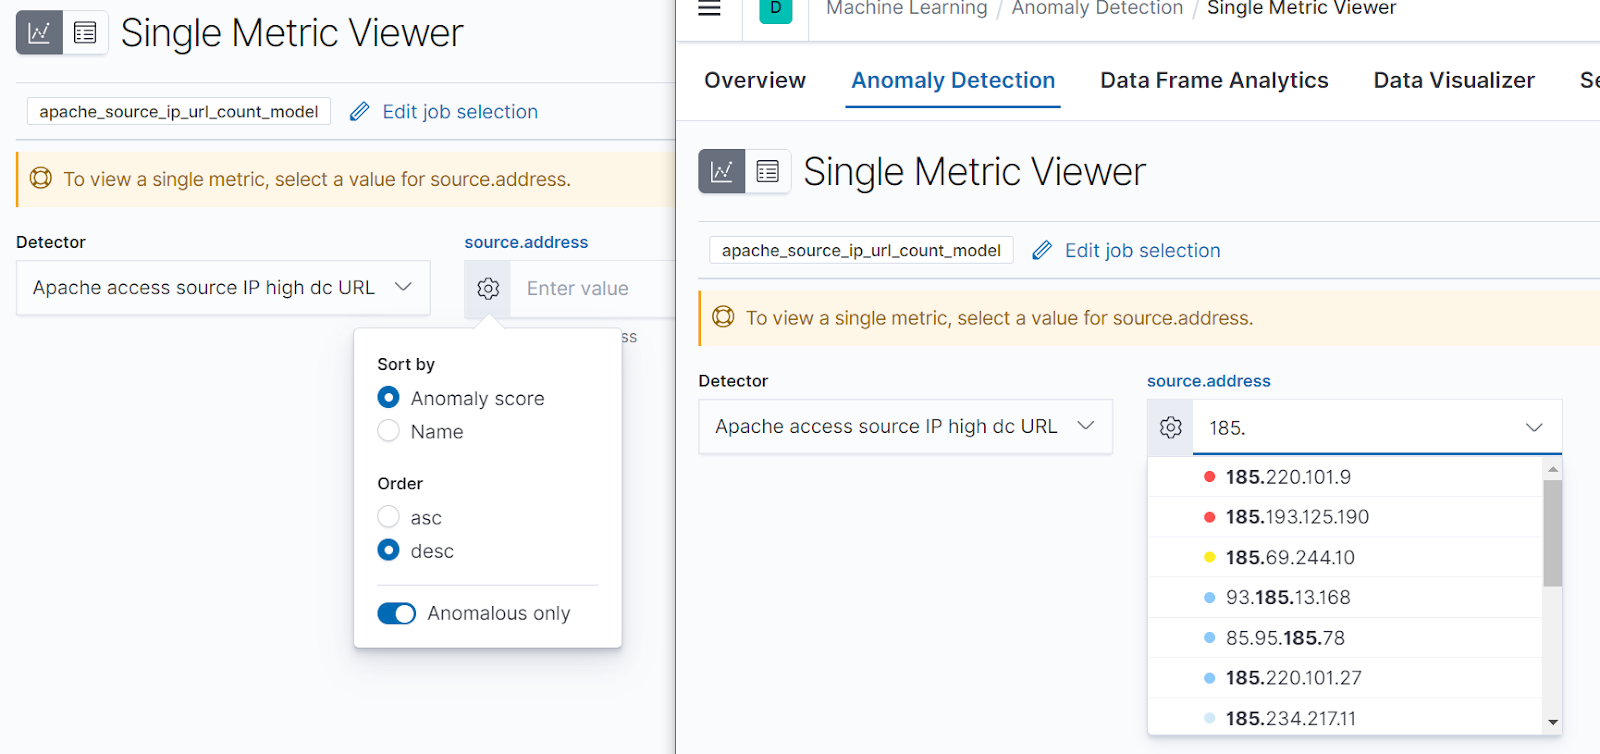
Enhanced navigation for the Single Metric Viewer
editThe new navigation enables you to explore the results of the anomaly detection jobs easier and provides more control for selecting the partitioning field in the Single Metric Viewer. An indication of the maximum anomaly score for each value is now displayed, and you have the possibility to sort matches by score or name and to limit the selection to values which are anomalous over the selected time range.