Introduction
editIntroduction
editCentralized logging for Java applications with the Elastic stack made easy.
This library is in beta. Backward-incompatible changes might be introduced in future releases while the major version is zero (0.x.x).
What is ECS?
editElastic Common Schema (ECS) defines a common set of fields for ingesting data into Elasticsearch. For more information about ECS, visit the ECS Reference Documentation.
What is ECS logging?
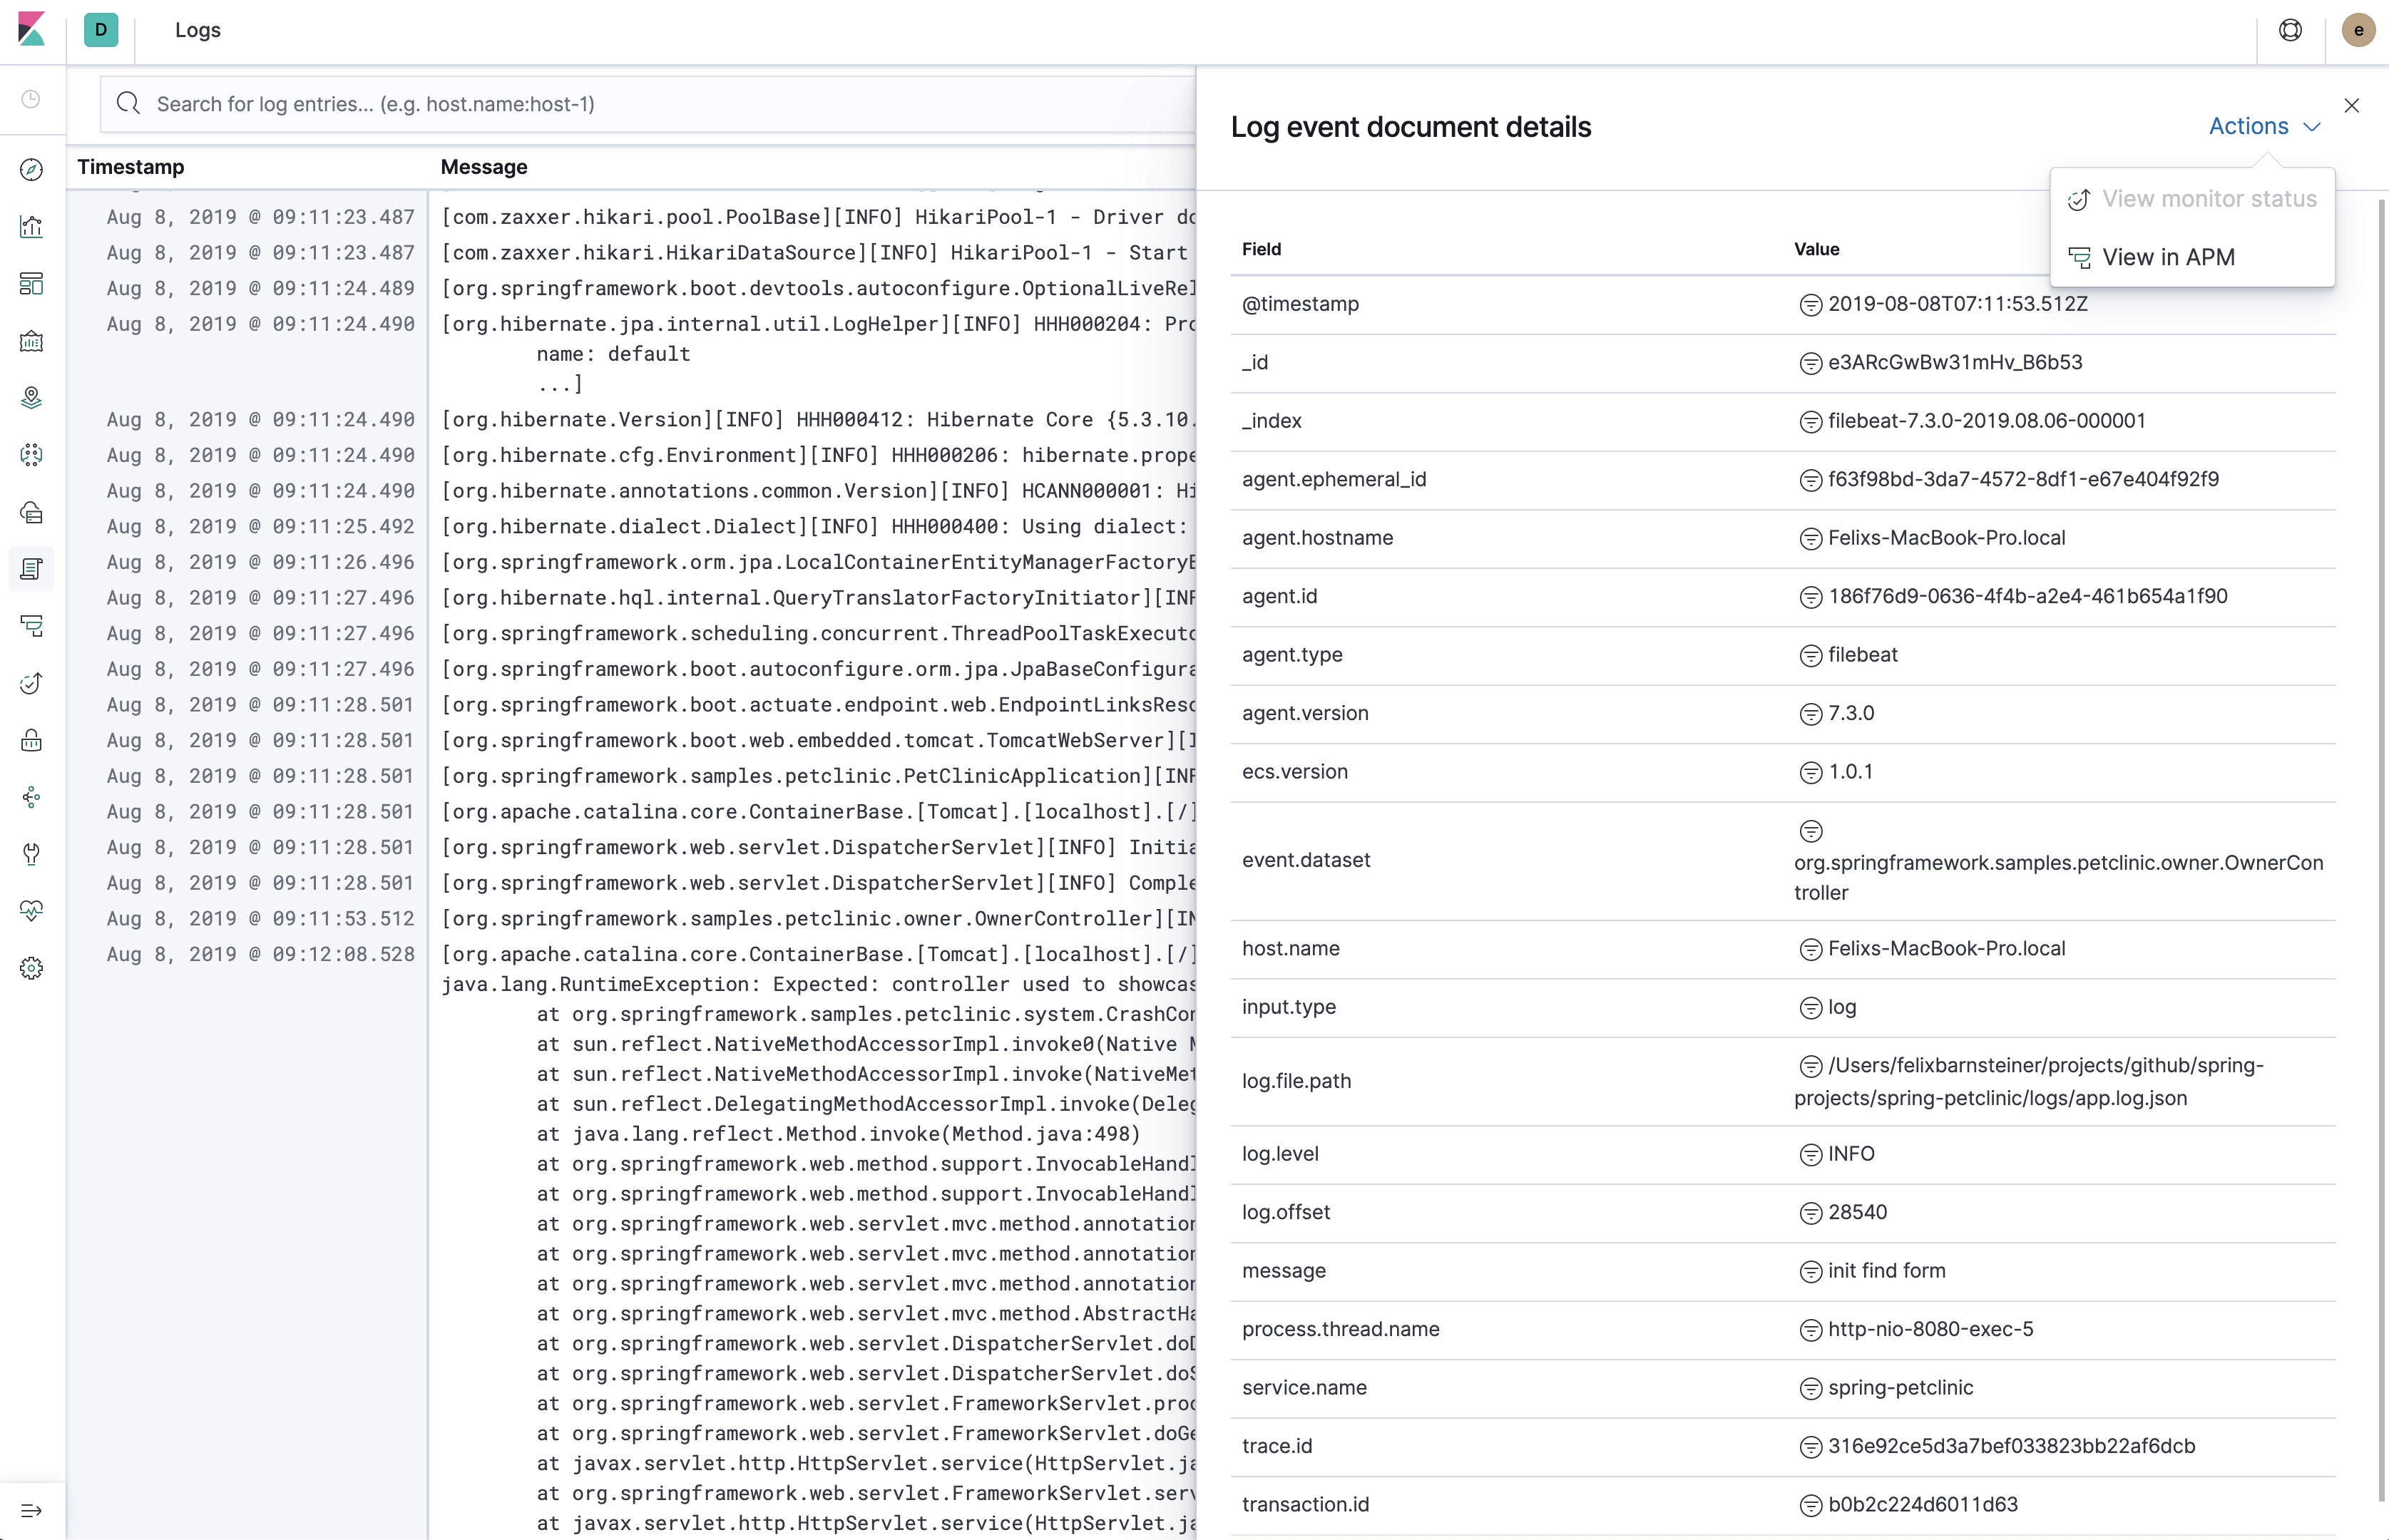
editECS loggers are formatter/encoder plugins for your favorite logging library. They make it easy to format your logs into ECS-compatible JSON. For example:
{"@timestamp":"2019-08-06T12:09:12.375Z", "log.level": "INFO", "message":"Tomcat started on port(s): 8080 (http) with context path ''", "service.name":"spring-petclinic","process.thread.name":"restartedMain","log.logger":"org.springframework.boot.web.embedded.tomcat.TomcatWebServer"}
{"@timestamp":"2019-08-06T12:09:12.379Z", "log.level": "INFO", "message":"Started PetClinicApplication in 7.095 seconds (JVM running for 9.082)", "service.name":"spring-petclinic","process.thread.name":"restartedMain","log.logger":"org.springframework.samples.petclinic.PetClinicApplication"}
{"@timestamp":"2019-08-06T14:08:40.199Z", "log.level":"DEBUG", "message":"init find form", "service.name":"spring-petclinic","process.thread.name":"http-nio-8080-exec-8","log.logger":"org.springframework.samples.petclinic.owner.OwnerController","transaction.id":"28b7fb8d5aba51f1","trace.id":"2869b25b5469590610fea49ac04af7da"}
{"@timestamp":"2019-09-17T13:16:48.038Z", "log.level":"ERROR", "message":"Servlet.service() for servlet [dispatcherServlet] in context with path [] threw exception [Request processing failed; nested exception is java.lang.RuntimeException: Expected: controller used to showcase what happens when an exception is thrown] with root cause", "process.thread.name":"http-nio-8080-exec-1","log.logger":"org.apache.catalina.core.ContainerBase.[Tomcat].[localhost].[/].[dispatcherServlet]","log.origin":{"file.name":"DirectJDKLog.java","function":"log","file.line":175},"error.type":"java.lang.RuntimeException","error.message":"Expected: controller used to showcase what happens when an exception is thrown","error.stack_trace":[
	"java.lang.RuntimeException: Expected: controller used to showcase what happens when an exception is thrown",
	"\tat org.springframework.samples.petclinic.system.CrashController.triggerException(CrashController.java:33)",
	"\tat sun.reflect.NativeMethodAccessorImpl.invoke0(Native Method)",
	"\tat sun.reflect.NativeMethodAccessorImpl.invoke(NativeMethodAccessorImpl.java:62)",
	"\tat sun.reflect.DelegatingMethodAccessorImpl.invoke(DelegatingMethodAccessorImpl.java:43)",
	"\tat java.lang.reflect.Method.invoke(Method.java:498)",
	"\tat org.apache.tomcat.util.threads.TaskThread$WrappingRunnable.run(TaskThread.java:61)",
	"\tat java.lang.Thread.run(Thread.java:748)"]}
Why ECS logging?
edit- No parsing of the log file required
-
ECS-compatible JSON doesn’t require the use of Logstash or grok parsing via an ingest node pipeline.
- No external dependencies
-
By not using any external dependencies such as JSON serializers, the library is incredibly lightweight.
- Highly efficient
-
The log4j2
EcsLayoutdoes not allocate any memory (unless the log event contains anException) which reduces GC pressure. This is achieved by manually serializing JSON so that no intermediate JSON or map representation of a log event is needed. - Decently human-readable JSON structure
-
The first three fields are always
@timestamp,log.levelandmessage. It’s also possible to format stack traces so that each element is rendered in a new line. - Enjoy the benefits of a common schema
-
Use the Kibana Logs app without additional configuration.
Using a common schema across different services and teams makes it possible create reusable dashboards and avoids mapping explosions.
- APM Log correlation
-
If you’re using the Elastic APM Java agent, log correlation is enabled by default starting in version 1.30.0. In previous versions, log correlation is off by default, but can be enabled by setting the
enable_log_correlationconfig totrue. This lets you jump from the Span timeline in the APM UI to the Logs app, showing only the logs which belong to the corresponding request. Vice versa, you can also jump from a log line in the Logs UI to the Span Timeline of the APM UI.
Additional advantages when using in combination with Filebeat
editWe recommend using this library to log into a JSON log file and using Filebeat to send the logs to Elasticsearch. Here are a few benefits to this approach.
- Resilient in case of outages
-
Guaranteed at-least-once delivery without buffering within the application, thus no risk of
OutOfMemoryErrors or lost events. There’s also the option to use either the JSON logs or plain-text logs as a fallback. - Loose coupling
-
The application does not need to know the details of the logging backend (URI, credentials, etc.). You can also leverage alternative Filebeat outputs, like Logstash, Kafka or Redis.
- Index Lifecycle management
-
Leverage Filebeat’s default index lifecycle management settings. This is much more efficient than using daily indices.
- Efficient Elasticsearch mappings
-
Leverage Filebeat’s default ECS-compatible index template
Mapping
editECS field |
Log4j2 API |
Each MDC entry is a top-level field [1] |
|
labels., as in labels.foo, for simple key/value pairs. For nested structures, consider prefixing with custom.. This approach protects against conflicts in case ECS later adds the same fields but with a different mapping.