Ingest logs from a Node.js web application using Filebeat
editIngest logs from a Node.js web application using Filebeat
editThis guide demonstrates how to ingest logs from a Node.js web application and deliver them securely into an Elastic Cloud Enterprise deployment. You’ll set up Filebeat to monitor a JSON-structured log file that has standard Elastic Common Schema (ECS) formatted fields, and you’ll then view real-time visualizations of the log events in Kibana as requests are made to the Node.js server. While Node.js is used for this example, this approach to monitoring log output is applicable across many client types. Check the list of available ECS logging plugins.
This guide presents:
Time required: 1.5 hours
Prerequisites
editTo complete these steps you need the following applications installed on your system:
- Node.js - You will set up a simple Node.js web server and client application. Check the Node.js download page for installation instructions.
For the three following packages, you can create a working directory to install the packages using the Node package manager (NPM). Then, you can run your Node.js webserver and client from the same directory so that it can use the packages. Alternatively, you can also install the Node packages globally by running the Node package install commands with the -g option. Refer to the NPM package installation instructions for details.
-
winston - This is a popular logging package for Node.js. Create a new, local directory and run the following command to install winston in it:
npm install winston
-
The Elastic Common Schema (ECS) formatter for the Node.js winston logger - This plugin formats your Node.js logs into an ECS structured JSON format ideally suited for ingestion into Elasticsearch. To install the ECS winston logger, run the following command in your working directory so that the package is installed in the same location as the winston package:
npm install @elastic/ecs-winston-format
-
Got - Got is a "Human-friendly and powerful HTTP request library for Node.js." - This plugin can be used to query the sample web server used in the tutorial. To install the Got package, run the following command in your working directory:
npm install got
Create a deployment
edit- Log into the Elastic Cloud Enterprise admin console.
- Select Create deployment.
- Give your deployment a name. You can leave all other settings at their default values.
- Select Create deployment and save your Elastic deployment credentials. You will need these credentials later on.
-
You also need the Cloud ID later on, as it simplifies sending data to Elastic Cloud Enterprise. Select the deployment name from the Elastic Cloud Enterprise portal or the Deployments page and copy down the information under Cloud ID:
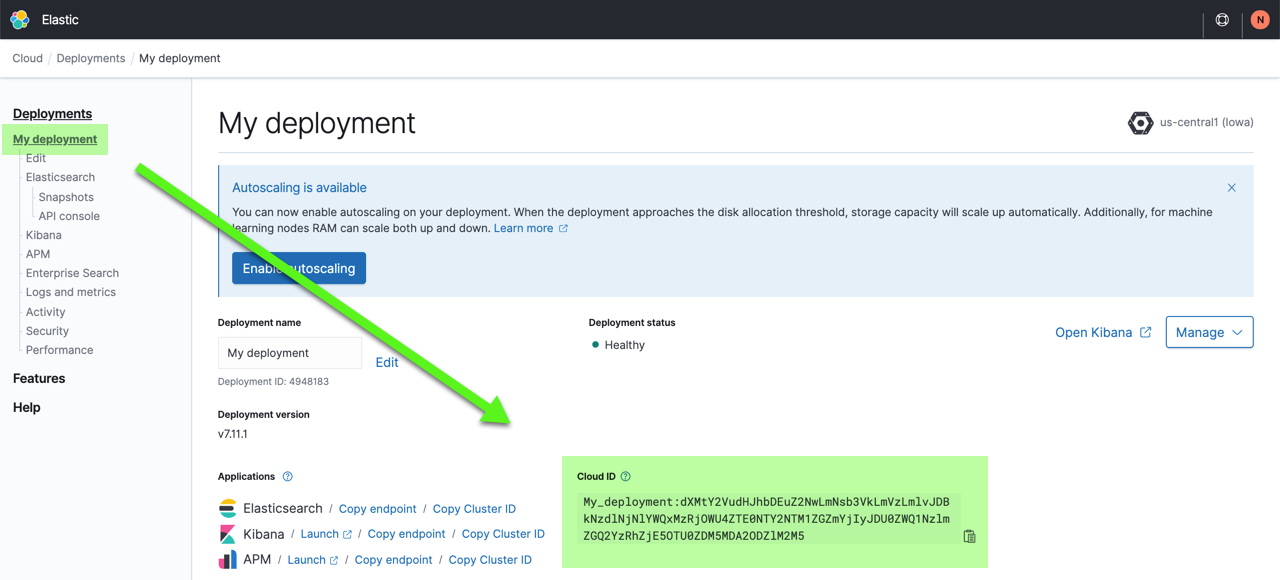
Connect securely
editWhen connecting to Elastic Cloud Enterprise you can use a Cloud ID to specify the connection details. You must pass the Cloud ID that you can find in the cloud console.
To connect to, stream data to, and issue queries with Elastic Cloud Enterprise, you need to think about authentication. Two authentication mechanisms are supported, API key and basic authentication. Here, to get you started quickly, we’ll show you how to use basic authentication, but you can also generate API keys as shown later on. API keys are safer and preferred for production environments.
Create a Node.js web application with logging
editNext, create a basic Node.js script that runs a web server and logs HTTP requests.
-
In the same local directory where you installed the winston and ECS formatter packages, create a new file webserver.js and save it with these contents:
const http = require('http')
const winston = require('winston')
const ecsFormat = require('@elastic/ecs-winston-format')

const logger = winston.createLogger({
  level: 'debug',
  format: ecsFormat({ convertReqRes: true }),
  transports: [
    //new winston.transports.Console(),
    new winston.transports.File({
      //path to log file
      filename: 'logs/log.json',
      level: 'debug'
    })
  ]
})

const server = http.createServer(handler)
server.listen(3000, () => {
  logger.info('listening at http://localhost:3000')
})

function handler (req, res) {
 res.setHeader('Foo', 'Bar')
  res.end('ok')
  logger.info('handled request', { req, res })
}
This Node.js script runs a web server at
http://localhost:3000and uses the winston logger to send logging events, based on HTTP requests, to the filelog.json. -
Try a test run of the Node.js script:
node webserver.js
-
With the script running, open a web browser to
http://localhost:3000and there should be a simpleokmessage. -
In the directory where you created
webserver.js, you should now find a newly createdlog.jsonfile. Open the file and check the contents. There should be one log entry indicating that Node.js is listening on the localhost port, and another entry for the HTTP request from when you openedlocalhostin your browser.Leave
webserver.jsrunning for now and we’ll send it some HTTP requests.
Create a Node.js HTTP request application
editIn this step, you’ll create a Node.js application that sends HTTP requests to your web server.
-
In your working directory, create a file _webrequests.js and save it with these contents:
const got = require('got');

const addresses = [
    'aardvark@the.zoo',
    'crocodile@the.zoo',
    'elephant@the.zoo',
    'emu@the.zoo',
    'hippopotamus@the.zoo',
    'llama@the.zoo',
    'octopus@the.zoo',
    'otter@the.zoo',
    'panda@the.zoo',
    'pangolin@the.zoo',
    'tortoise@the.zoo',
    'walrus@the.zoo'
];

const method = [
    'get',
    'put',
    'post'
];

async function sleep(millis) {
    return new Promise(resolve => setTimeout(resolve, millis));
}

(async () => {
    while (true) {
        var type = Math.floor(Math.random() * method.length);
        var email = Math.floor(Math.random() * addresses.length);
        var sleeping = Math.floor(Math.random() * 9) + 1;

        switch (method[type]) {
            case 'get':
                try {
                    const response = await got.get('http://localhost:3000/', {
                        headers: {
                            from: addresses[email]
                        }
                    }).json();
                    console.log(response.body);
                } catch (error) {
                    console.log(error.response.body);
                }
                break; // end case 'get'
            case 'put':
                try {
                    const response = await got.put('http://localhost:3000/', {
                        headers: {
                            from: addresses[email]
                        }
                    }).json();
                    console.log(response.body);
                } catch (error) {
                    console.log(error.response.body);
                }
                break; // end case 'put'
            case 'post':
                try {
                    const {
                        data
                    } = await got.post('http://localhost:3000/', {
                        headers: {
                            from: addresses[email]
                        }
                    }).json();
                    console.log(data);
                } catch (error) {
                    console.log(error.response.body);
                }
                break; // end case 'post'
        } // end switch on method
    await sleep(sleeping * 1000);
    }
})();
This Node.js app generates HTTP requests with a random method of type
GET,POST, orPUT, and a randomfromrequest header using various pretend email addresses. The requests are sent at random intervals between 1 and 10 seconds.The Got package is used to send the requests, and they are directed to your web server at
http://localhost:3000. To learn about sending custom headers such as thefromfield used in this example, check headers in the Got documentation. -
In a new terminal window, give the Node.js script a trial run:
node webrequests.js
-
After the script has run for about 30 seconds, enter CTRL + C to stop it. Have a look at your Node.js
logs/log.jsonfile. It should contain some entries like this one:{"@timestamp":"2021-09-09T18:42:20.799Z","log.level":"info","message":"handled request","ecs":{"version":"1.6.0"},"http":{"version":"1.1","request":{"method":"POST","headers":{"user-agent":"got (https://github.com/sindresorhus/got)","from":"octopus@the.zoo","accept":"application/json","accept-encoding":"gzip, deflate, br","host":"localhost:3000","connection":"close","content-length":"0"},"body":{"bytes":0}},"response":{"status_code":200,"headers":{"foo":"Bar"}}},"url":{"path":"/","full":"http://localhost:3000/"},"client":{"address":"::ffff:127.0.0.1","ip":"::ffff:127.0.0.1","port":49930},"user_agent":{"original":"got (https://github.com/sindresorhus/got)"}}Each log entry contains details of the HTTP request. In particular, in this example you can find the timestamp of the request, a request method of type
PUT, and a requestfromheader with the email addressoctopus@the.zoo. Your example will likely be a bit different since the request type and the email address are generated randomly.Having your logs written in a JSON format with ECS fields allows for easy parsing and analysis, and for standardization with other applications. A standard, easily parsible format becomes increasingly important as the volume and type of data captured in your logs expands over time.
-
After confirming that both
webserver.jsandwebrequests.jsrun as expected, enter CTRL + C to stop the Node.js script, and also deletelog.json.
Set up Filebeat
editFilebeat offers a straightforward, easy to configure way to monitor your Node.js log files and port the log data into Elastic Cloud Enterprise.
Get Filebeat
Download Filebeat and unpack it on the local server from which you want to collect data.
Configure Filebeat to access Elastic Cloud Enterprise
In <localpath>/filebeat-<version>/ (where <localpath> is the directory where Filebeat is installed and <version> is the Filebeat version number), open the filebeat.yml configuration file for editing.
# =============================== Elastic Cloud ================================

# These settings simplify using Filebeat with the Elastic Cloud (https://cloud.elastic.co/).

# The cloud.id setting overwrites the `output.elasticsearch.hosts` and
# `setup.kibana.host` options.
# You can find the `cloud.id` in the Elastic Cloud web UI.
cloud.id: my-deployment:yTMtd5VzdKEuP2NwPbNsb3VkLtKzLmldJDcyMzUyNjBhZGP7MjQ4OTZiNTIxZTQyOPY2C2NeOGQwJGQ2YWQ4M5FhNjIyYjQ9ODZhYWNjKDdlX2Yz4ELhRYJ7

# The cloud.auth setting overwrites the `output.elasticsearch.username` and
# `output.elasticsearch.password` settings. The format is `<user>:<pass>`.
cloud.auth: elastic:591KhtuAgTP46by9C4EmhGuk

setup.kibana:
  ssl.certificate_authorities: ["/path/to/your/elastic-ece-ca-cert.pem"]

output.elasticsearch:
  ssl.certificate_authorities: ["/path/to/your/elastic-ece-ca-cert.pem"]
#
|
Uncomment the |
|
|
Uncomment the |
|
|
The two lines related to |
Configure Filebeat inputs
Filebeat has several ways to collect logs. For this example, you’ll configure log collection manually.
In the filebeat.inputs section of filebeat.yml, set enabled: to true, and set paths: to the location of your web server log file. In this example, set the same directory where you saved webserver.js:
filebeat.inputs:

# Each - is an input. Most options can be set at the input level, so
# you can use different inputs for various configurations.
# Below are the input specific configurations.

- type: log

  # Change to true to enable this input configuration.
  enabled: true

  # Paths that should be crawled and fetched. Glob based paths.
  paths:
    - /path/to/logs/log.json
You can specify a wildcard (*) character to indicate that all log files in the specified directory should be read. You can also use a wildcard to read logs from multiple directories. For example /var/log/*/*.log.
Add the JSON input options
Filebeat’s input configuration options include several settings for decoding JSON messages. Log files are decoded line by line, so it’s important that they contain one JSON object per line.
For this example, Filebeat uses the following four decoding options.
  json.keys_under_root: true
  json.overwrite_keys: true
  json.add_error_key: true
  json.expand_keys: true
To learn more about these settings, check JSON input configuration options and Decode JSON fields in the Filebeat Reference.
Append the four JSON decoding options to the Filebeat inputs section of filebeat.yml, so that the section now looks like this:
# ============================== Filebeat inputs ===============================

filebeat.inputs:

# Each - is an input. Most options can be set at the input level, so
# you can use different inputs for various configurations.
# Below are the input specific configurations.

- type: log

  # Change to true to enable this input configuration.
  enabled: true

  # Paths that should be crawled and fetched. Glob based paths.
  paths:
    - /path/to/logs/log.json
  json.keys_under_root: true
  json.overwrite_keys: true
  json.add_error_key: true
  json.expand_keys: true
Finish setting up Filebeat
Filebeat comes with predefined assets for parsing, indexing, and visualizing your data. To load these assets, run the following from the Filebeat installation directory:
./filebeat setup -e
Depending on variables including the installation location, environment, and local permissions, you might need to change the ownership of filebeat.yml. You can also try running the command as root: sudo ./filebeat setup -e or you can disable strict permission checks by running the command with the --strict.perms=false option.
The setup process takes a couple of minutes. If everything goes successfully you should get a confirmation message:
Loaded Ingest pipelines
The Filebeat data view is now available in Elasticsearch. To verify:
- Login to Kibana.
- Open the Kibana main menu and select Stack Management, then Data views.
- In the search bar, search for filebeat. You should get filebeat-* in the search results.
Optional: Use an API key to authenticate
For additional security, instead of using basic authentication you can generate an Elasticsearch API key through the Elastic Cloud Enterprise console, and then configure Filebeat to use the new key to connect securely to the Elastic Cloud Enterprise deployment.
- Log into the Cloud UI.
- On the deployments page, select your deployment.
- Narrow the list by name, ID, or choose from several other filters. To further define the list, use a combination of filters.
- From your deployment menu, select Elasticsearch, then API Console.
-
Select Post from the drop-down list and enter
/_security/api_keyin the field. -
Enter the following request:
{
 "name": "filebeat-api-key",
 "role_descriptors": {
   "logstash_read_write": {
     "cluster": ["manage_index_templates", "monitor"],
     "index": [
       {
         "names": ["filebeat-*"],
         "privileges": ["create_index", "write", "read", "manage"]
       }
     ]
   }
 }
}
This creates an API key with the cluster
monitorprivilege which gives read-only access for determining the cluster state, andmanage_index_templateswhich allows all operations on index templates. Some additional privileges also allowcreate_index,write, andmanageoperations for the specified index. The indexmanageprivilege is added to enable index refreshes. -
Select Submit. The output should be similar to the following:
{ "api_key": "tV1dnfF-GHI59ykgv4N0U3", "id": "2TBR42gBabmINotmvZjv", "name": "filebeat-api-key" } -
Add your API key information to the Elasticsearch Output section of filebeat.yml, just below output.elasticsearch:. Use the format
<id>:<api_key>. If your results are as shown in this example, enter2TBR42gBabmINotmvZjv:tV1dnfF-GHI59ykgv4N0U3. -
Add a pound (
#) sign to comment out the cloud.auth: elastic:<password> line, since Filebeat will use the API key instead of the deployment username and password to authenticate.# =============================== Elastic Cloud ================================ # These settings simplify using Filebeat with the Elastic Cloud (https://cloud.elastic.co/). # The cloud.id setting overwrites the `output.elasticsearch.hosts` and # `setup.kibana.host` options. # You can find the `cloud.id` in the Elastic Cloud web UI. cloud.id: my-deployment:yTMtd5VzdKEuP2NwPbNsb3VkLtKzLmldJDcyMzUyNjBhZGP7MjQ4OTZiNTIxZTQyOPY2C2NeOGQwJGQ2YWQ4M5FhNjIyYjQ9ODZhYWNjKDdlX2Yz4ELhRYJ7 # The cloud.auth setting overwrites the `output.elasticsearch.username` and # `output.elasticsearch.password` settings. The format is `<user>:<pass>`. #cloud.auth: elastic:591KhtuAgTP46by9C4EmhGuk # ================================== Outputs =================================== # Configure what output to use when sending the data collected by the beat. # ---------------------------- Elasticsearch Output ---------------------------- output.elasticsearch: # Array of hosts to connect to. api_key: "2TBR42gBabmINotmvZjv:tV1dnfF-GHI59ykgv4N0U3"
Send the Node.js logs to Elasticsearch
editIt’s time to send some log data into Elasticsearch!
Launch Filebeat and webserver.js
Launch Filebeat by running the following from the Filebeat installation directory:
./filebeat -e -c filebeat.yml
In this command:
- The -e flag sends output to the standard error instead of the configured log output.
- The -c flag specifies the path to the Filebeat config file.
Just in case the command doesn’t work as expected, check the Filebeat quick start for the detailed command syntax for your operating system. You can also try running the command as root: sudo ./filebeat -e -c filebeat.yml.
Filebeat should now be running and monitoring the contents of log.json, which actually doesn’t exist yet. So, let’s create it. Open a new terminal instance and run the webserver.js Node.js script:
node webserver.js
Next, run the Node.js webrequests.js script to send random requests to the Node.js web server.
node webrequests.js
Let the script run for a few minutes and maybe brew up a quick coffee or tea ☕ . After that, make sure that the log.json file is generated as expected and is populated with several log entries.
Verify the log entries in Elastic Cloud Enterprise
The next step is to confirm that the log data has successfully found it’s way into Elastic Cloud Enterprise.
- Login to Kibana.
- Open the Kibana main menu and select Stack Management, then Data views.
- In the search bar, search for filebeat. You should get filebeat-* in the search results.
- Select filebeat-*.
The filebeat data view shows a list of fields and their details.
Create log visualizations in Kibana
editNow it’s time to create visualizations based off of the application log data.
- Open the Kibana main menu and select Dashboard, then Create dashboard.
- Select Create visualization. The Lens visualization editor opens.
- In the data view dropdown box, select filebeat-*, if it isn’t already selected.
- In the CHART TYPE dropdown box, select Bar vertical stacked, if it isn’t already selected.
- Check that the time filter is set to Last 15 minutes.
- From the Available fields list, drag and drop the @timestamp field onto the visualization builder.
- Drag and drop the http.request.method field onto the visualization builder.
-
A stacked bar chart now shows the relative frequency of each of the three request methods used in our example, measured over time.
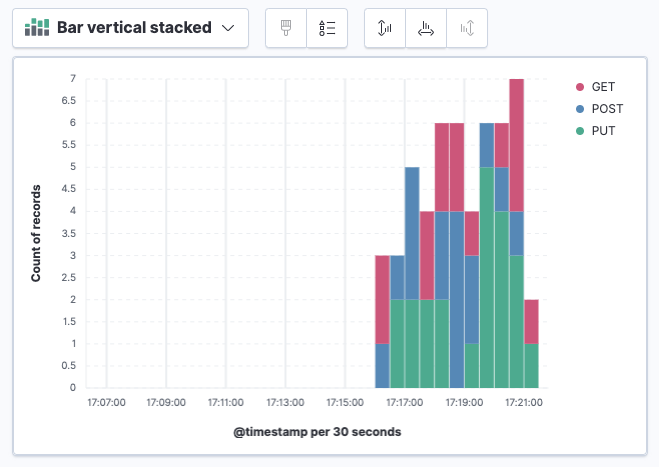
- Select Save and return to add this visualization to your dashboard.
Let’s create a second visualization.
- Select Create visualization.
- Again, make sure that CHART TYPE is set to Bar vertical stacked.
- From the Available fields list, drag and drop the @timestamp field onto the visualization builder.
- Drag and drop the http.request.headers.from field onto the visualization builder.
- In the chart settings area, under Break down by, select Top values of http.request.headers.from and set Number of values to 12. In this example there are twelve different email addresses used in the HTTP from header, so this parameter sets all of them to appear in the chart legend.
-
Select Refresh. A stacked bar chart now shows the relative frequency of each of the HTTP from headers over time.
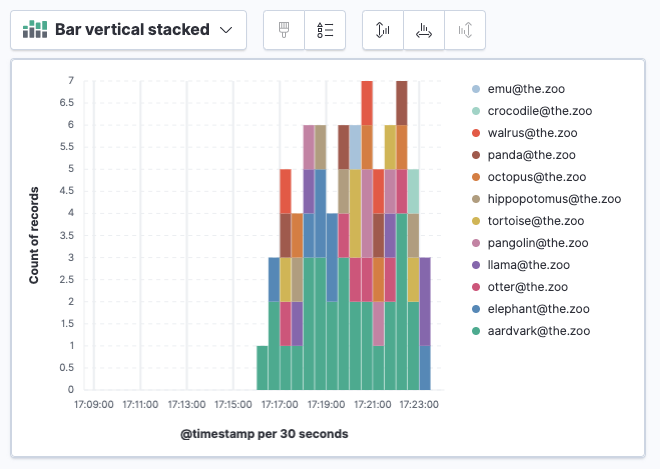
- Select Save and return to add this visualization to your dashboard.
And now for the final visualization.
- Select Create visualization.
- In the CHART TYPE dropdown box, select Donut.
-
From the list of available fields, drag and drop the http.request.method field onto the visualization builder. A donut chart appears.
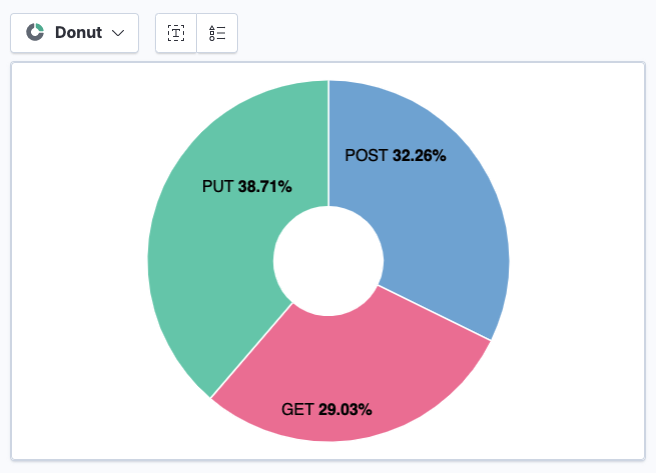
- Select Save and return to add this visualization to your dashboard.
- Select Save and add a title to save your new dashboard.
You now have a Kibana dashboard with three visualizations: a stacked bar chart showing the frequency of each HTTP request method over time, another stacked bar chart showing the frequency of various HTTP from headers over time, and a donut chart showing the relative frequency of each HTTP request method type.
You can add titles to the visualizations, resize and position them as you like, and then save your changes.
View log data updates in real time
-
Select Refresh on the Kibana dashboard. Since the application
webrequests.jscontinues to run and send HTTP requests to the Node.js server,webserver.jscontinues to generate log data, and your Kibana visualizations update with that data with each page refresh.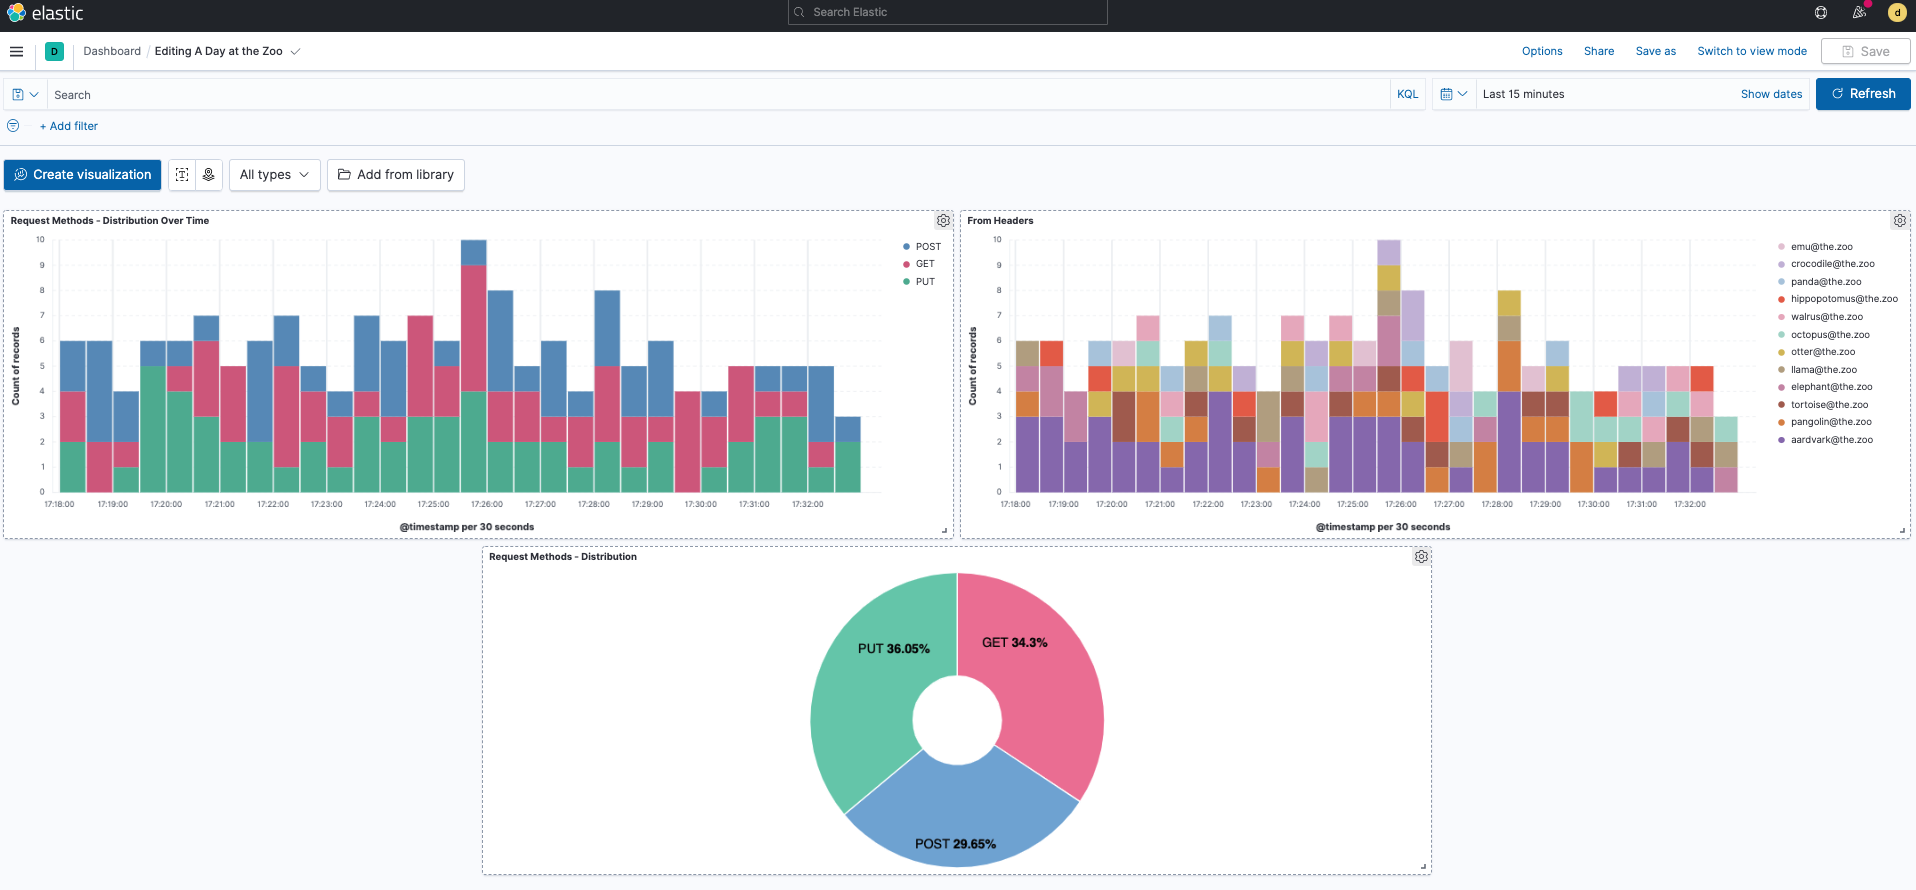
- As your final step, remember to stop Filebeat, the Node.js web server, and the client. Enter CTRL + C in the terminal window for each application to stop them.
You now know how to monitor log files from a Node.js web application, deliver the log event data securely into an Elastic Cloud Enterprise deployment, and then visualize the results in Kibana in real time. Consult the Filebeat documentation to learn more about the ingestion and processing options available for your data. You can also explore our documentation to learn all about working in Elastic Cloud Enterprise.