It is time to say goodbye: This version of Elastic Cloud Enterprise has reached end-of-life (EOL) and is no longer supported.
The documentation for this version is no longer being maintained. If you are running this version, we strongly advise you to upgrade. For the latest information, see the current release documentation.
Log into the Cloud UI
editLog into the Cloud UI
editYou can access the Cloud UI over either HTTP or HTTPS. Secure access through the HTTPS protocol is available with certificates generated during the installation of Elastic Cloud Enterprise, but will prompt you with a warning in your browser. If your organization provides them, add your own TLS/SSL security certificates to avoid receiving a warning in your browser in the future.
To access the Cloud UI in a web browser:
-
Connect to one of the URLs provided at the end of the installation process on your first host, replacing
FIRST_HOSTwith the correct IP address or DNS hostname. Use the credentials provided with the URLs to log in.http://FIRST_HOST:12400 https://FIRST_HOST:12443
You can use either the
adminuser or thereadonlyuser to log in, but only theadminuser has the required privileges to make changes to any resources in the Cloud UI. If you are logging into the Cloud UI for the first time, use theadminuser.On AWS and not able to access the Cloud UI? Check if the URL points to a private IP address.
-
Log in as user
adminwith the credentials provided. - If this is your first time logging in, you must agree to the software license agreement to continue. You also have the chance to opt out of sharing some basic usage statistics with Elastic. (Not sure if you should opt out? Here is what we collect.)
The Cloud UI front page displays the available deployments and some important information about them, such as deployment health status, the Elasticsearch version used, the number of nodes in the cluster, and node capacity:
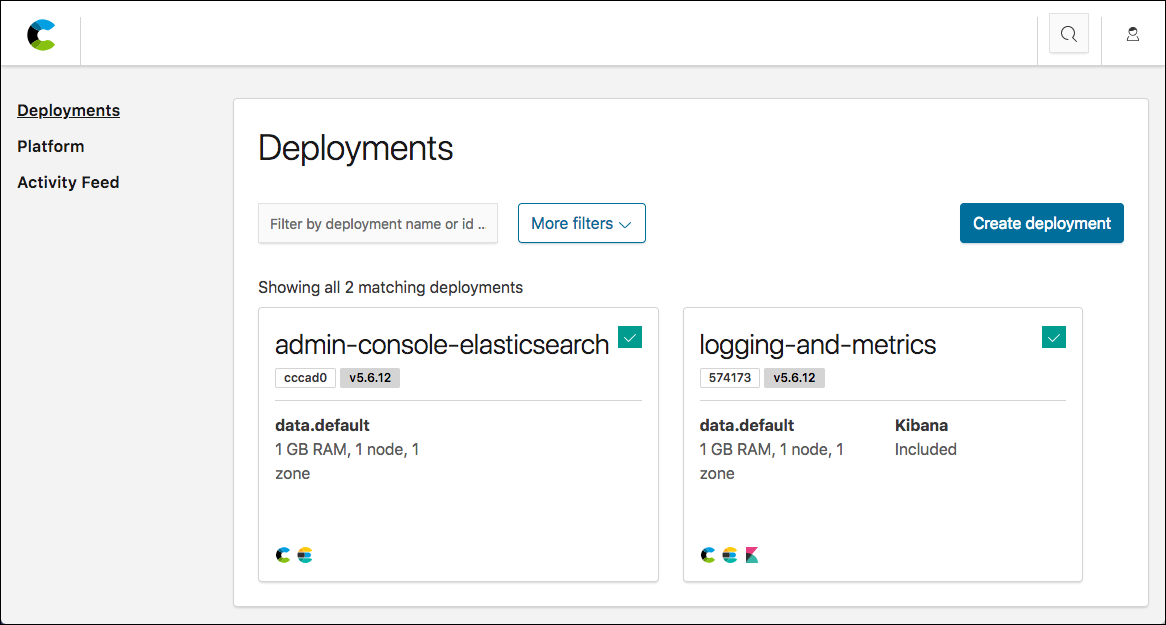
Two deployments are always shown in the Cloud UI:
-
The
admin-console-elasticsearchdeployment that backs the Cloud UI itself. -
The
logging-and-metricsdeployment that collects logs and performance metrics for your ECE installation.
The logging-and-metrics deployment is for use by your ECE installation only. You must not use this deployment to index monitoring data from your own Elasticsearch clusters or use it to index data from Beats and Logstash. Always create a separate, dedicated monitoring deployment for your own use.