It is time to say goodbye: This version of Elastic Cloud Enterprise has reached end-of-life (EOL) and is no longer supported.
The documentation for this version is no longer being maintained. If you are running this version, we strongly advise you to upgrade. For the latest information, see the current release documentation.
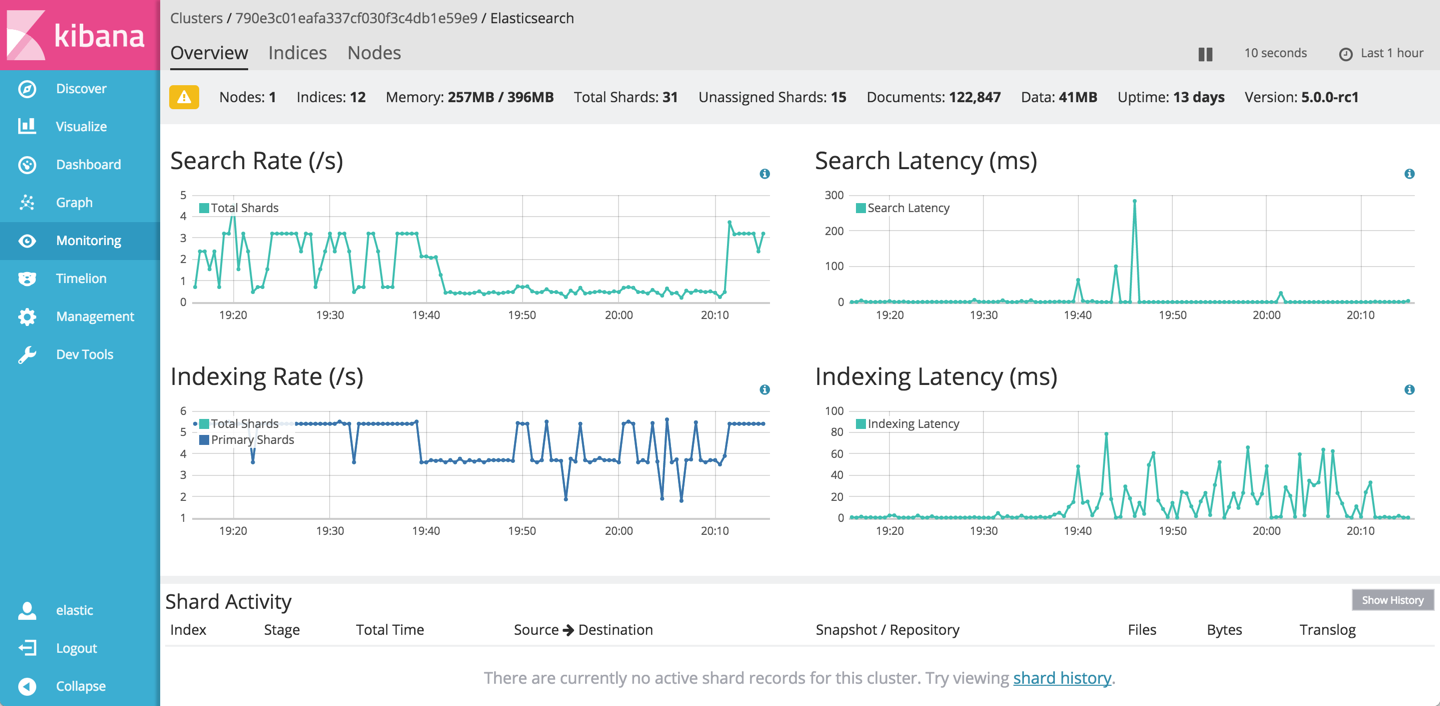
Access the Monitoring application in Kibana
editAccess the Monitoring application in Kibana
editWith monitoring enabled for your Elasticsearch cluster, you can access the Monitoring (formerly Marvel) application through Kibana. The application is a plugin that runs in Kibana.
To access the Monitoring application:
-
Open Kibana on the deployment that is receiving monitoring metrics.
For example, if you have a monitoring and a production deployment, and the production deployment is shipping metrics to the monitoring deployment, then you need to open the Monitoring application on the monitoring deployment to see the metrics.
If you are not sure where to access Kibana on the deployment, Log into the Cloud UI on the deployment that is receiving the metrics, and look up the Kibana endpoint URL.
-
In Kibana, open the Monitoring application:
- In Kibana 5, click on Monitoring in the sidebar on the left.
-
In Kibana 4.5, first click on the App Switcher icon and then click on the Marvel app icon.
After you open the application in Kibana, you see a list of the clusters that you are monitoring.
-
Start exploring the monitoring data: