Configure Beats and Logstash with Cloud ID
editConfigure Beats and Logstash with Cloud ID
editThe Cloud ID reduces the number of steps required to start sending data from Beats or Logstash to your hosted Elasticsearch cluster on Elastic Cloud Enterprise. Because we made it easier to send data, you can start exploring visualizations in Kibana on Elastic Cloud Enterprise that much more quickly.
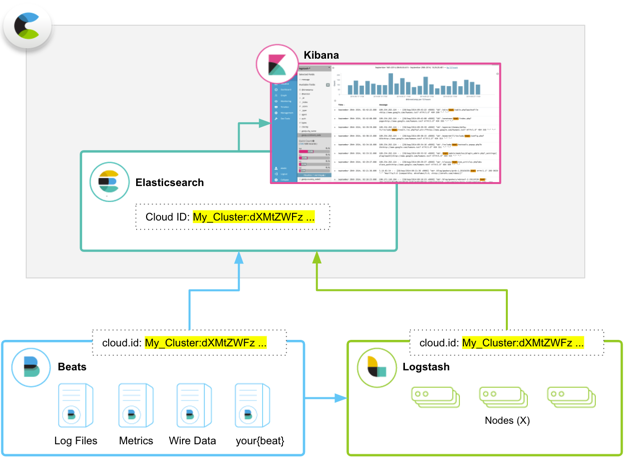
The Cloud ID works by assigning a unique ID to your hosted Elasticsearch cluster on Elastic Cloud Enterprise. All deployments that support the Cloud ID automatically get one. Deployments running version 5.x and later are all supported, including ones that existed before we introduced the Cloud ID.
You include your Cloud ID along with your Elastic Cloud Enterprise user credentials (defined in cloud.auth) when you run Beats or Logstash locally, and then let Elastic Cloud Enterprise handle all of the remaining connection details to send the data to your hosted cluster on Elastic Cloud Enterprise safely and securely.
What are Beats and Logstash?
editNot sure why you need Beats or Logstash? Here’s what they do:
- Beats is our open source platform for single-purpose data shippers. The purpose of Beats is to help you gather data from different sources and to centralize the data by shipping it to Elasticsearch. Beats install as lightweight agents and ship data from hundreds or thousands of machines to your hosted Elasticsearch cluster on Elastic Cloud Enterprise. If you want more processing muscle, Beats can also ship to Logstash for transformation and parsing before the data gets stored in Elasticsearch.
- Logstash is an open source, server-side data processing pipeline that ingests data from a multitude of sources simultaneously, transforms it, and then sends it to your favorite place where you stash things, here your hosted Elasticsearch cluster on Elastic Cloud Enterprise. Logstash supports a variety of inputs that pull in events from a multitude of common sources — logs, metrics, web applications, data stores, and various AWS services — all in continuous, streaming fashion.
Before you begin
editTo use the Cloud ID, you need:
- A deployment with an Elasticsearch cluster on version 5.x or later to send data to.
- Beats or Logstash version 6.x or later, installed locally wherever you want to send data from.
-
To configure Beats or Logstash, you need:
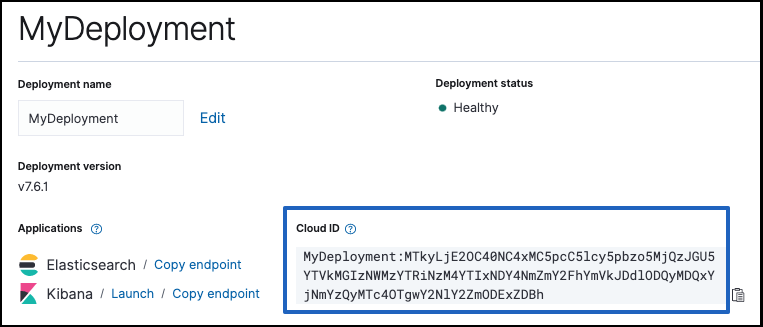
- The unique Cloud ID for your deployment, available from the deployment overview page.
-
A user ID and password that has permission to send data to your cluster.
In our examples, we use the
elasticsuperuser that every version 5.x Elasticsearch cluster comes with. The password for theelasticuser is provided when you create a deployment (and can also be reset if you forget it). On a production system, you should adapt these examples by creating a user that can write to and access only the minimally required indices. For each Beat, review the specific feature and role table, similar to the one in Metricbeat documentation.
Configure Beats with your Cloud ID
editThe following example shows how you can send operational data from Metricbeat to Elastic Cloud Enterprise by using the Cloud ID. Any of the available Beats will work, but we had to pick one for this example.
For others, you can learn more about getting started with each Beat.
To get started with Metricbeat and Elastic Cloud Enterprise:
- Log into the Cloud UI.
-
Create a new deployment and copy down the password for the
elasticuser. - On the deployment overview page, copy down the Cloud ID.
- Set up the Beat of your choice, such as Metricbeat version 7.16.
-
Configure the Beat output to send to Elastic Cloud.
Make sure you replace the values for
cloud.idandcloud.authwith your own information.The
cloud.idfound in the deployment overview page does not explicitly specify a port. This means that Beats will default to using port 443 when usingcloud.id, not the commonly configured Cloud endpoint port 9243. If you need to set up any firewall or proxy rules for Beats, make sure to specify port 443. - Open Kibana and explore!
Metricbeat creates an index pattern in Kibana with defined fields, searches, visualizations, and dashboards that you can start exploring. Look for information related to system metrics, such as CPU usage, utilization rates for memory and disk, and details for processes.