It is time to say goodbye: This version of Elastic Cloud Enterprise has reached end-of-life (EOL) and is no longer supported.
The documentation for this version is no longer being maintained. If you are running this version, we strongly advise you to upgrade. For the latest information, see the current release documentation.
Scenario: Knowing When You Need More Proxies
editScenario: Knowing When You Need More Proxies
editThe following scenario shows you how you can identify the CPU and memory usage of a runner that is holding the proxy role and is routing user requests to Elasticsearch and Kibana. If these usage indicators are consistently high, they might indicate that you need to add another proxy to your Elastic Cloud Enterprise installation or when it is time to separate the proxies from other parts of your installation, such as our medium-sized playbook example.
To find the CPU and memory usage for proxies:
- Access the logging and metrics information in Kibana.
- Open the Dashboard app and select Open.
-
Select the Processes dashboard and search for
proxy.The results include process information for java, internal Docker proxies, and runsv. The CPU and memory usage for the runners that hold the proxy role is indicated by the
javasystem process. Alternatively, you can search forsystem.process.name:java AND proxyto show only the right information.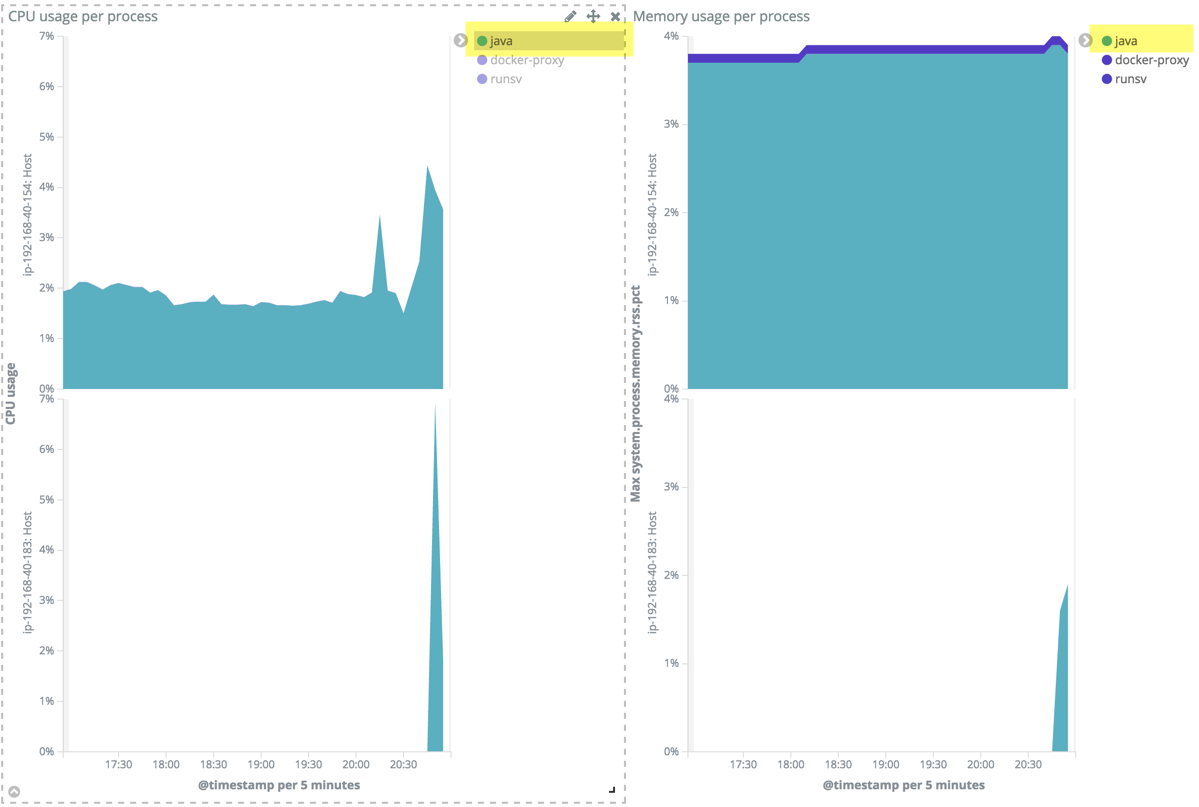
Usage is shown per runner. As you can see, the CPU and memory usage of the proxies is quite low and within single digits. One runner shows less information than the other, because it was only recently assigned the proxy role to improve fault tolerance. Note that for fault-tolerant installations, the remaining proxies must be able to handle the volume of user requests if a proxy fails. In this case, the proxies are over-provisioned and the failure of one proxy will not affect the ability of Elastic Cloud Enterprise to route user requests to Elastisearch and Kibana.