It is time to say goodbye: This version of Elastic Cloud Enterprise has reached end-of-life (EOL) and is no longer supported.
The documentation for this version is no longer being maintained. If you are running this version, we strongly advise you to upgrade. For the latest information, see the current release documentation.
Send Beats to Elastic Cloud Enterprise
editSend Beats to Elastic Cloud Enterprise
editBeats are lightweight data shippers that you install as agents on your servers to send specific types of operational data to Elasticsearch. Different Beats are available for different purposes, such as Packetbeat, Metricbeat, Winlogbeat, and Filebeat, each supported on different operating systems. All of these Beats can be configured to send events to an Elasticsearch cluster hosted on Elastic Cloud Enterprise, where you can analyze the data with Kibana.
Configuring your Beats agents to send events to your Elasticsearch cluster on Elastic Cloud Enterprise is easy. At a minimum, you need to install and configure one of the Beats on a server somewhere and have an Elasticsearch cluster in Elastic Cloud Enterprise that you can send operational data to.
To send Beats events to a secured cluster in Elastic Cloud Enterprise, you should use a user that can manage index templates, monitor the cluster, create indices, and read and write to the indices it creates. In our example, the user filebeat_internal is used, created in the Kibana 5.0 UI that is available in Elastic Cloud Enterprise. For more information on Beats users with the right privileges, see Beats and Security.
Example: Send Filebeat Events to Elastic Cloud Enterprise
editThe following example shows how you can send operational data from Filebeat 5.0 running on a CentOS 7.1 server to an Elasticsearch 5.0 cluster hosted on Elastic Cloud Enterprise.
If you want to learn more about how Filebeat works, see Getting Started With Filebeat.
Different versions of Filebeat and different operating systems require slightly different installation instructions. Make sure you follow the right instructions if your intended setup differs from our example.
To get started with Filebeat on Elastic Cloud Enterprise:
-
Install Filebeat on the CentOS 7.1 server where you want to collect operational data:
curl -L -O https://artifacts.elastic.co/downloads/beats/filebeat/filebeat-{version-long}-x86_64.rpm sudo rpm -vi filebeat-{version-long}-x86_64.rpm -
Configure Filebeat by editing the
/etc/filebeat/filebeat.ymlfile. At a minimum, you need to point Filebeat to your Elasticsearch cluster endpoint in Elastic Cloud Enterprise. You can find the required cluster endpoint information for your cluster on the Overview page in the Cloud UI.In our example, we’re going to use HTTPS to connect to a cluster in Elastic Cloud Enterprise that has Security (formerly Shield) enabled, so we need to specify the host with a port, the HTTPS protocol, and authentication credentials:
#-------------------------- Elasticsearch output ------------------------------
output.elasticsearch:
  # Array of hosts to connect to.
  hosts: ["mycluster.us-east-1.aws.found.io:9243"]

  # Optional protocol and basic auth credentials.
  protocol: "https"
  username: "filebeat_internal"
  password: "xxxxxxxxxxxxxxxxxx"
If you make no other change, Filebeat collects the
*.logfiles in/var/log/. For our example, we’ll leave this default alone, but there are quite a few supported configuration options. If you want to learn more about these options, see Configuration Options (Reference). -
Test your configuration. If configured correctly, you should receive output that includes your Elastic Cloud Enterprise cluster endpoint URL and a
Config OKmessage:sudo ./filebeat -configtest -e ... 2016/10/13 15:32:55.290375 client.go:107: INFO Elasticsearch url: https://mycluster.us-east-1.aws.found.io:9243 ... Config OK
If you receive errors during the configuration test, make sure that you issue the command from the file path where Filebeat is installed and that your templates and configuration file are in the
Config pathexpected by Filebeat. You might need to copy these files into the right location. -
Optional: Configure which index template file to load. For this example, the default
filebeat.template.jsoninstalled by the Filebeat package is used. If you want to learn more about specifying a different template, see Configuring Template Loading. -
Start Filebeat:
sudo /etc/init.d/filebeat start
- Enable Kibana for your cluster on the Configuration page in the Cloud UI, if it isn’t enabled already. The endpoint to access Kibana is shown on the Configuration page after Kibana has been enabled.
-
Load the Kibana index pattern on your Elasticsearch cluster according to the instructions. You’ll use the same cluster endpoint in Elastic Cloud Enterprise that you used earlier and authenticate with the same credentials.
./scripts/import_dashboards -only-index -es https://mycluster.us-east-1.aws.found.io:9243 -user filebeat_internal -pass xxxxxxxxxxxxxxxxxx
The
filebeat-*index pattern you load has to match the version of Filebeat that you installed on the server where you are collecting operational data. In our example, we installed Filebeat 5.0, so we need to load thefilebeat-*index pattern for 5.0 as well. (Our Elasticsearch cluster is at version 5.0 as well, but we could have used a 2.x cluster.) -
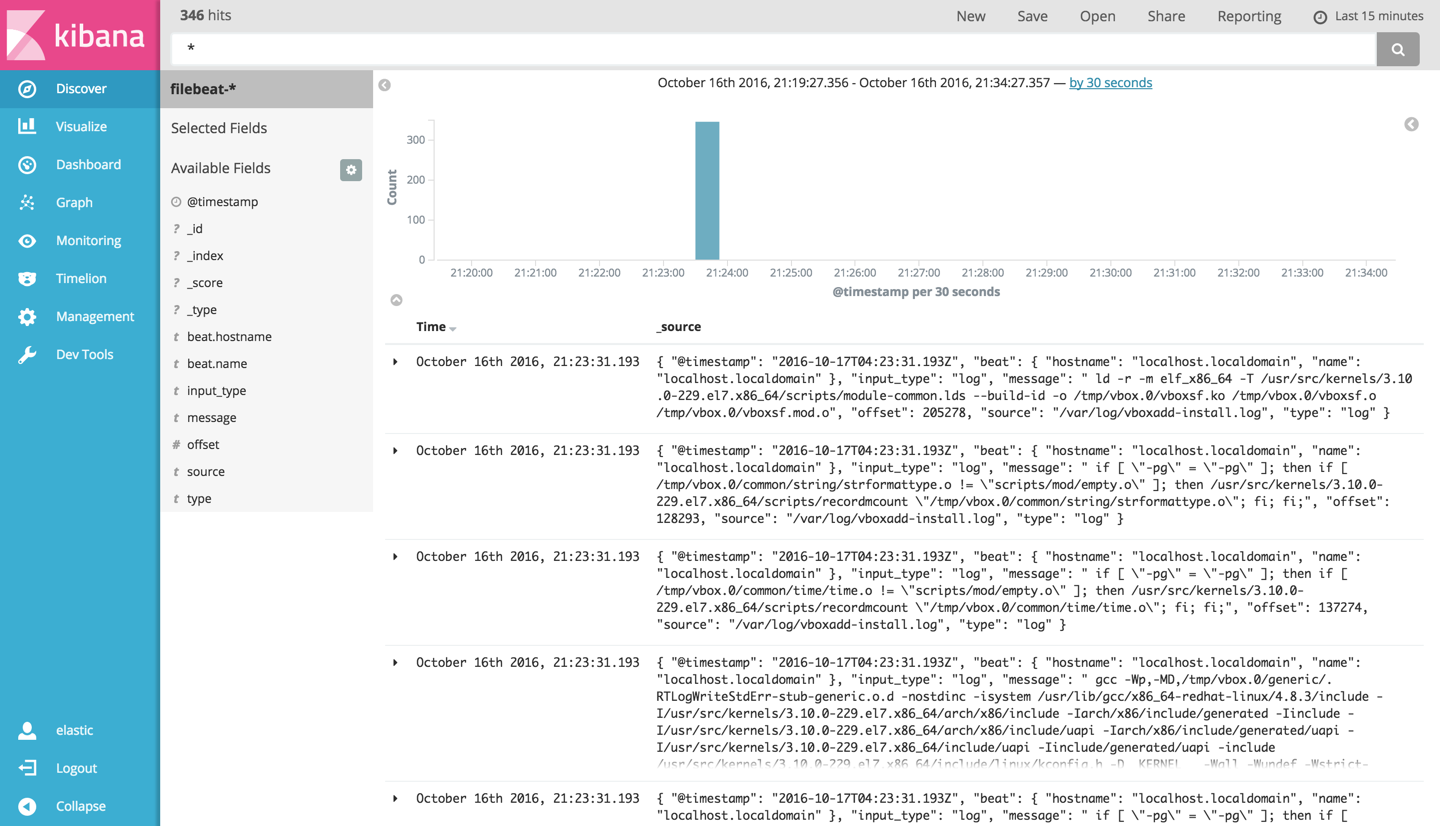
Open Kibana on Elastic Cloud Enterprise and select the
filebeat-*index pattern in Kibana to explore Filebeat events: