Topbeat was replaced by
Metricbeat in 5.0. To learn more about Metricbeat, see the
Metricbeat documentation.
Step 6: Loading Sample Kibana Dashboards
edit
IMPORTANT: This documentation is no longer updated. Refer to Elastic's version policy and the latest documentation.
Step 6: Loading Sample Kibana Dashboards
editTo make it easier for you to start monitoring your servers in Kibana, we have created a few sample dashboards. The dashboards are maintained in this GitHub repository, which also includes instructions for loading the dashboards.
For more information about loading and viewing the dashboards, see Visualizing Your Data in Kibana.
These dashboards are provided as examples. We recommend that you customize them to meet your needs.
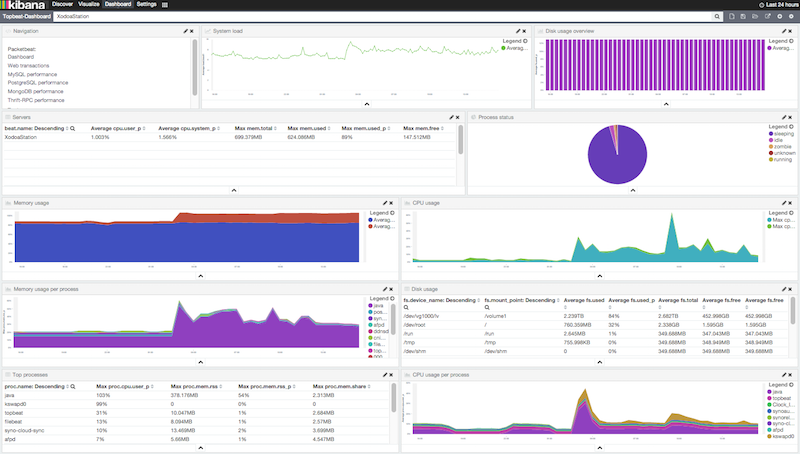
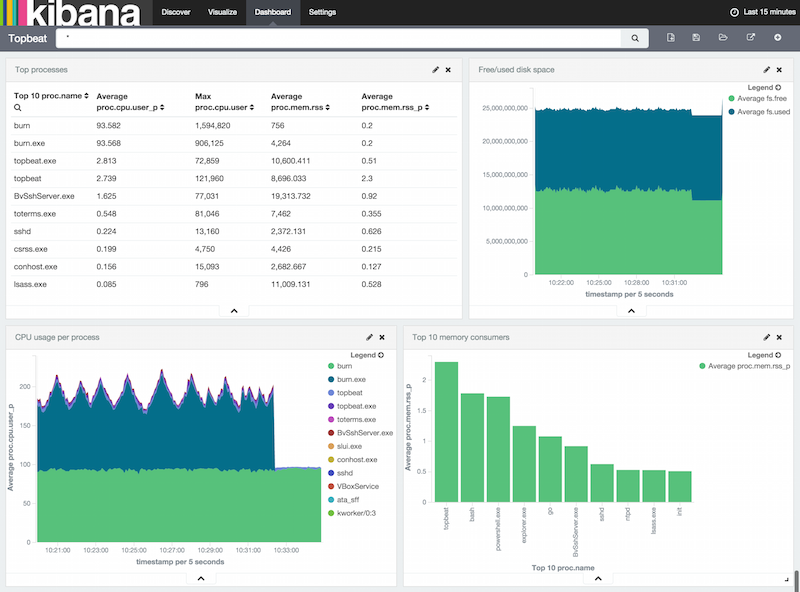
Example of a System-Wide Overview
editYou can configure the Dashboard page to show the statistics for all servers or for a
subset. For example, you might have a dashboard page that shows:
- CPU usage and memory consumption for the top 10 CPU-consuming processes running on different servers
- Free and used disk space for all servers
- CPU usage per process
- Memory consumption per process
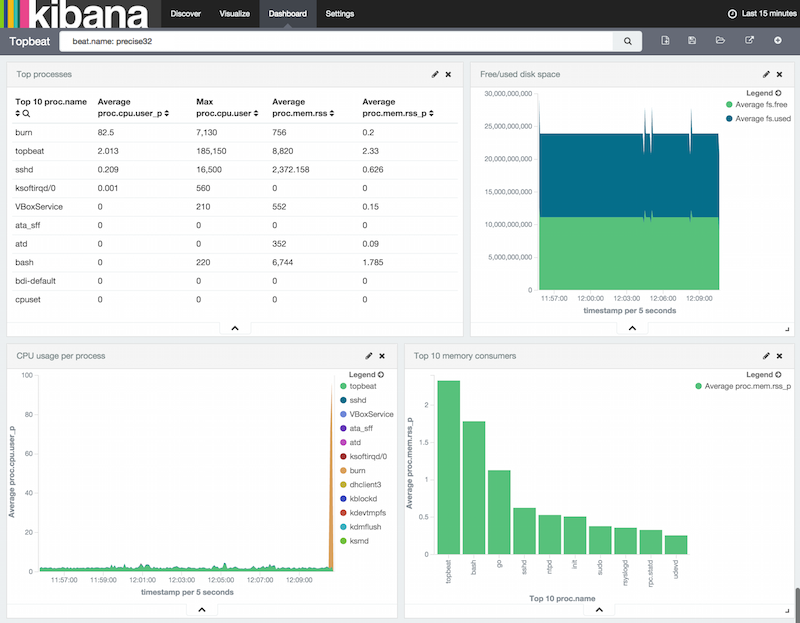
Example of a Per Server Overview
editTo display the statistics coming from a single server, you can use a search query like beat.name: precise32:
You can learn more about Kibana in the Kibana User Guide.
Enjoy!