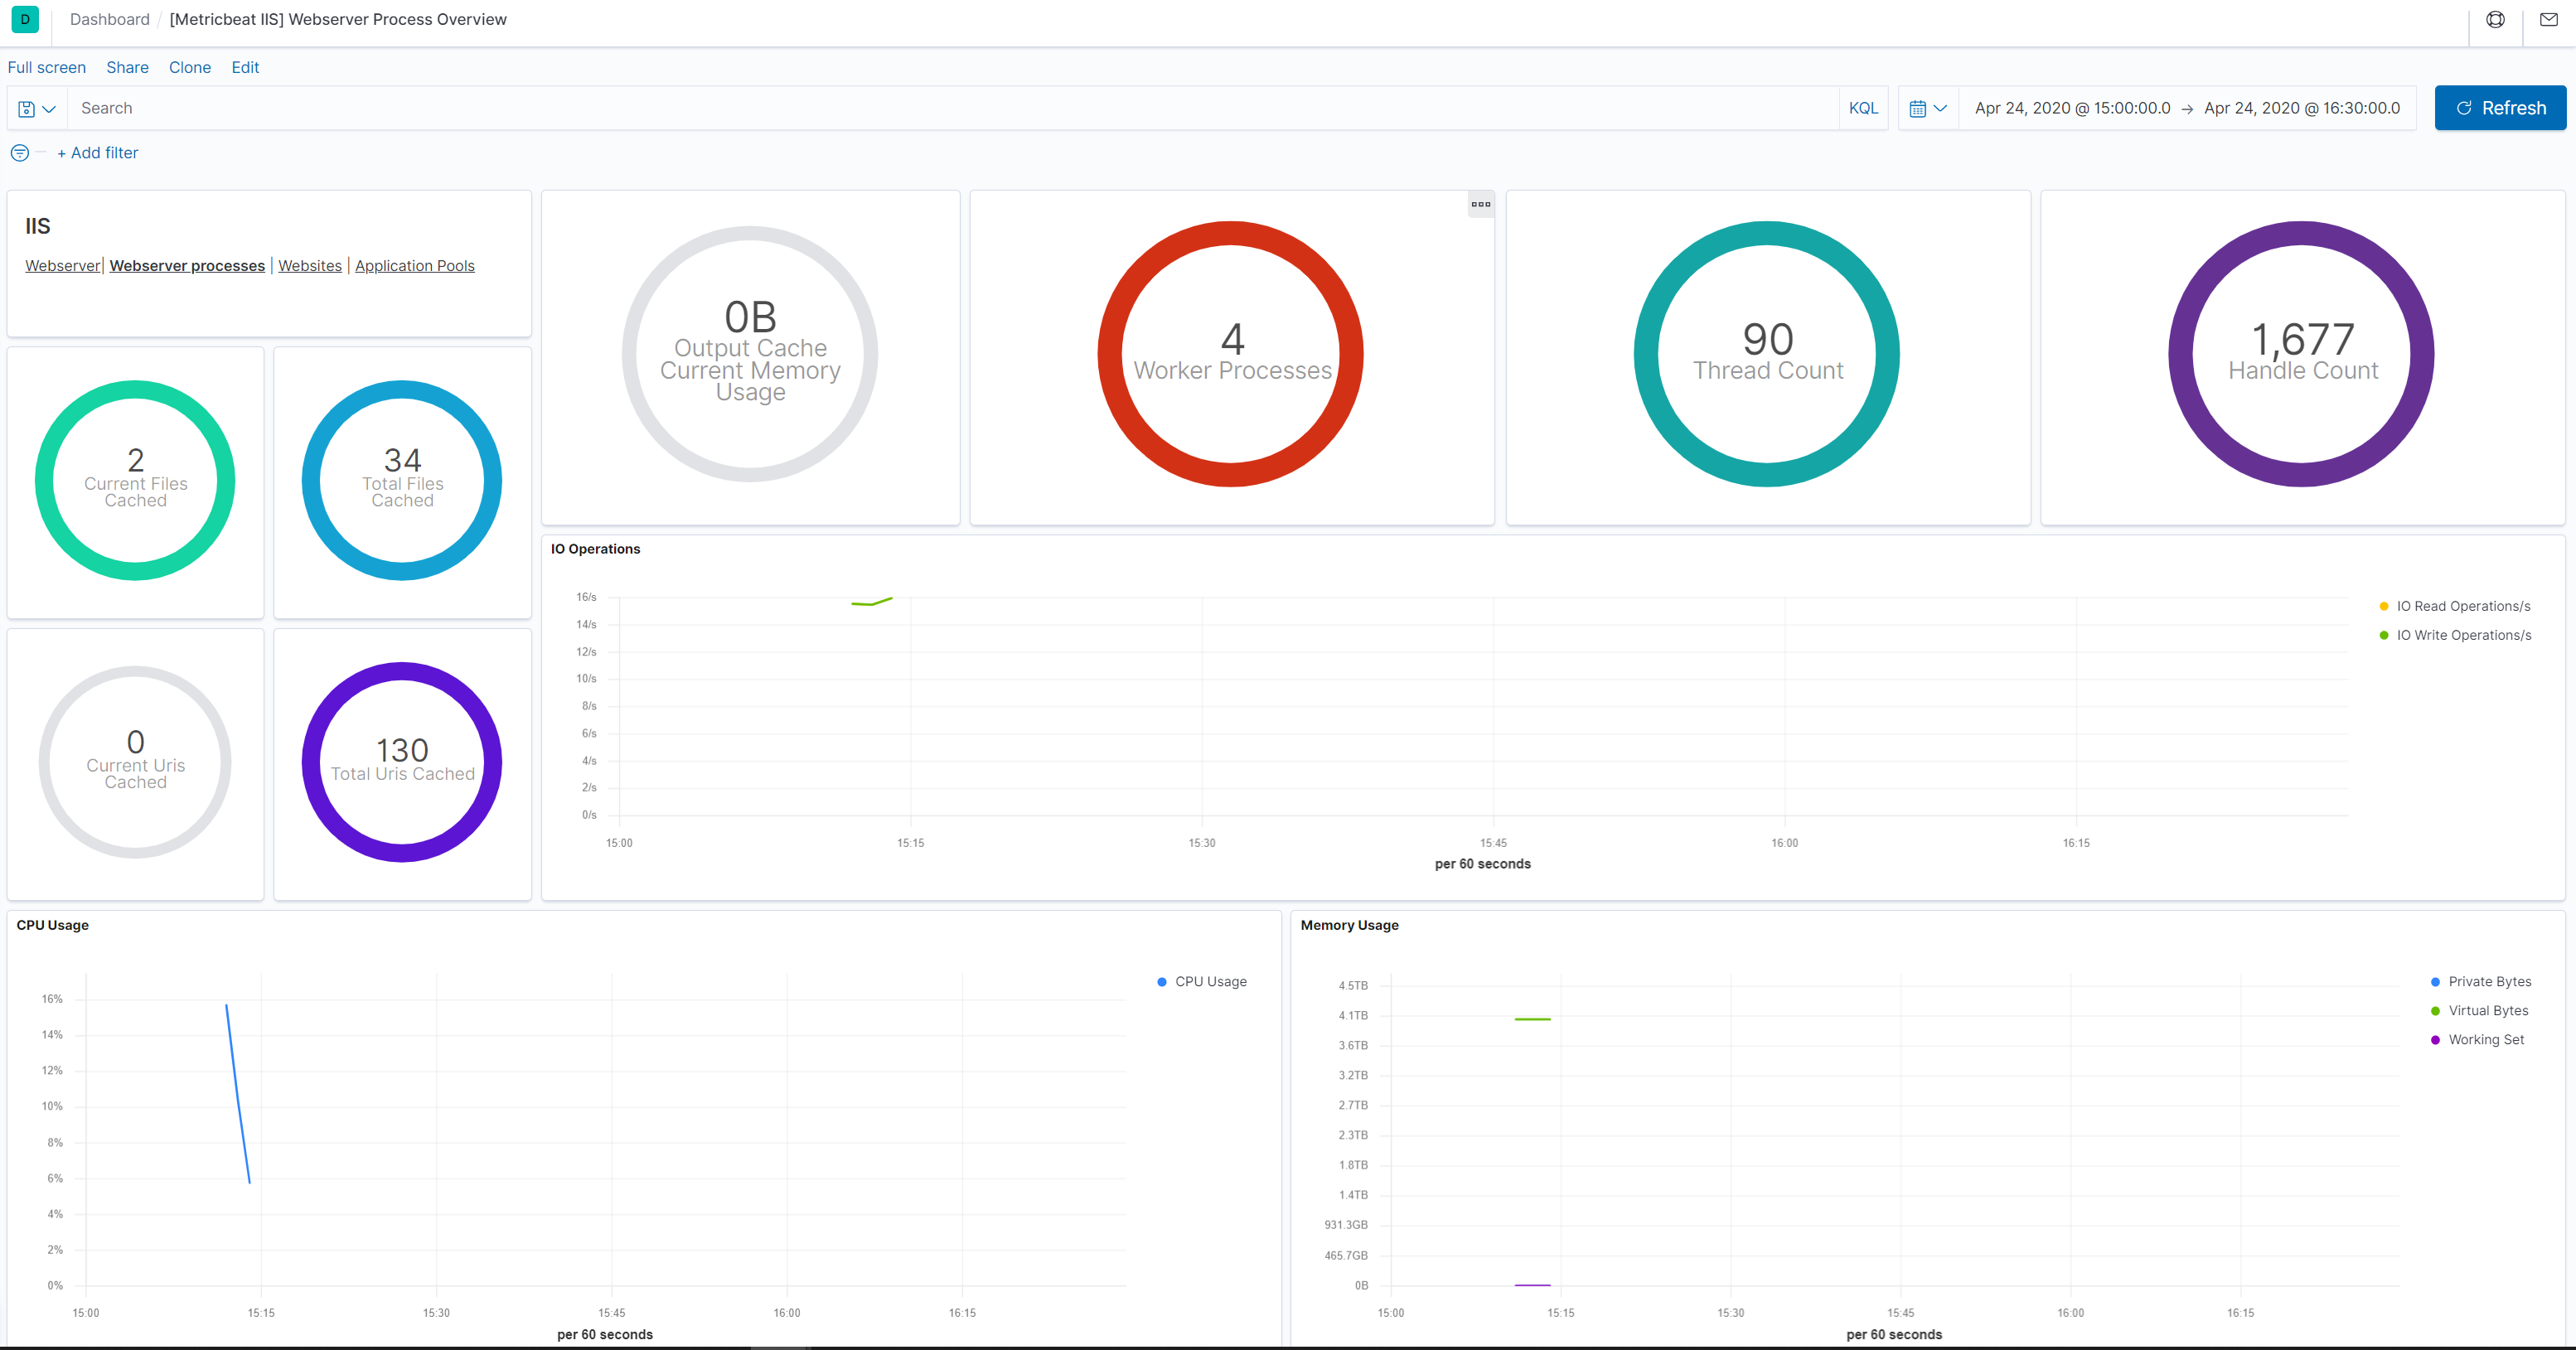
IIS webserver metricset
editIIS webserver metricset
editThis functionality is in beta and is subject to change. The design and code is less mature than official GA features and is being provided as-is with no warranties. Beta features are not subject to the support SLA of official GA features.
This is the webserver metricset of the module iis.
This metricset allows users to retrieve relevant metrics from IIS.
Metric values are divided in several groups:
The process object contains System/Process counters like the the overall server and CPU usage for the IIS Worker Processes and memory (currently used and available memory for the IIS Worker Processes).
The network object contains the IIS Performance counters like:
Web Service: Bytes Received/Sec (helpful to track to identify potential spikes in traffic), Web Service: Bytes Sent/Sec (helpful to track to identify potential spikes in traffic),
Web Service: Current Connections (through experience with their apps app, users can identify what is a normal value for this) and others.
The cache object contains metrics from the user mode cache and output cache.
The asp_net and asp_net_application contain asp.net related performance counter values.
Dashboard
edit

This is a default metricset. If the host module is unconfigured, this metricset is enabled by default.
Fields
editFor a description of each field in the metricset, see the exported fields section.
Here is an example document generated by this metricset:
{
    "@timestamp": "2017-10-12T08:05:34.853Z",
    "event": {
        "dataset": "iis.webserver",
        "duration": 115000,
        "module": "iis"
    },
    "iis": {
        "webserver": {
            "asp_net": {
                "application_restarts": 0,
                "request_wait_time": 0
            },
            "asp_net_application": {
                "pipeline_instance_count": 3,
                "requests_executing": 0,
                "requests_in_application_queue": 0
            },
            "cache": {
                "current_file_cache_memory_usage": 696,
                "current_files_cached": 2,
                "current_uris_cached": 0,
                "file_cache_hits": 1,
                "file_cache_misses": 7,
                "maximum_file_cache_memory_usage": 696,
                "output_cache_current_items": 0,
                "output_cache_current_memory_usage": 0,
                "output_cache_total_hits": 0,
                "output_cache_total_misses": 8,
                "total_files_cached": 2,
                "total_uris_cached": 1,
                "uri_cache_hits": 0,
                "uri_cache_misses": 8
            },
            "network": {
                "current_anonymous_users": 0,
                "current_connections": 0,
                "current_nonanonymous_users": 0,
                "maximum_connections": 3,
                "service_uptime": 343447,
                "total_anonymous_users": 6,
                "total_bytes_received": 2715,
                "total_bytes_sent": 89432,
                "total_connection_attempts": 4,
                "total_delete_requests": 0,
                "total_get_requests": 6,
                "total_nonanonymous_users": 0,
                "total_post_requests": 0
            }
        }
    },
    "metricset": {
        "name": "webserver",
        "period": 10000
    },
    "service": {
        "type": "iis"
    }
}