NOTE: You are looking at documentation for an older release. For the latest information, see the current release documentation.
PostgreSQL module
editPostgreSQL module
editThe postgresql module collects and parses logs created by
PostgreSQL.
When you run the module, it performs a few tasks under the hood:
- Sets the default paths to the log files (but don’t worry, you can override the defaults)
- Makes sure each multiline log event gets sent as a single event
- Uses ingest node to parse and process the log lines, shaping the data into a structure suitable for visualizing in Kibana
- Deploys dashboards for visualizing the log data
Compatibility
editThe postgresql module was tested with logs from versions 9.5 on Ubuntu and 9.6
on Debian.
Set up and run the module
editBefore doing these steps, verify that Elasticsearch and Kibana are running and that Elasticsearch is ready to receive data from Filebeat.
If you’re running our hosted Elasticsearch Service on Elastic Cloud, or you’ve enabled security in Elasticsearch and Kibana, you need to specify additional connection information before setting up and running the module. See Quick start: modules for common log formats for the complete setup.
To set up and run the module:
-
Enable the module:
deb and rpm:
filebeat modules enable postgresql
mac:
./filebeat modules enable postgresql
linux:
./filebeat modules enable postgresql
win:
PS > .\filebeat.exe modules enable postgresql
This command enables the module config defined in the
modules.ddirectory. See Specify which modules to run for other ways to enable modules.To see a list of enabled and disabled modules, run:
deb and rpm:
filebeat modules list
mac:
./filebeat modules list
linux:
./filebeat modules list
win:
PS > .\filebeat.exe modules list
-
Set up the initial environment:
deb and rpm:
filebeat setup -e
mac:
./filebeat setup -e
linux:
./filebeat setup -e
win:
PS > .\filebeat.exe setup -e
The
setupcommand loads the recommended index template for writing to Elasticsearch and deploys the sample dashboards (if available) for visualizing the data in Kibana. This is a one-time setup step.The
-eflag is optional and sends output to standard error instead of syslog.The ingest pipelines used to parse log lines are set up automatically the first time you run the module, assuming the Elasticsearch output is enabled. If you’re sending events to Logstash, or plan to use Beats central management, also see Load ingest pipelines manually.
-
Run Filebeat.
If your logs aren’t in the default location, see Configure the module, then run Filebeat after you’ve set the paths variable.
deb and rpm:
service filebeat start
mac:
./filebeat -e
linux:
./filebeat -e
win:
PS > Start-Service filebeat
If the module is configured correctly, you’ll see
INFO Harvester startedmessages for each file specified in the config.Depending on how you’ve installed Filebeat, you might see errors related to file ownership or permissions when you try to run Filebeat modules. See Config File Ownership and Permissions in the Beats Platform Reference for more information.
-
Explore your data in Kibana:
-
Open your browser and navigate to the Dashboard overview in Kibana:
http://localhost:5601/app/kibana#/dashboards.
Replace
localhostwith the name of the Kibana host. If you’re using an Elastic Cloud instance, log in to your cloud account, then navigate to the Kibana endpoint in your deployment. - If necessary, log in with your Kibana username and password.
-
Enter the module name in the search box, then open a dashboard and explore the visualizations for your parsed logs.
If you don’t see data in Kibana, try changing the date range to a larger range. By default, Kibana shows the last 15 minutes.
-
Open your browser and navigate to the Dashboard overview in Kibana:
http://localhost:5601/app/kibana#/dashboards.
Replace
Supported log formats
editThis module can collect any logs from PostgreSQL servers, but to be able to better analyze their contents and extract more information, they should be formatted in a determined way.
There are some settings to take into account for the log format.
Log lines should be preffixed with the timestamp in milliseconds, the process id, the user id and the database name. This uses to be the default in most distributions, and is translated to this setting in the configuration file:
log_line_prefix = '%m [%p] %q%u@%d '
PostgreSQL server can be configured to log statements and their durations and this module is able to collect this information. To be able to correlate each duration with their statements, they must be logged in the same line. This happens when the following options are used:
log_duration = 'on'
log_statement = 'none'
log_min_duration_statement = 0
Setting a zero value in log_min_duration_statement will log all statements
executed by a client. You probably want to configure it to a higher value, so it
logs only slower statements. This value is configured in milliseconds.
When using log_statement and log_duration together, statements and durations
are logged in different lines, and Filebeat is not able to correlate both
values, for this reason it is recommended to disable log_statement.
The PostgreSQL module of Metricbeat is also able to collect information about all statements executed in the server. You may chose which one is better for your needings. An important difference is that the Metricbeat module collects aggregated information when the statement is executed several times, but cannot know when each statement was executed. This information can be obtained from logs.
Other logging options that you may consider to enable are the following ones:
log_checkpoints = 'on';
log_connections = 'on';
log_disconnections = 'on';
log_lock_waits = 'on';
Both log_connections and log_disconnections can cause a lot of events if you
don’t have persistent connections, so enable with care.
Configure the module
editYou can further refine the behavior of the postgresql module by specifying
variable settings in the
modules.d/postgresql.yml file, or overriding settings at the command line.
The following example shows how to set paths in the modules.d/postgresql.yml
file to override the default paths for PostgreSQL logs:
- module: postgresql
  log:
    enabled: true
    var.paths: ["/path/to/log/postgres/*.log*"]
To specify the same settings at the command line, you use:
-M "postgresql.log.var.paths=[/path/to/log/postgres/*.log*]"
Variable settings
editEach fileset has separate variable settings for configuring the behavior of the
module. If you don’t specify variable settings, the postgresql module uses
the defaults.
For more information, see Specify variable settings. Also see Advanced settings.
When you specify a setting at the command line, remember to prefix the
setting with the module name, for example, postgresql.log.var.paths
instead of log.var.paths.
log fileset settings
edit-
var.paths -
An array of glob-based paths that specify where to look for the log files. All
patterns supported by Go Glob
are also supported here. For example, you can use wildcards to fetch all files
from a predefined level of subdirectories:
/path/to/log/*/*.log. This fetches all.logfiles from the subfolders of/path/to/log. It does not fetch log files from the/path/to/logfolder itself. If this setting is left empty, Filebeat will choose log paths based on your operating system.
Example dashboards
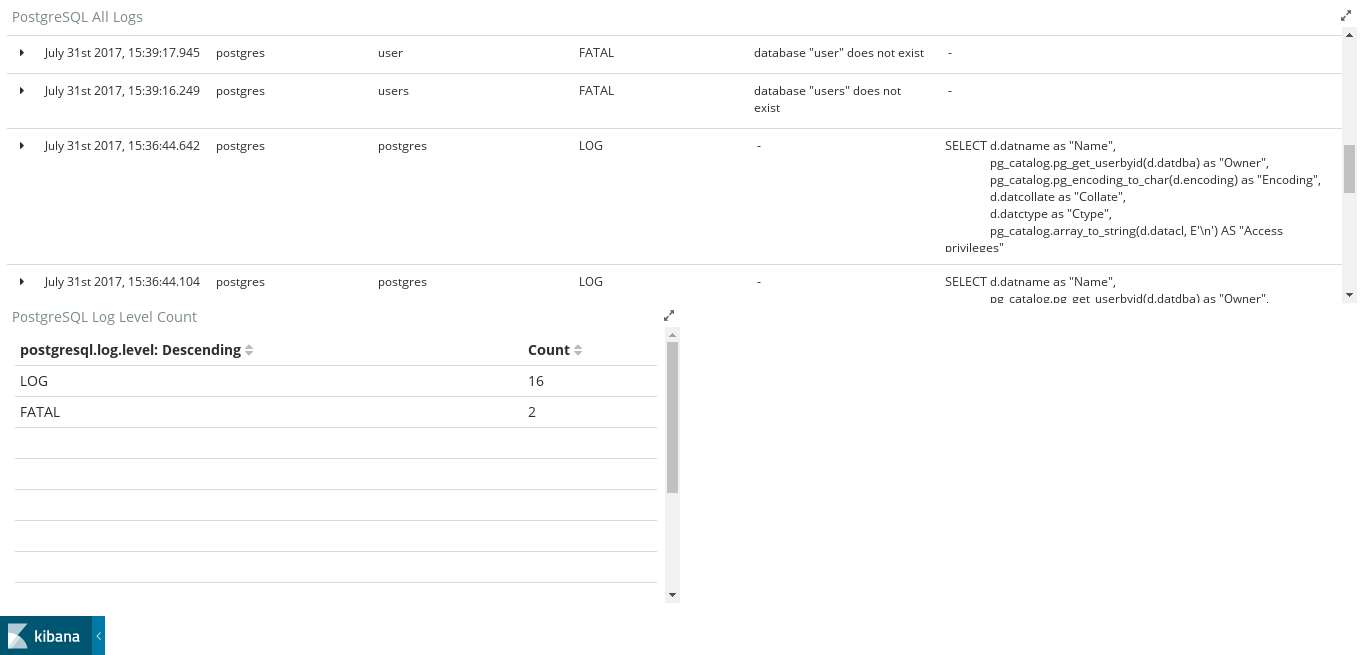
editThis module comes with two sample dashboards.
The first dashboard is for regular logs.
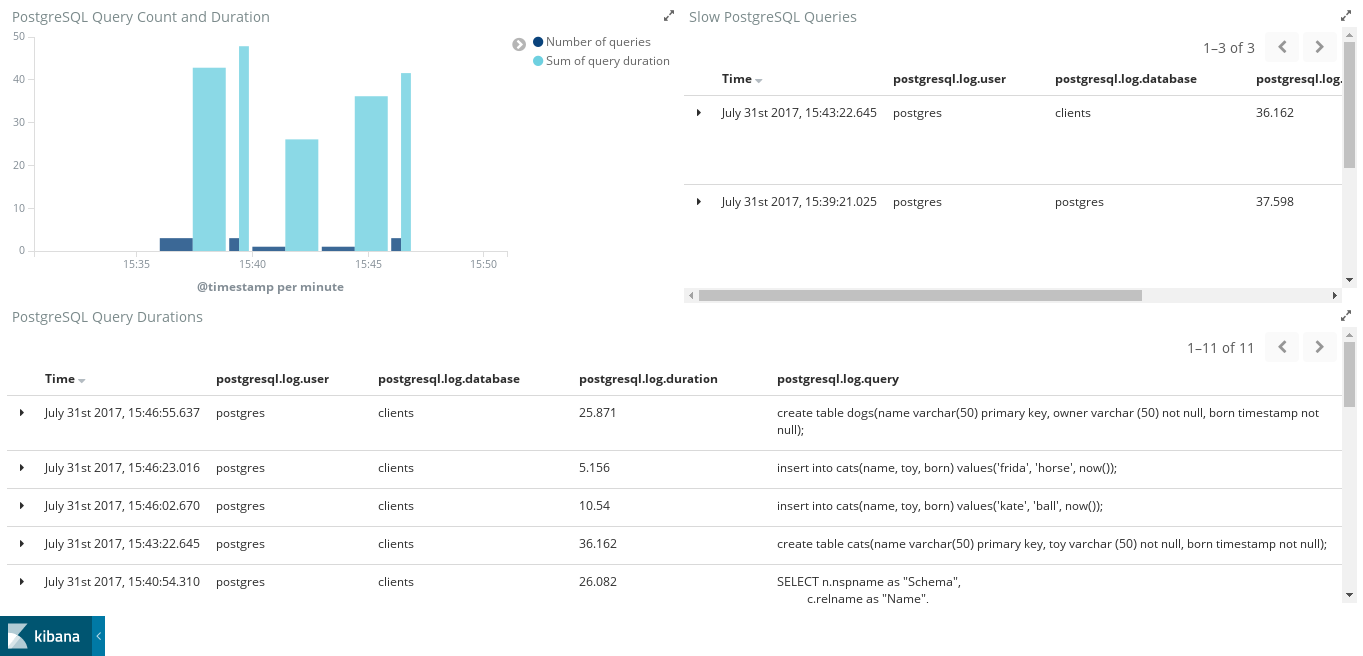
The second one shows the slowlogs of PostgreSQL. If log_min_duration_statement
is not used, this dashboard will show incomplete or no data.
Fields
editFor a description of each field in the module, see the exported fields section.