Step 7: View the sample Kibana dashboards
editStep 7: View the sample Kibana dashboards
editTo make it easier for you to explore Filebeat data in Kibana, we’ve created
example Filebeat dashboards. You loaded the dashboards earlier when you
ran the setup command.
To open the dashboards, launch the Kibana web interface by pointing your browser
to port 5601. For example, http://localhost:5601.
Replace localhost with the name of the Kibana host. If you’re using an
Elastic Cloud instance, log in to your cloud account,
then navigate to the Kibana endpoint in your deployment.
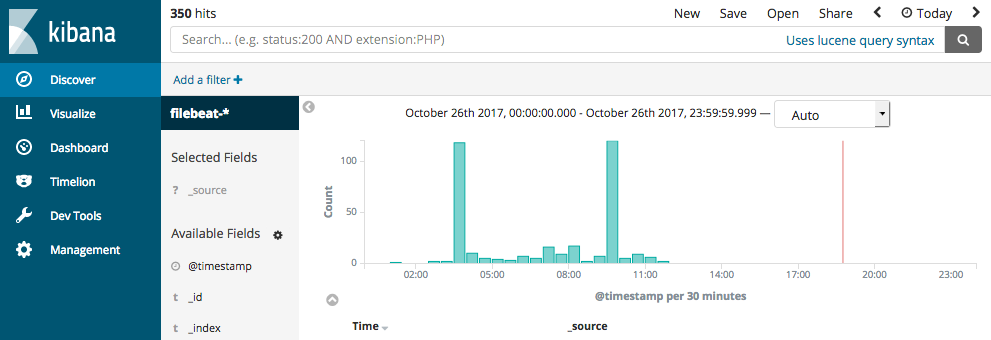
On the Discover page, make sure that the predefined filebeat-* index
pattern is selected to see Filebeat data.
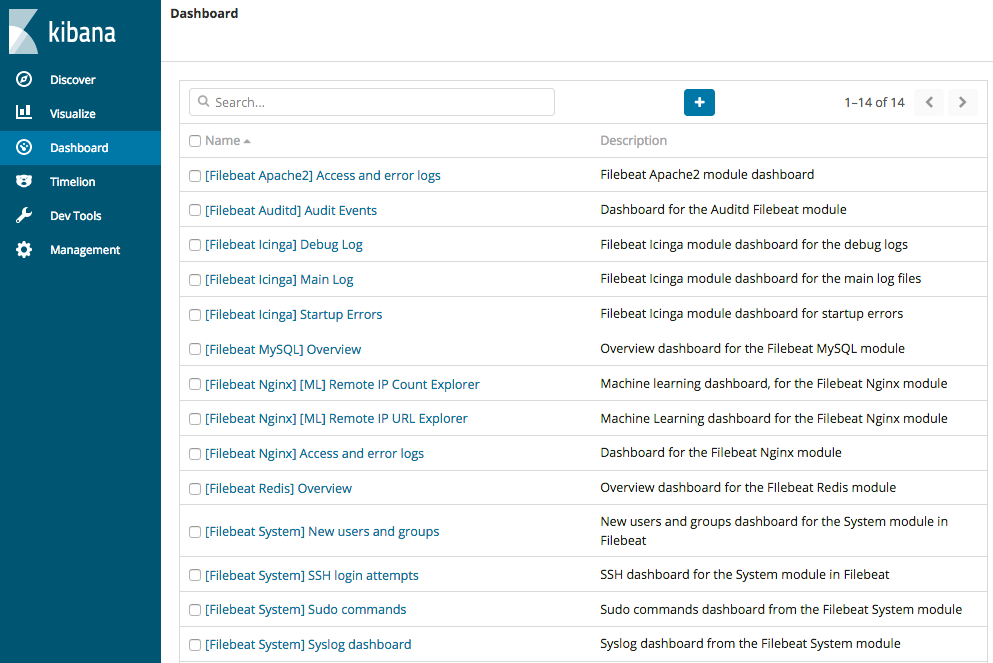
Go to the Dashboard page and select the dashboard that you want to open.
If you don’t see data in Kibana, try changing the date range to a larger range. By default, Kibana shows the last 15 minutes.
These dashboards are designed to work out-of-the box when you use Filebeat modules. However, you can also use them as examples and customize them to meet your needs even if you aren’t using Filebeat modules.
To populate the example dashboards with data, you need to either define ingest node pipelines or use Logstash to parse the data into the fields expected by the dashboards. If you are using Logstash, see the configuration examples in the Logstash documentation for help parsing the log formats supported by the dashboards.
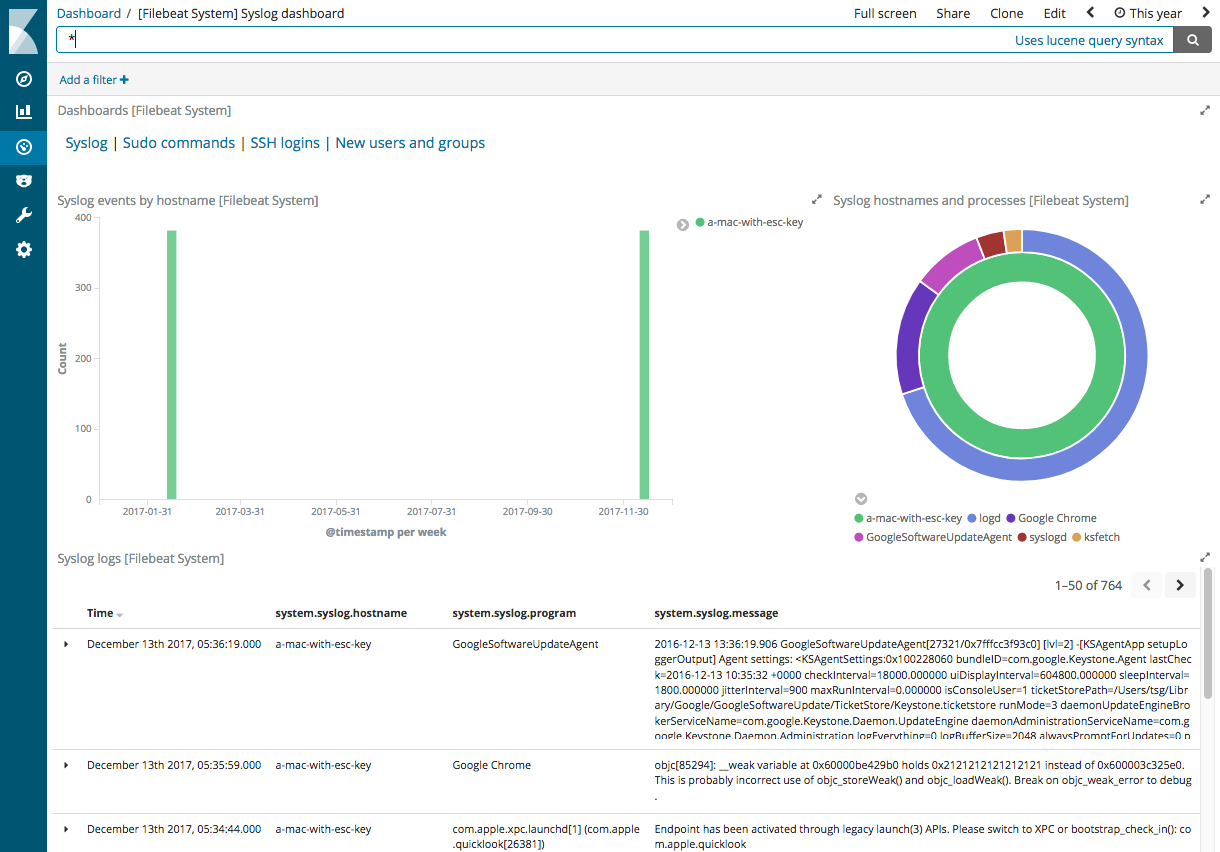
Here is an example of the Filebeat system dashboard: