WARNING: Version 6.1 of Filebeat has passed its EOL date.
This documentation is no longer being maintained and may be removed. If you are running this version, we strongly advise you to upgrade. For the latest information, see the current release documentation.
Quick start for common log formats
editQuick start for common log formats
editFilebeat provides a set of pre-built modules that you can use to rapidly implement and deploy a log monitoring solution, complete with sample dashboards and data visualizations, in about 5 minutes. These modules support common log formats, such as Nginx, Apache2, and MySQL, and can be run by issuing a simple command.
This topic shows you how to run the basic modules out of the box without extra configuration. For detailed documentation and the full list of available modules, see Modules.
If you are using a log file type that isn’t supported by one of the available Filebeat modules, you’ll need to set up and configure Filebeat manually by following the numbered steps under Getting Started With Filebeat.
Prerequisites
editBefore running Filebeat modules, you need to:
- Install and configure the Elastic stack. See Getting Started with Beats and the Elastic Stack.
- Complete the Filebeat installation instructions described in Step 1: Install Filebeat. After installing Filebeat, return to this quick start page.
-
Install the Ingest Node GeoIP and User Agent plugins. These plugins are required to capture the geographical location and browser information used by some of the visualizations available in the sample dashboards. You can install these plugins by running the following commands in the Elasticsearch home path:
sudo bin/elasticsearch-plugin install ingest-geoip
sudo bin/elasticsearch-plugin install ingest-user-agent
You need to restart Elasticsearch after running these commands.
If you are using an Elastic Cloud instance, you can enable the two plugins from the configuration page.
- Verify that Elasticsearch and Kibana are running and that Elasticsearch is ready to receive data from Filebeat.
Running Filebeat modules
editTo set up and run Filebeat modules:
-
If you’ve secured Elasticsearch and Kibana, you need to specify credentials in the config file before you run the commands that set up and start Filebeat. For example:
output.elasticsearch:
  hosts: ["myEShost:9200"]
  username: "elastic"
  password: "elastic"
setup.kibana:
  host: "mykibanahost:5601"
  username: "elastic"
  password: "elastic"
The
usernameandpasswordsettings for Kibana are optional. If you don’t specify credentials for Kibana, Filebeat uses theusernameandpasswordspecified for the Elasticsearch output.Also see the security-related options described in Set up the Kibana endpoint and Configure the Elasticsearch output.
-
Run the
setupcommand to set up the initial environment. This command loads the recommended index template for writing to Elasticsearch and deploys the sample dashboards for visualizing the data in Kibana. For example:./filebeat setup -e
The
-eflag is optional and sends output to standard error instead of syslog. -
Start Filebeat and use the
--modulesflag to specify a comma-separated list of modules you want to run. The following example starts Filebeat with thesystemmodule enabled (it’s assumed that you’ve already loaded the sample dashboards):./filebeat -e --modules system
This command takes care of configuring Filebeat and loading the ingest node pipelines and other configuration settings required to parse the log files.
To run more than one module, specify a comma-separated list of modules. For example:
./filebeat -e --modules system,nginx,mysql
When you start Filebeat, you should see messages indicating that Filebeat has started harvesters for all enabled modules. For example:
2017/08/16 23:39:15.414375 harvester.go:206: INFO Harvester started for file: /var/log/displaypolicyd.stdout.log
If you don’t see this message for each log file that needs to be read, see Set the path variable to find out how to set the path the files.
Depending on how you’ve installed Filebeat, you might see errors related to file ownership or permissions when you try to run Filebeat modules. See Config File Ownership and Permissions in the Beats Platform Reference if you encounter errors related to file ownership or permissions.
This getting started guide uses the --modules flag to enable modules
at the command line when you run Filebeat. In a production environment, you’ll
probably want to use the configs in the modules.d directory instead. See
Specify which modules to run for more information.
Set the path variable
editThe examples here assume that the logs you’re harvesting are in the location expected for your OS and that the default behavior of Filebeat is appropriate for your environment. Each module provides variables that you can set to fine tune the behavior of Filebeat, including the location where it looks for log files. For example, the following command sets the path for the Nginx access logs:
./filebeat -e --modules nginx -M "nginx.access.var.paths=[/var/log/nginx/access.log*]"
See Specify which modules to run for more information about setting variables and advanced options.
Visualize the data in Kibana
editAfter you’ve confirmed that Filebeat is sending events to Elasticsearch, launch the Kibana web interface by pointing your browser to port 5601. For example, http://127.0.0.1:5601.
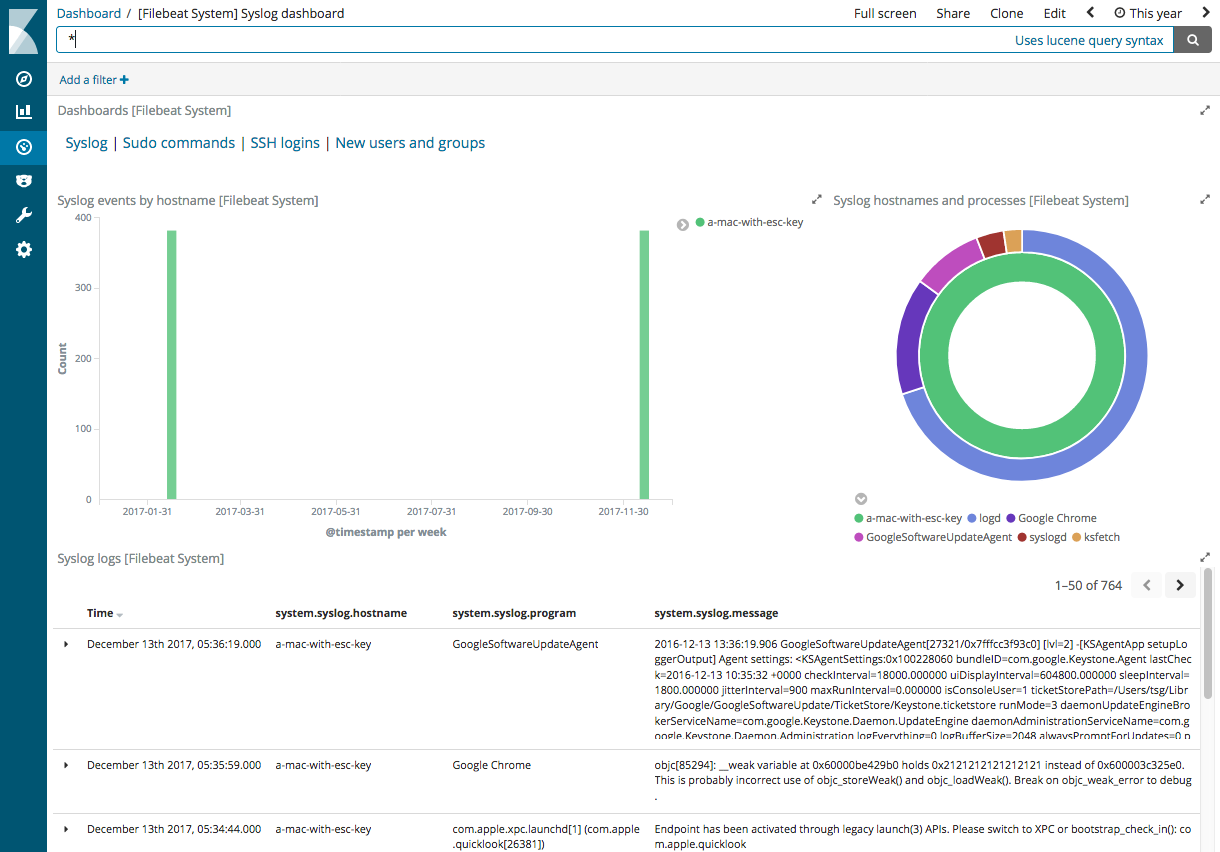
Open the dashboard and explore the visualizations for your parsed logs.
If you don’t see data in Kibana, try changing the date range to a larger range. By default, Kibana shows the last 15 minutes.
Here’s an example of the syslog dashboard: