Collect metricsedit
When collecting metrics, please note that the DoubleValueRecorder
and LongValueRecorder metrics are not yet supported.
Here’s an example of how to capture business metrics from a Java application.
// initialize metric
Meter meter = GlobalMetricsProvider.getMeter("my-frontend");
DoubleCounter orderValueCounter = meter.doubleCounterBuilder("order_value").build();

public void createOrder(HttpServletRequest request) {

   // create order in the database
   ...
   // increment business metrics for monitoring
   orderValueCounter.add(orderPrice);
}
See the Open Telemetry Metrics API for more information.
Verify OpenTelemetry metrics dataedit
Use Discover to validate that metrics are successfully reported to Kibana.
-
Launch Kibana:
- Log in to your Elastic Cloud account.
- Navigate to the Kibana endpoint in your deployment.
Point your browser to http://localhost:5601, replacing
localhostwith the name of the Kibana host. - Open the main menu, then click Discover.
-
Select
apm-*as your index pattern. -
Filter the data to only show documents with metrics:
processor.name :"metric" -
Narrow your search with a known OpenTelemetry field. For example, if you have an
order_valuefield, addorder_value: *to your search to return only OpenTelemetry metrics documents.
Visualize in Kibanaedit
TSVB within Kibana is the recommended visualization for OpenTelemetry metrics. TSVB is a time series data visualizer that allows you to use the Elasticsearch aggregation framework’s full power. With TSVB, you can combine an infinite number of aggregations to display complex data.
In this example eCommerce OpenTelemetry dashboard, there are four visualizations: sales, order count, product cache, and system load. The dashboard provides us with business KPI metrics, along with performance-related metrics.
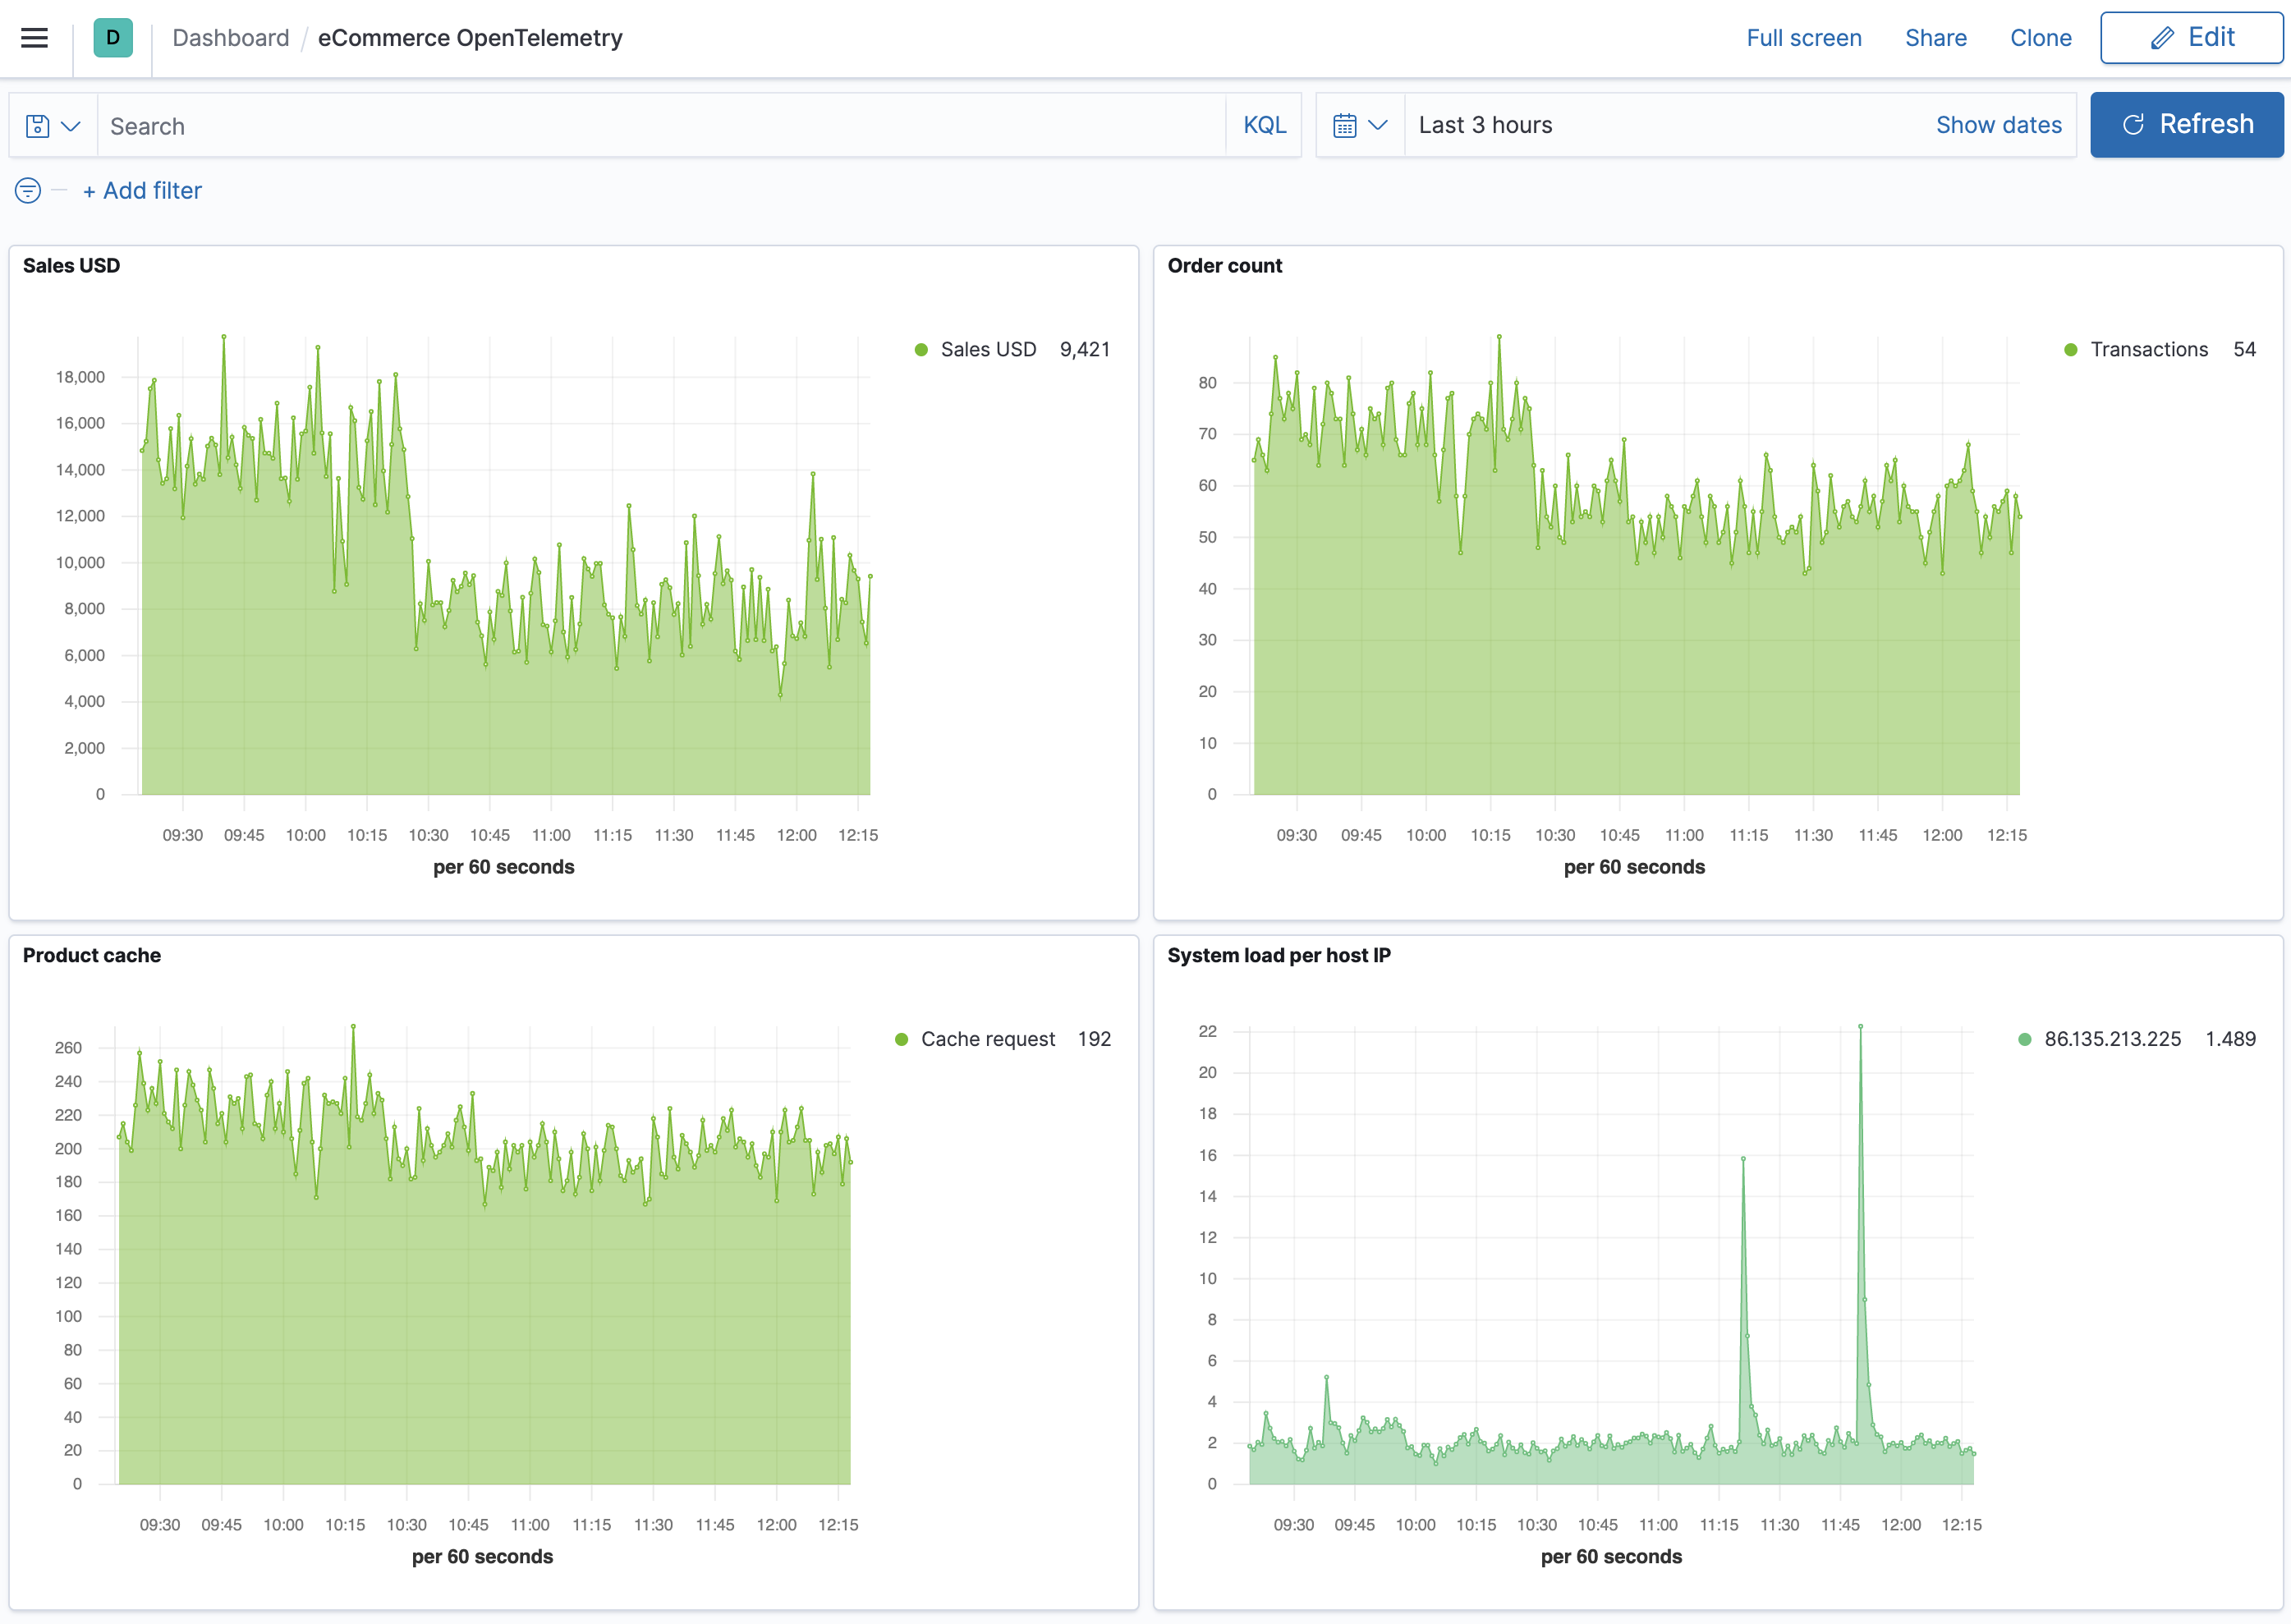
Let’s look at how this dashboard was created, specifically the Sales USD and System load visualizations.
- Open the main menu, then click Dashboard.
- Click Create dashboard.
- Click Save, enter the name of your dashboard, and then click Save again.
- Let’s add a Sales USD visualization. Click Edit.
- Click Create new and then select TSVB.
-
For the label name, enter Sales USD, and then select the following:
-
Aggregation:
Counter Rate. -
Field:
order_sum. -
Scale:
auto. -
Group by:
Everything
-
Aggregation:
- Click Save, enter Sales USD as the visualization name, and then click Save and return.
- Now let’s create a visualization of load averages on the system. Click Create new.
- Select TSVB.
-
Select the following:
-
Aggregation:
Average. -
Field:
system.cpu.load_average.1m. -
Group by:
Terms. -
By:
host.ip. -
Top:
10. -
Order by:
Doc Count (default). -
Direction:
Descending.
-
Aggregation:
-
Click Save, enter System load per host IP as the visualization name, and then click Save and return.
Both visualizations are now displayed on your custom dashboard.
By default, Discover shows data for the last 15 minutes. If you have a time-based index and no data displays, you might need to increase the time range.