Interpreting CI Failures
editInterpreting CI Failures
editKibana CI uses a Jenkins feature called "Pipelines" to automate testing of the code in pull requests and on tracked branches. Pipelines are defined within the repository via the Jenkinsfile at the root of the project.
More information about Jenkins Pipelines can be found in the Jenkins book.
Github Checks
editWhen a test fails it will be reported to Github via Github Checks. We currently bucket tests into several categories which run in parallel to make CI faster. Groups like ciGroup{X} get a single check in Github, and other tests like linting, or type checks, get their own checks.
Clicking the link next to the check in the conversation tab of a pull request will take you to the log output from that section of the tests. If that log output is truncated, or doesn’t clearly identify what happened, you can usually get more complete information by visiting Jenkins directly.
Viewing Job Executions in Jenkins
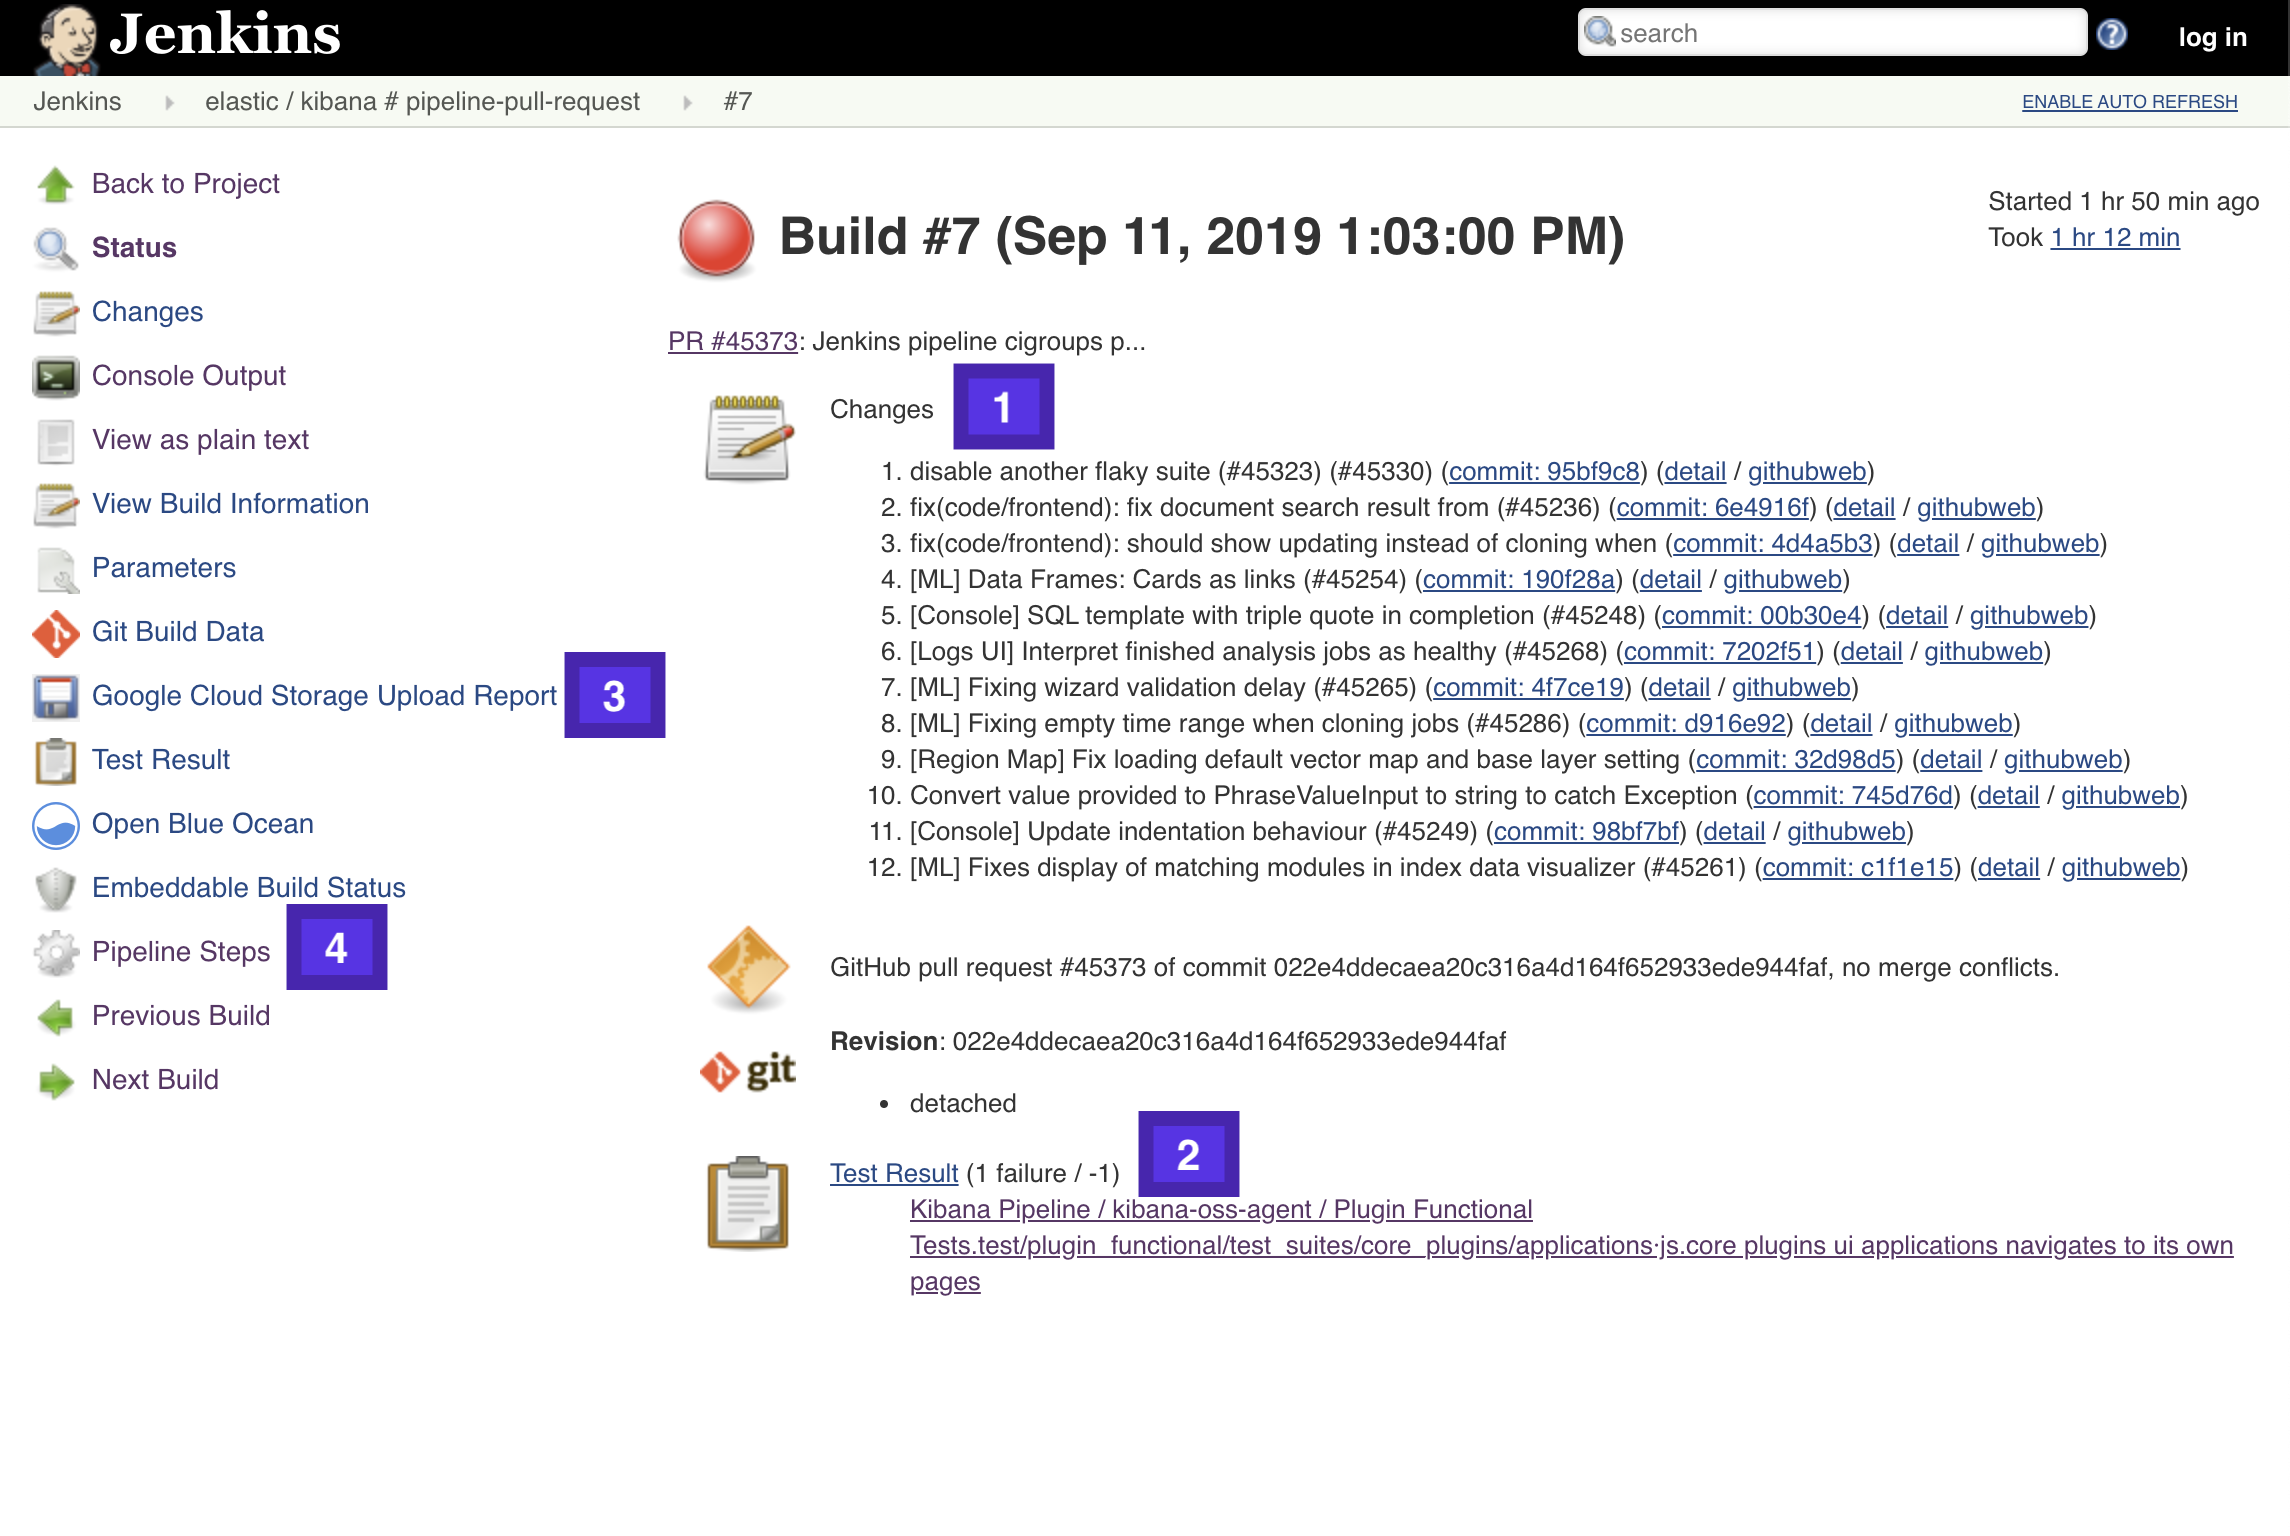
editTo view the results of a job execution in Jenkins, either click the link in the comment left by @elasticmachine or search for the kibana-ci check in the list at the bottom of the PR. This link will take you to the top-level page for the specific job execution that failed.

- Git Changes: the list of commits that were in this build which weren’t in the previous build. For Pull Requests this list is calculated by comparing against the most recent Pull Request which was tested, it is not limited to build for this specific Pull Request, so it’s not very useful.
- Test Results: A link to the test results screen, and shortcuts to the failed tests. Functional tests capture and store the log output from each specific test, and make it visible at these links. For other test runners only the error message is visible and log output must be tracked down in the Pipeline Steps.
- Google Cloud Storage (GCS) Upload Report: Link to the screen which lists out the artifacts uploaded to GCS during this job execution.
- Pipeline Steps:: A breakdown of the pipline that was executed, along with individual log output for each step in the pipeline.
Viewing ciGroup/test Logs
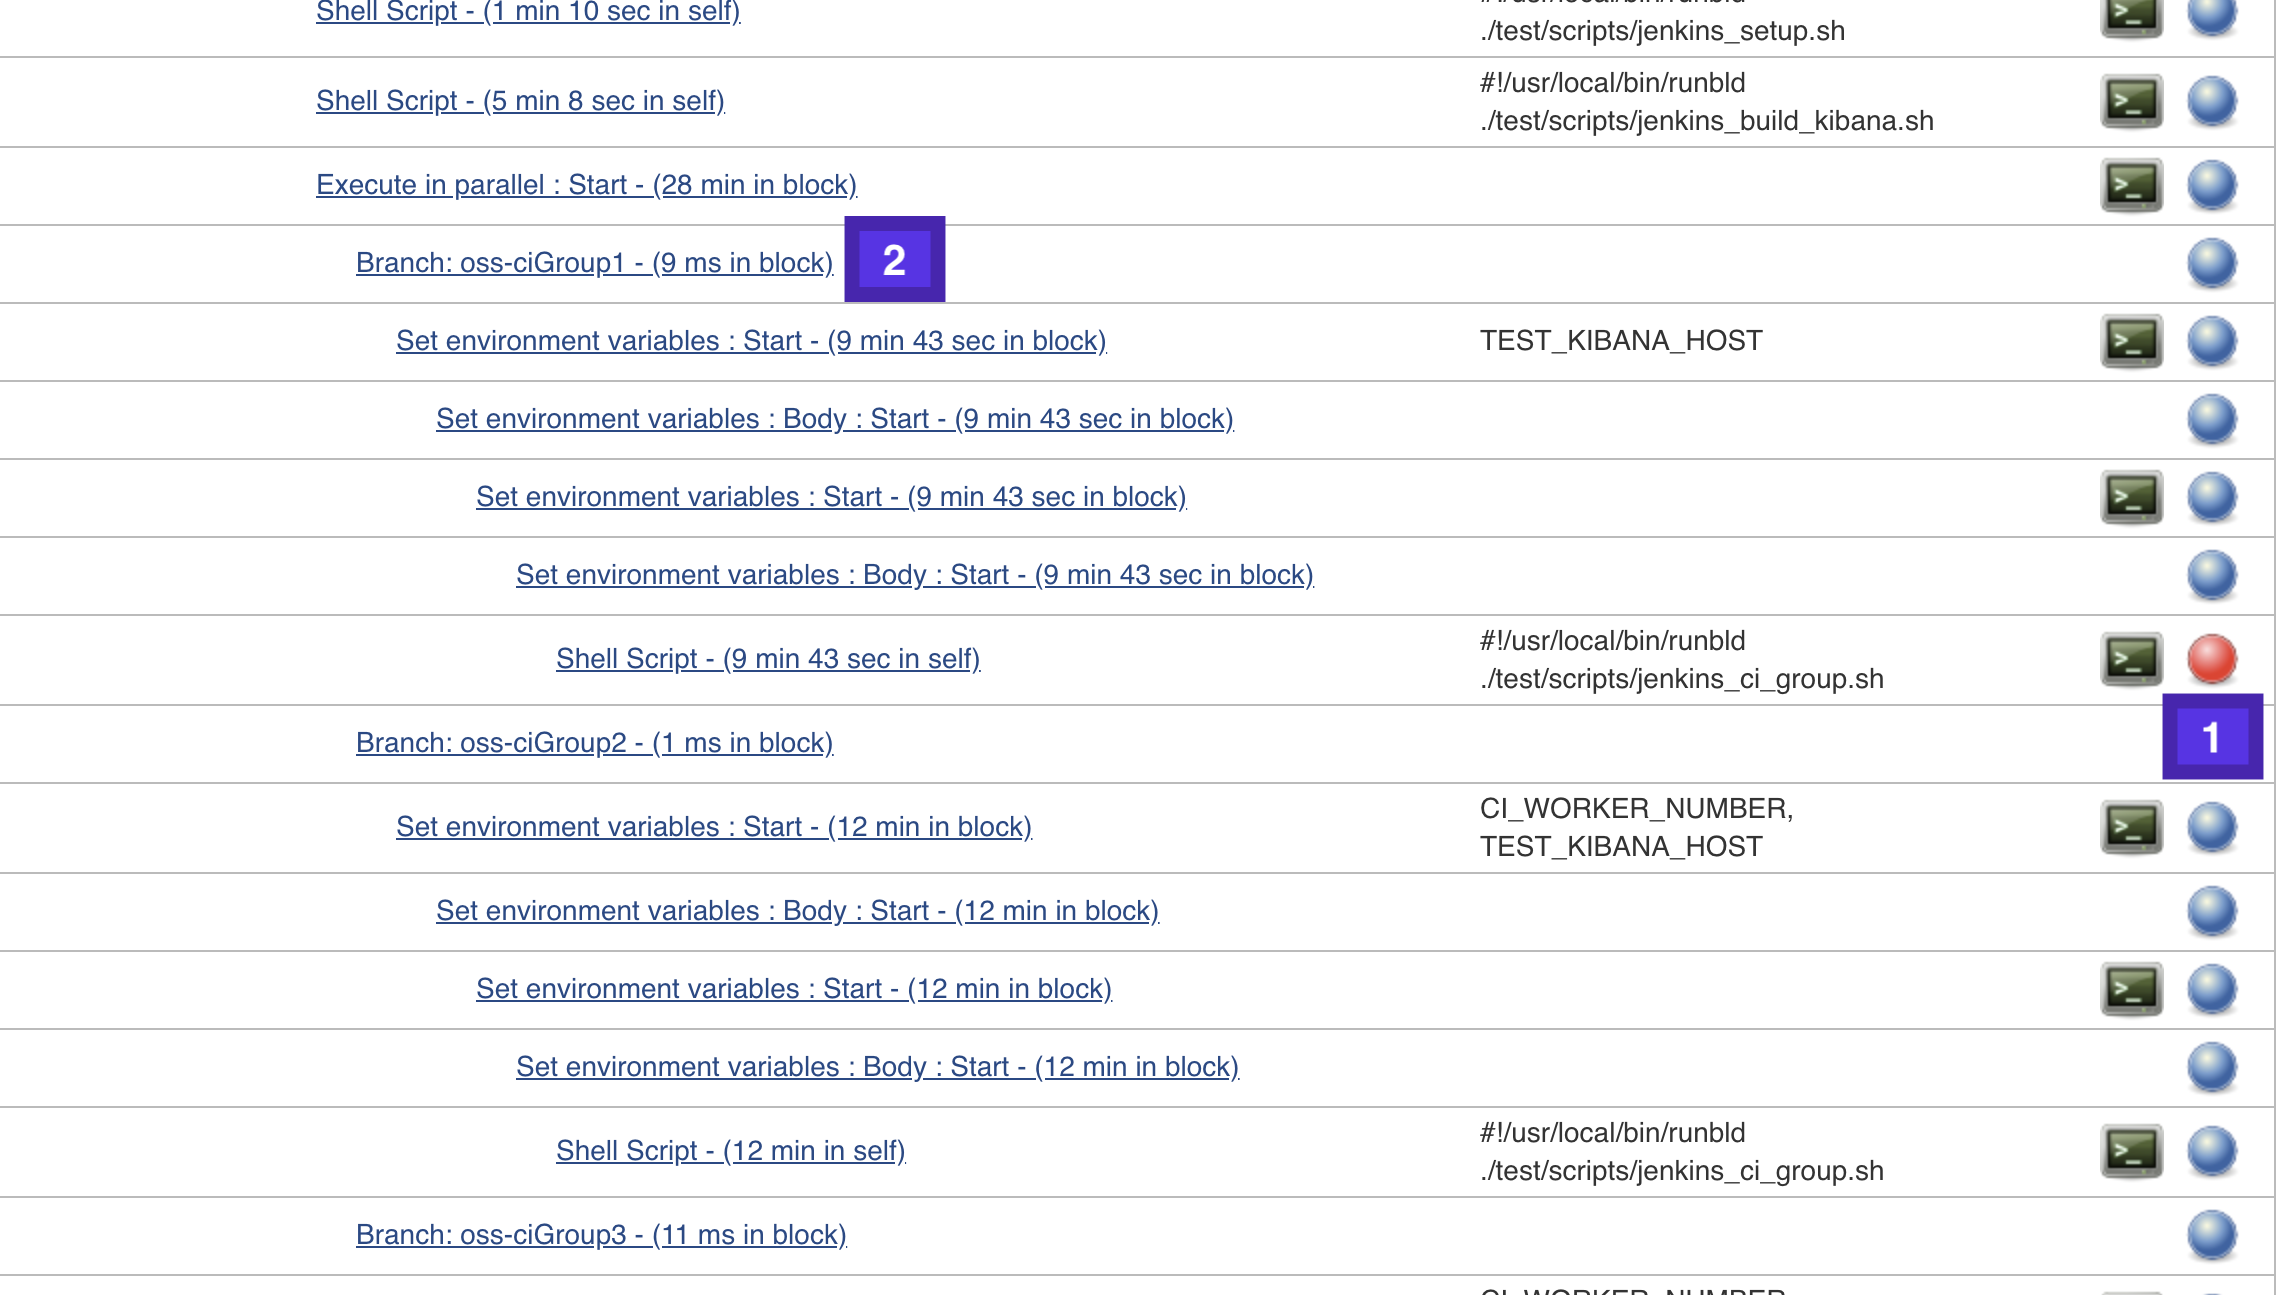
editTo view the logs for a failed specific ciGroup, jest, mocha, type checkers, linters, etc., click on the Pipeline Steps link in from the Job page.

Scroll down the page until you find a failed step (1), and then look up a few lines for the Branch: step to see which specific job this is. If this is the job you’re looking for click the little terminal icon next to the failed step (1) to view the logs for that specific step in the Pipeline.