WARNING: Version 5.4 of Kibana has passed its EOL date.
This documentation is no longer being maintained and may be removed. If you are running this version, we strongly advise you to upgrade. For the latest information, see the current release documentation.
Creating time series visualizations
editCreating time series visualizations
editThis tutorial will be using the time series data from Metricbeat to walk you through a number of functions that Timelion offers. To get started, download Metricbeat and follow the instructions here to start ingesting the data locally.
The first visualization you’ll create will compare the real-time percentage of CPU time spent in user space to the results offset by one hour. In order to create this visualization, we’ll need to create two Timelion expressions. One with the real-time average of system.cpu.user.pct and another with the average offset by one hour.
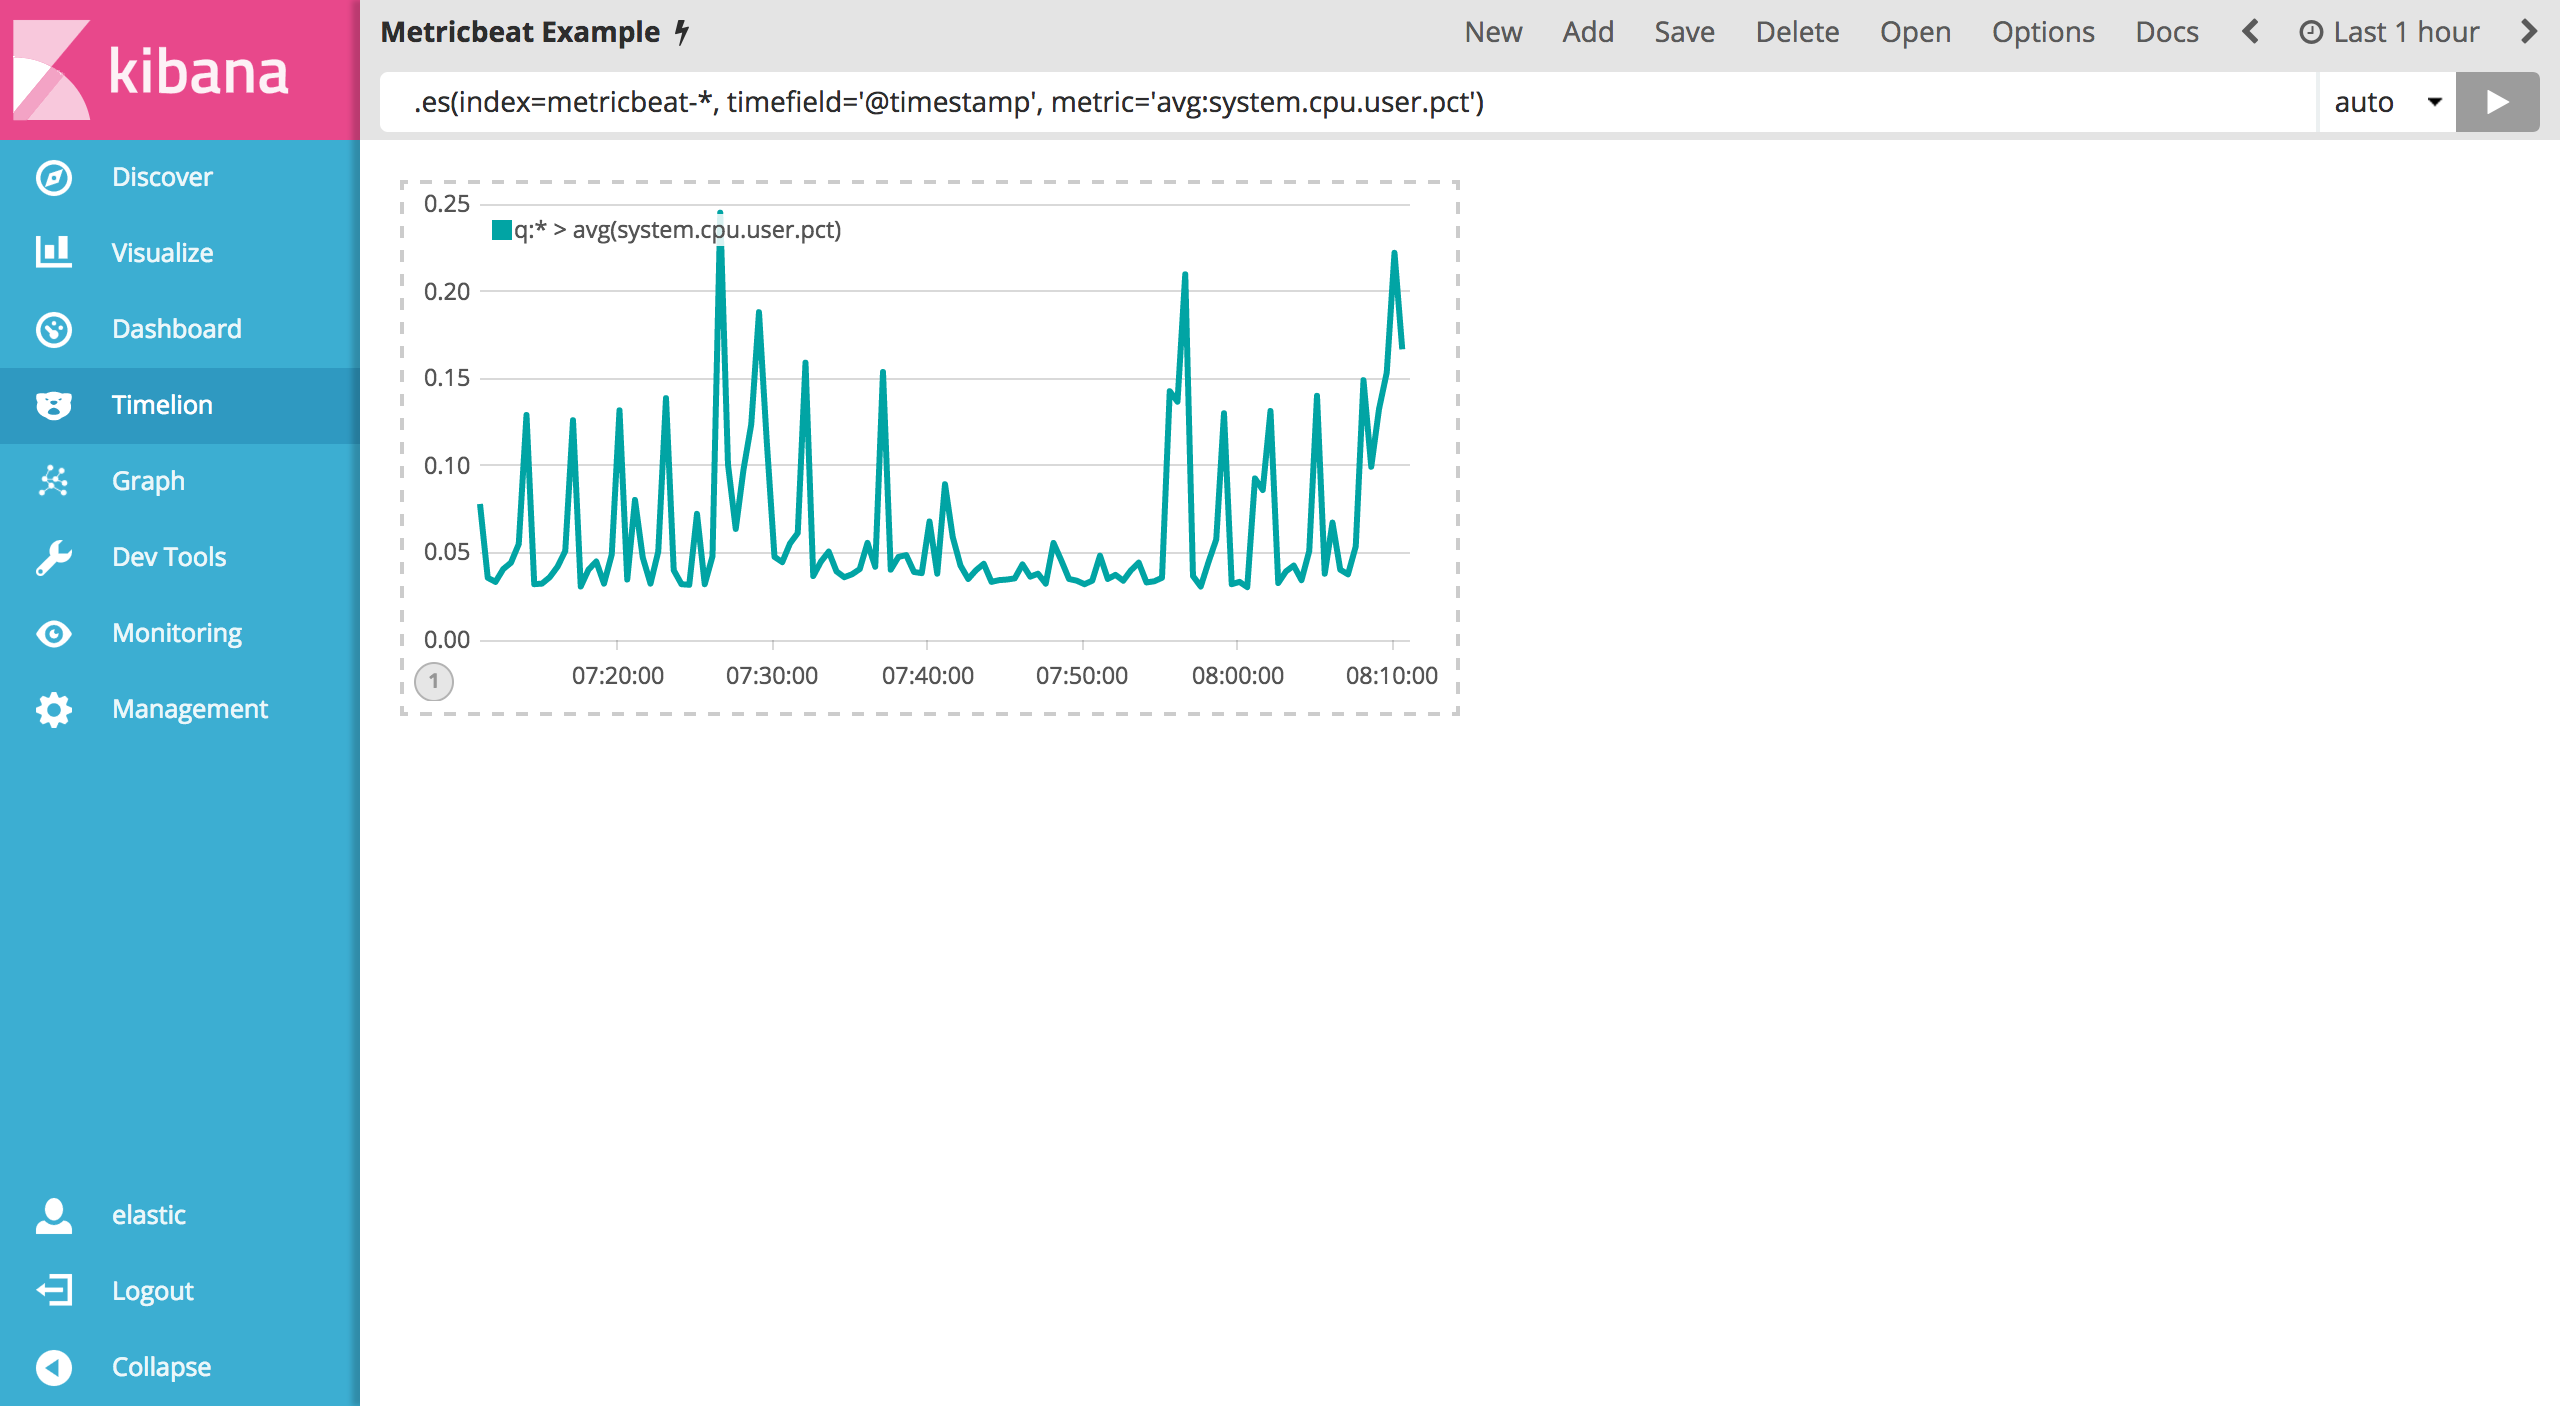
To start, you will need to define an index, timefield and metric in the first expression. Go ahead and enter the below expression into the Timelion query bar.
.es(index=metricbeat-*, timefield='@timestamp', metric='avg:system.cpu.user.pct')

Now you need to add another series with data from the previous hour for comparison. To do so, you’ll have to add an offset arguement to the .es() function. offset will offset the series retrieval by a date expression. For this example, you’ll want to offset the data back one hour and will be using the date expression -1h. Using a comma to separate the two series, enter the following expression into the Timelion query bar:
.es(index=metricbeat-*, timefield='@timestamp', metric='avg:system.cpu.user.pct'), .es(offset=-1h,index=metricbeat-*, timefield='@timestamp', metric='avg:system.cpu.user.pct')

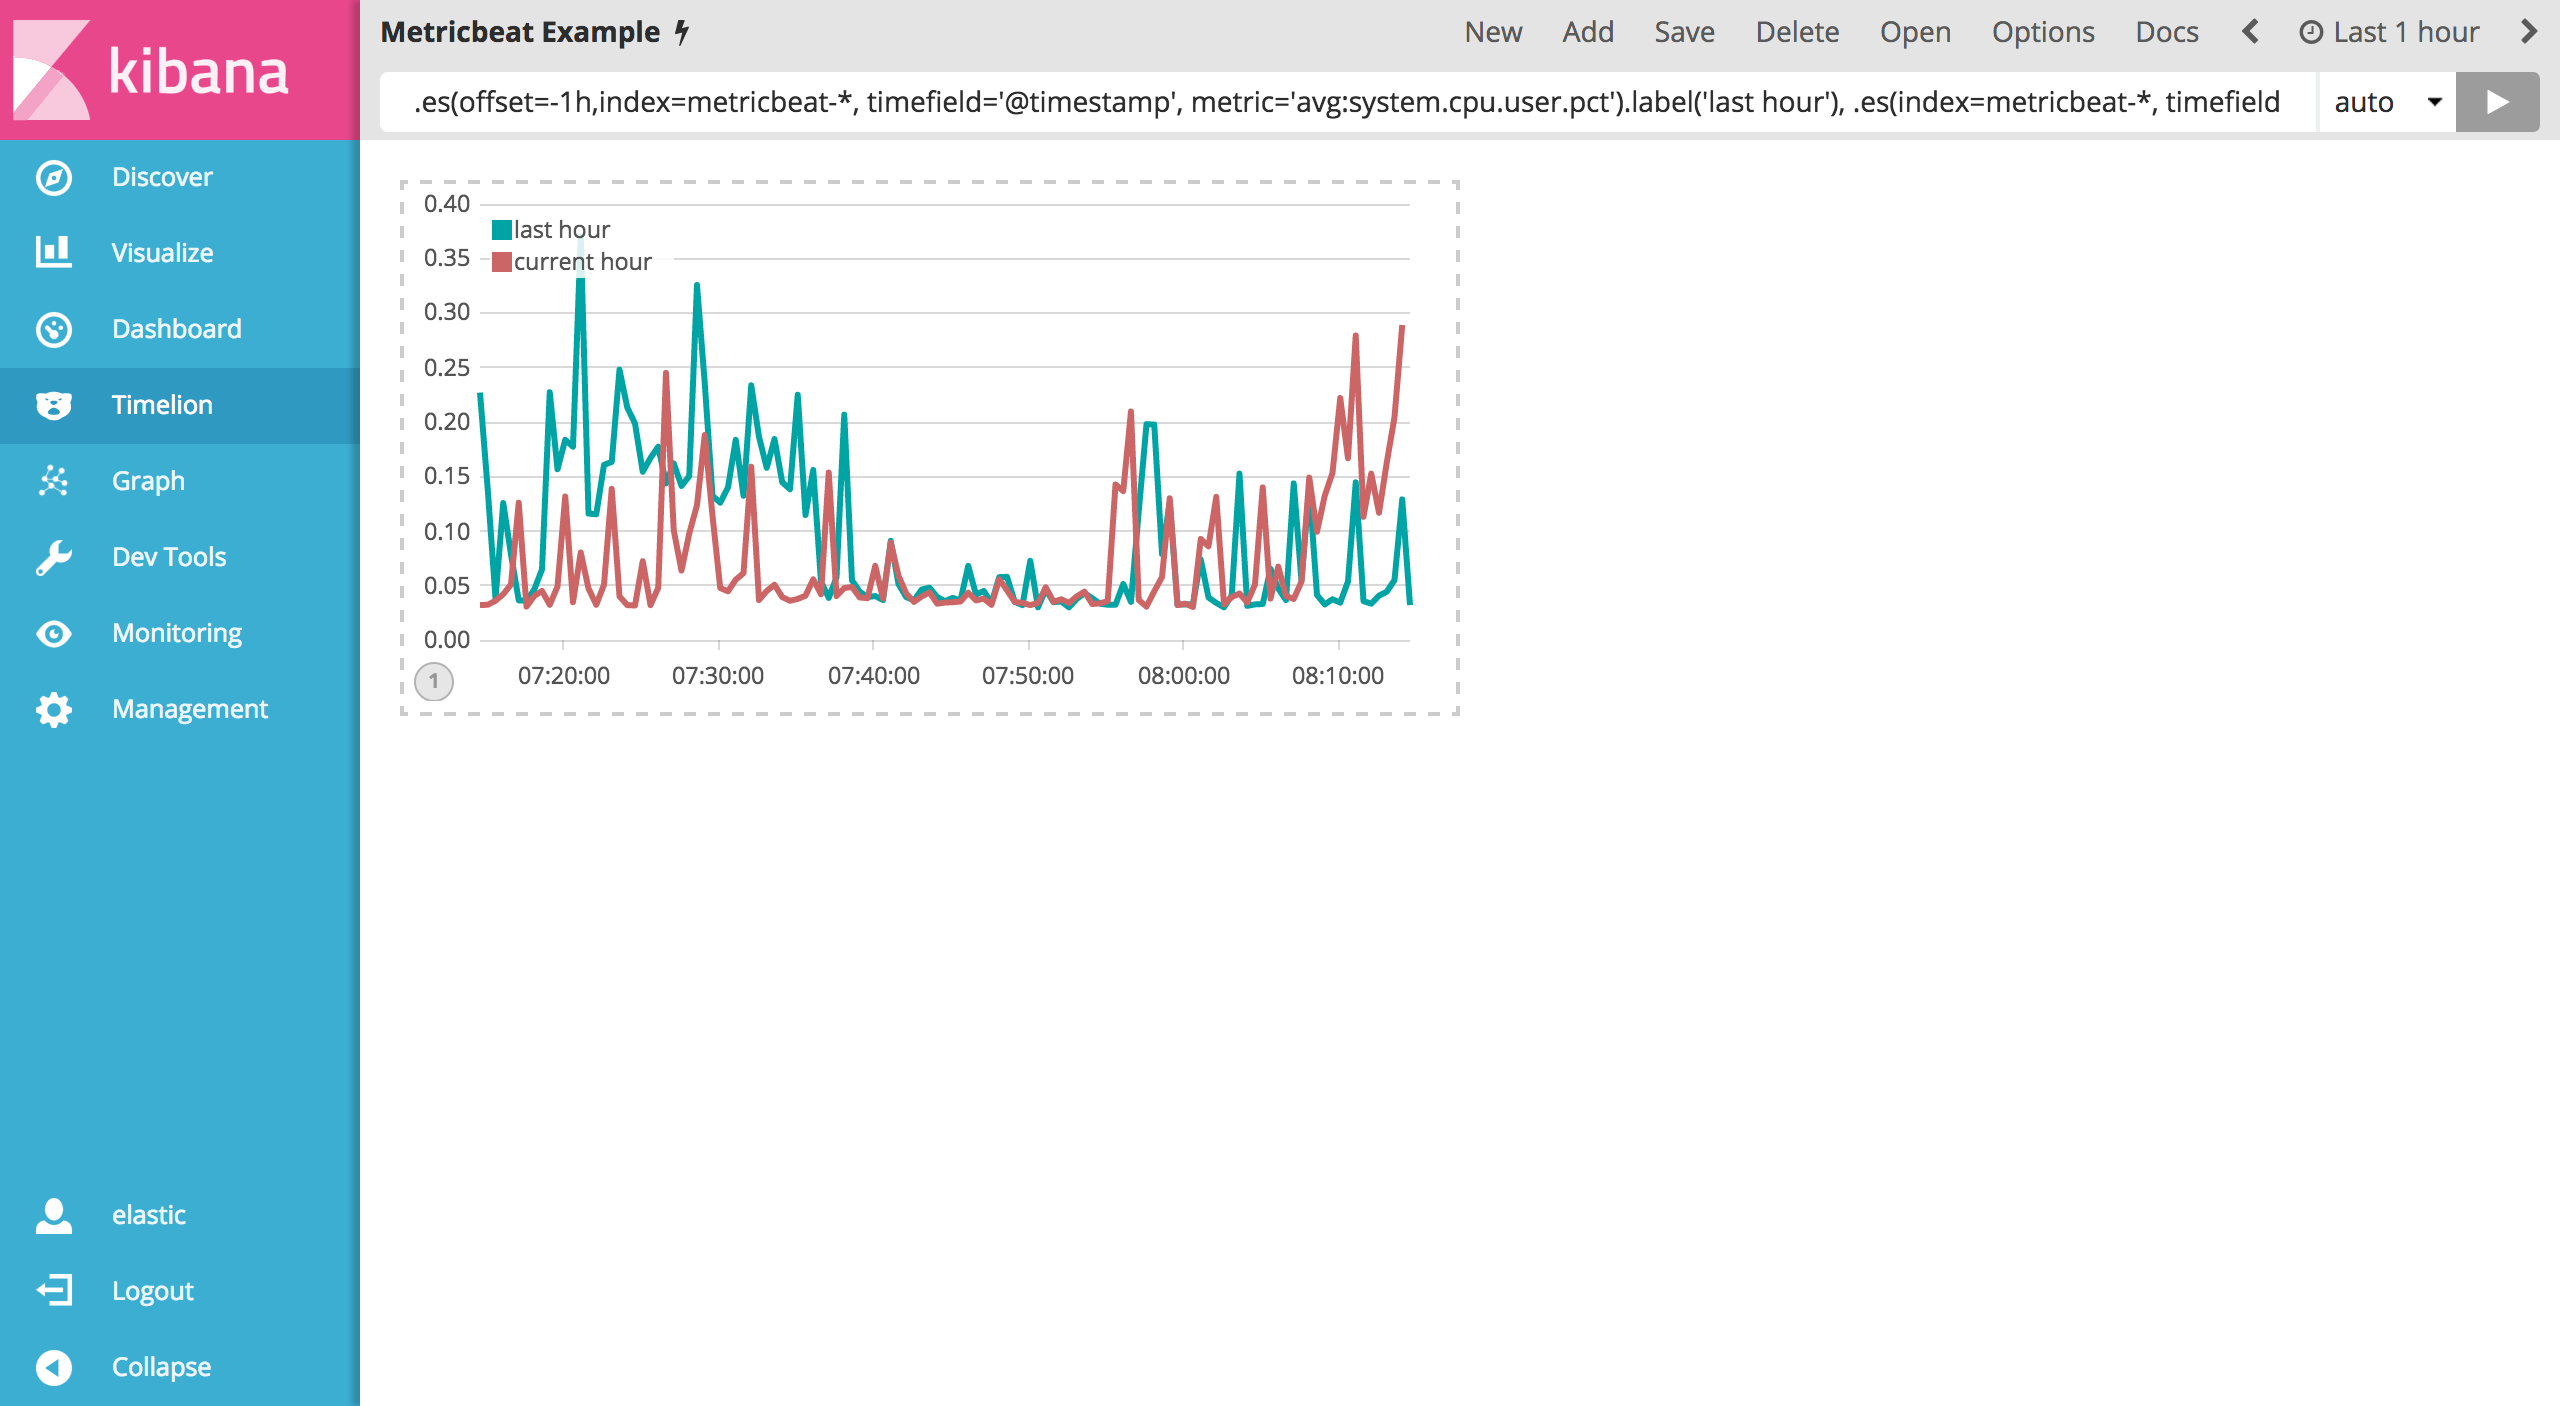
It’s a bit hard to differentiate the two series. Customize the labels in order to easily distinguish them. You can always append the .label() function to any expression to add a custom label. Enter the below expression into the Timelion query bar to customize your labels:
.es(offset=-1h,index=metricbeat-*, timefield='@timestamp', metric='avg:system.cpu.user.pct').label('last hour'), .es(index=metricbeat-*, timefield='@timestamp', metric='avg:system.cpu.user.pct').label('current hour')

Save the entire Timelion sheet as Metricbeat Example. As a best practice, you should be saving any significant changes made to this sheet as you progress through this tutorial.