Data Quality dashboard
editData Quality dashboard
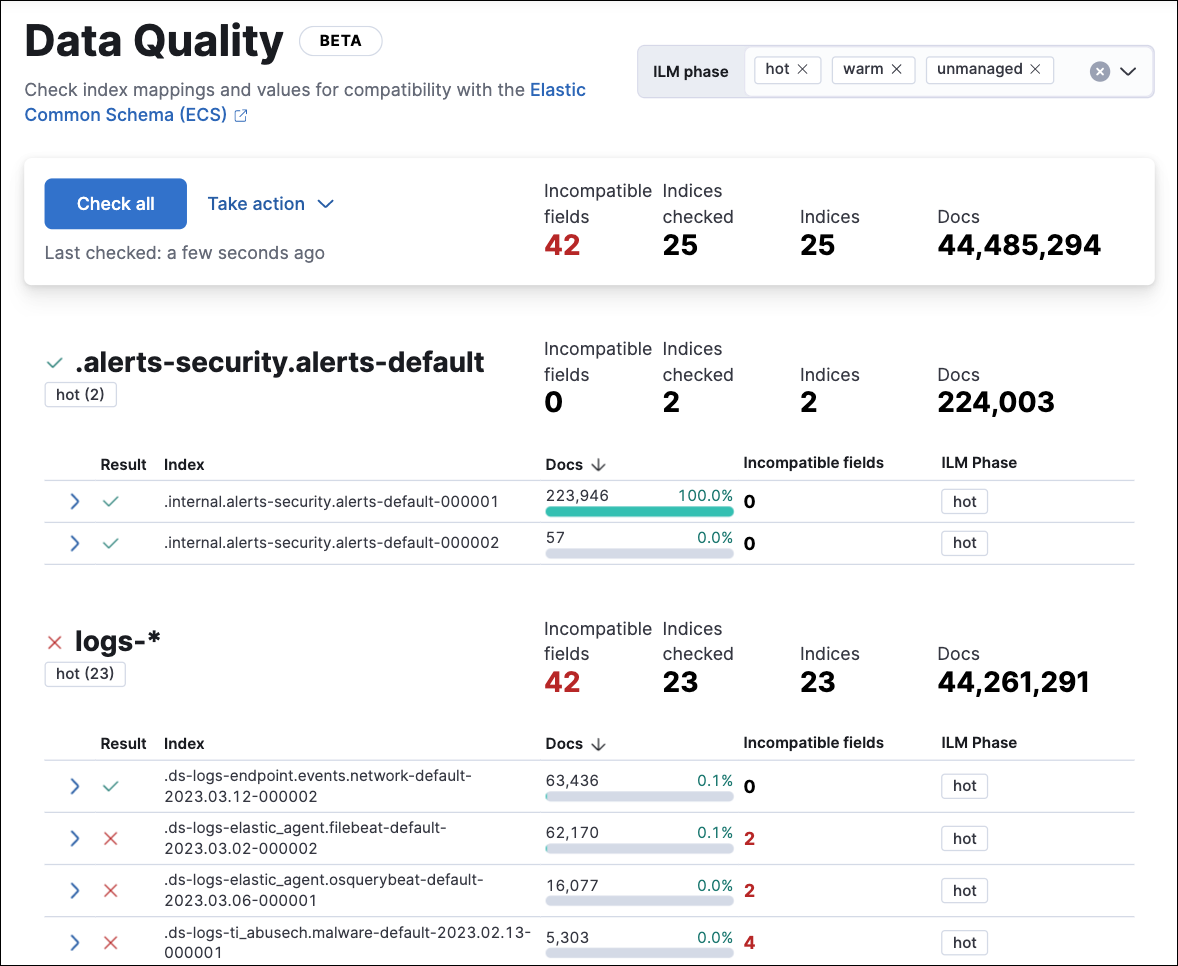
editThe Data Quality dashboard shows you whether your data is correctly mapped to the Elastic Common Schema (ECS). Successful mapping enables you to search, visualize, and interact with your data throughout Elastic Security and Kibana.
Use the Data Quality dashboard to:
- Check one or multiple indices for unsuccessful mappings, to help you identify problems (the indices used by Elastic Security appear by default).
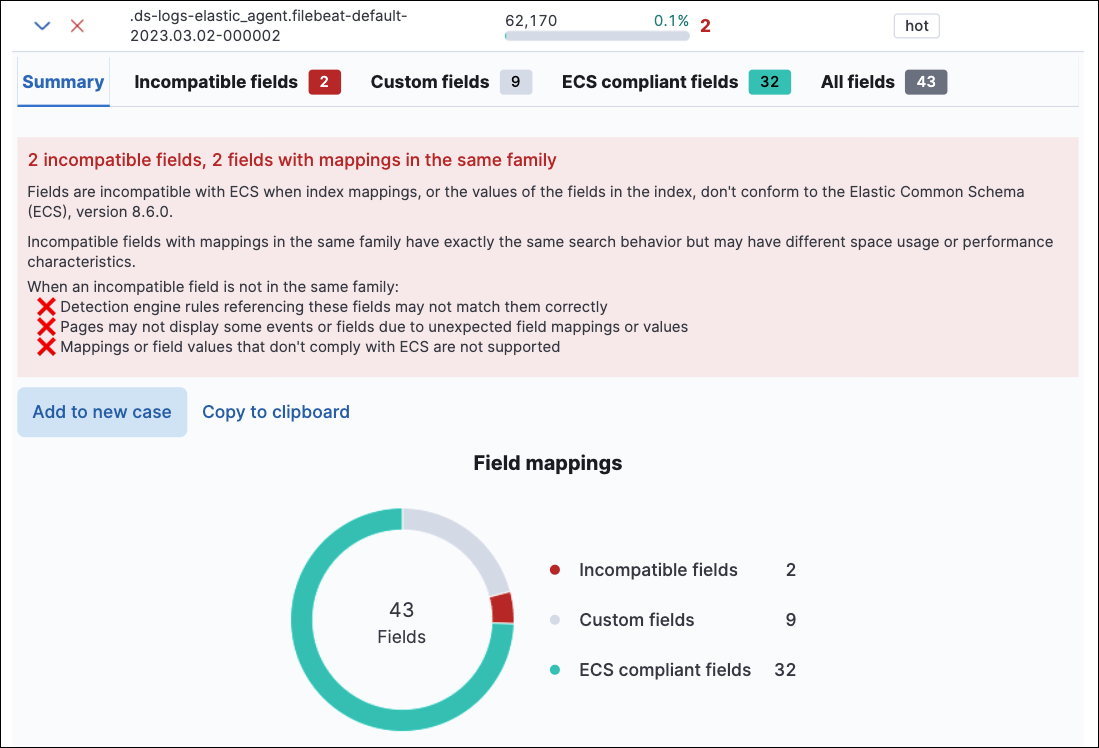
- View detailed information about the fields in checked indices.
- Track unsuccessful mappings by creating a case or Markdown report based on data quality results.
The Data Quality dashboard doesn’t show data from cold or frozen data tiers. It also doesn’t display data from remote clusters using cross-cluster search. To view data from another cluster, log in to that cluster’s Kibana instance.
Check indices
editWhen you open the dashboard, data does not appear until you select indices to check.
- Check multiple indices: To check all indices in the current data view, click Check all at the top of the dashboard. A progress indicator will appear.
To customize which indices are checked when you click Check all, change the current data view.
- Check a single index: To check a single index, expand it using the arrow on the left. Checking a single index is faster than checking all indices.
Learn more about checked index fields
editAfter an index is checked, an X (❌) or a checkmark (✅) appears in its Result column. The X (❌) indicates mapping problems in an index. To view index details, including which fields weren’t successfully mapped, click the arrow next to the result.
Track unsuccessful mappings
editYou can share data quality results to help track your team’s remediation tasks. First, follow the instructions under Check indices to generate results, then either:
Share results for all indices in the current data view:
- Click Take action at the top of the dashboard.
- Select Add to new case to open a new case, or click Copy to clipboard to copy a Markdown report to your clipboard.
Share results for one index:
- Expand an index by clicking the arrow to the left of its Result.
- From the Summary or Incompatible fields tabs, select Add to new case to open a new case, or click Copy to clipboard to copy a Markdown report to your clipboard.
For more information about how to fix mapping problems, refer to mapping.