Detection & Response dashboard
editDetection & Response dashboard
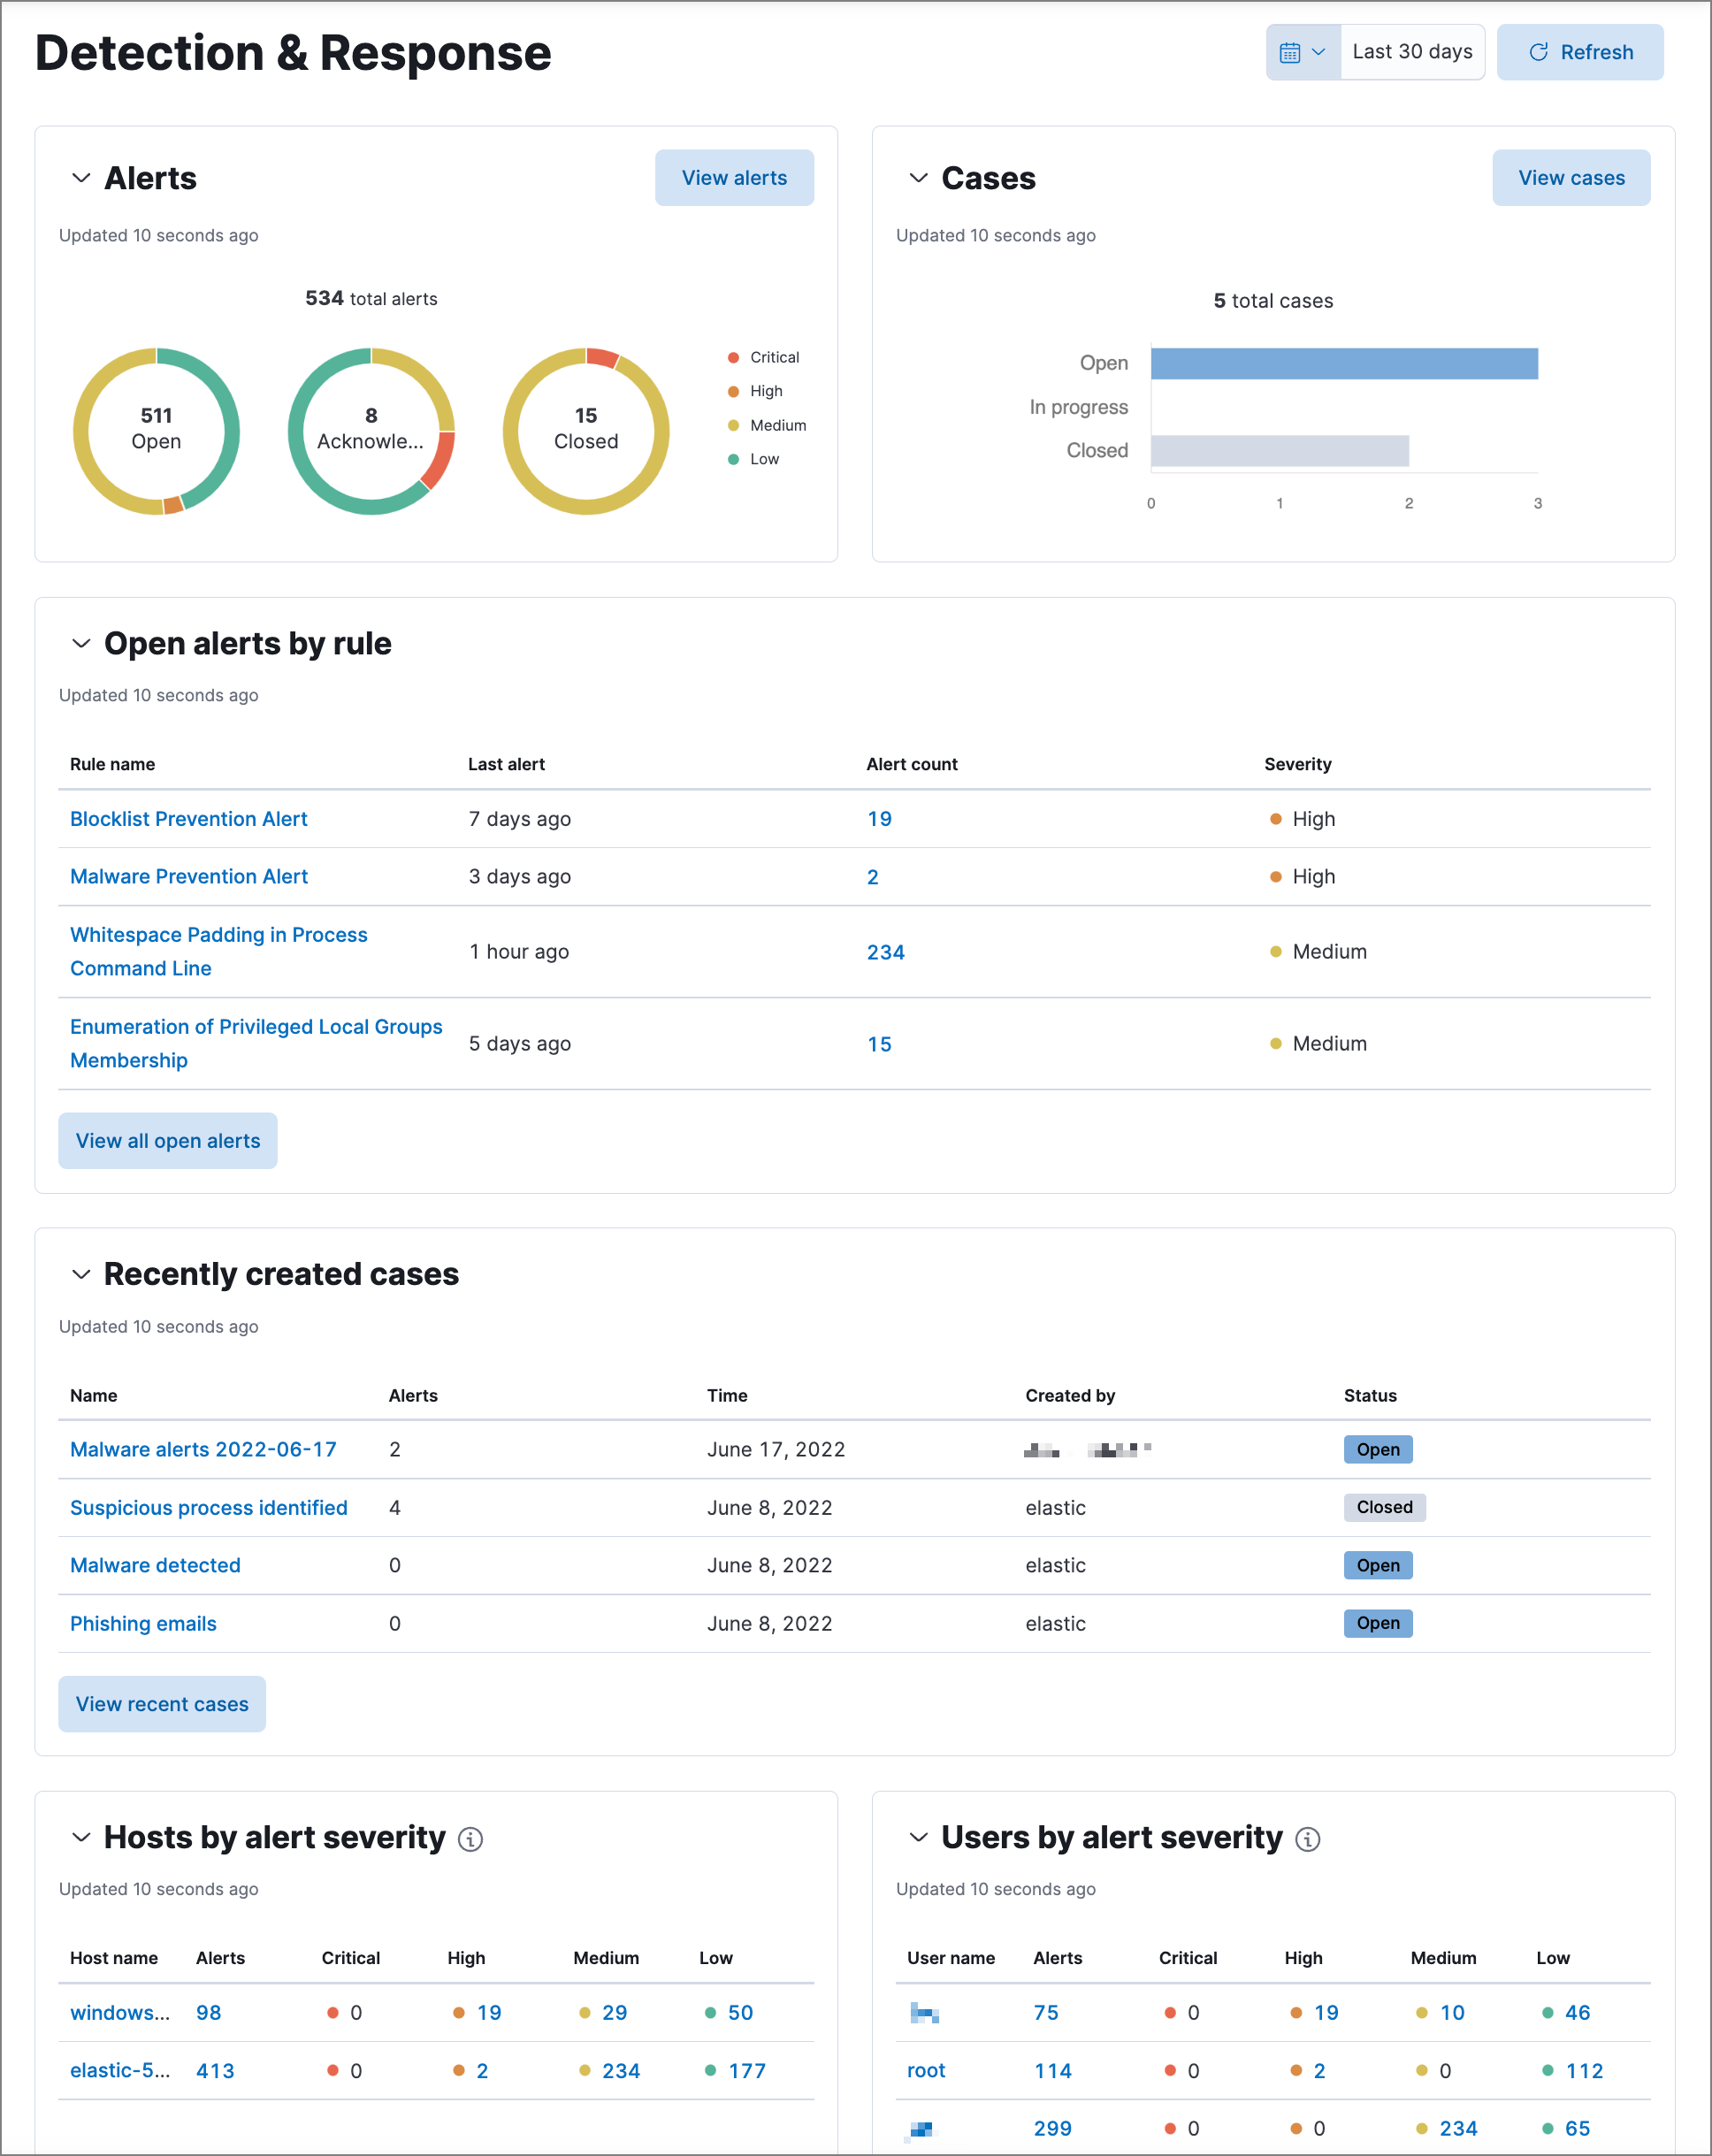
editThe Detection & Response dashboard provides focused visibility into the day-to-day operations of your security environment. It helps security operations managers and analysts quickly monitor recent and high priority detection alerts and cases, and identify the hosts and users associated with alerts.
Interact with various dashboard elements:
- Use the date and time picker in the upper-right to specify a time range for displaying information on the dashboard.
- In sections that list alert counts, click a number to investigate those alerts in Timeline.
- Click the name of a detection rule, case, host, or user to open its details page.
The following sections are included:
Alerts |
The total number of detection alerts generated within the time range, organized by status and severity. Select View alerts to open the Alerts page. |
Cases |
The total number of cases created within the time range, organized by status. Select View cases to open the Cases page. |
Open alerts by rule |
The top four detection rules with open alerts, organized by the severity and number of alerts for each rule. Select View all open alerts to open the Alerts page. |
Recently created cases |
The four most recently created cases. Select View recent cases to open the Cases page. |
Hosts by alert severity |
The hosts generating detection alerts within the time range, organized by the severity and number of alerts. Shows up to 100 hosts. |
Users by alert severity |
The users generating detection alerts within the time range, organized by the severity and number of alerts. Shows up to 100 users. |