Visualize detection alerts
editVisualize detection alerts
editVisualize and group detection alerts by specific parameters in the visualization section of the Alerts page.
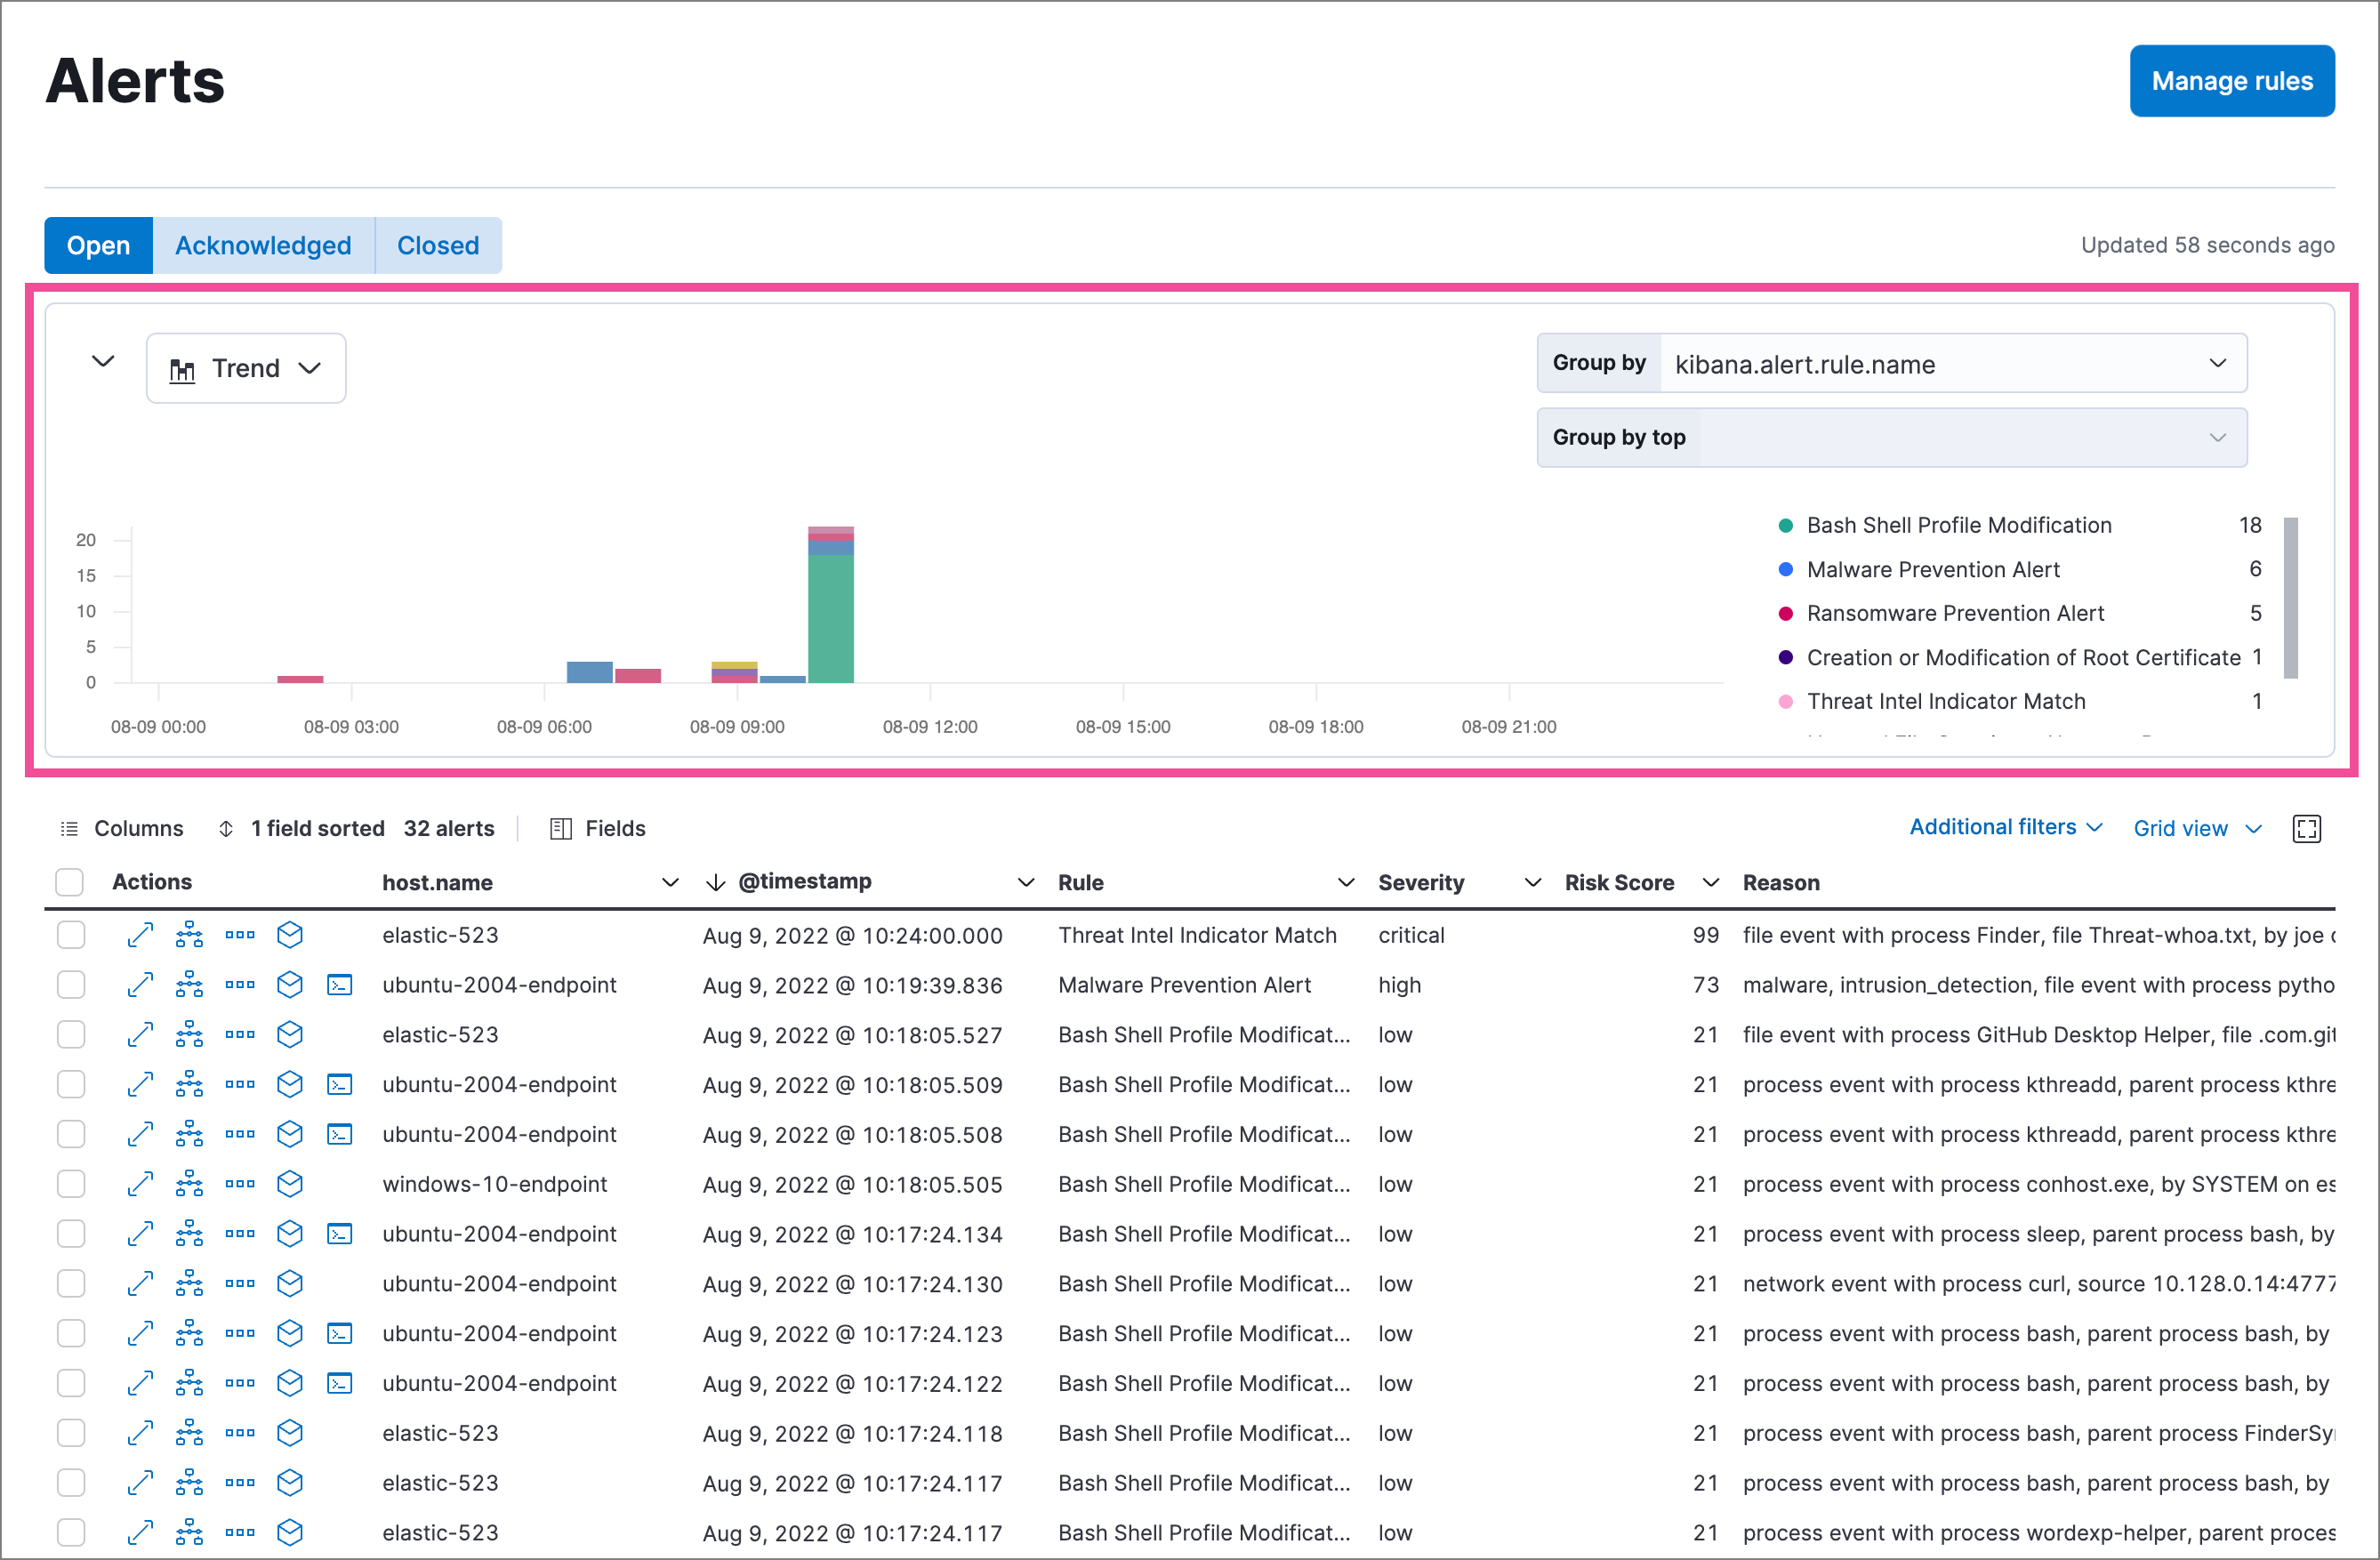
Use the left menu to select a view type (Trend, Table, or Treemap), and use the right menus to select the ECS fields to use for grouping:
- Group by: Primary field for grouping alerts.
- Group by top (if available): Secondary field for further subdividing grouped alerts.
For example, you can group first by rule name (Group by: kibana.alert.rule.name), then by host name (Group by top: host.name) to visualize which detection rules generated alerts, and which hosts triggered each of those rules. For groupings with a lot of unique values, the top 1,000 results are displayed.
The Group by top option isn’t available in all view types. You can also leave Group by top blank to group by only the primary field in Group by.
To reset a view to default settings, click the settings menu (![]() ) in the upper-right and select Reset group by fields (the settings menu appears when hovering over the area).
) in the upper-right and select Reset group by fields (the settings menu appears when hovering over the area).
Trend
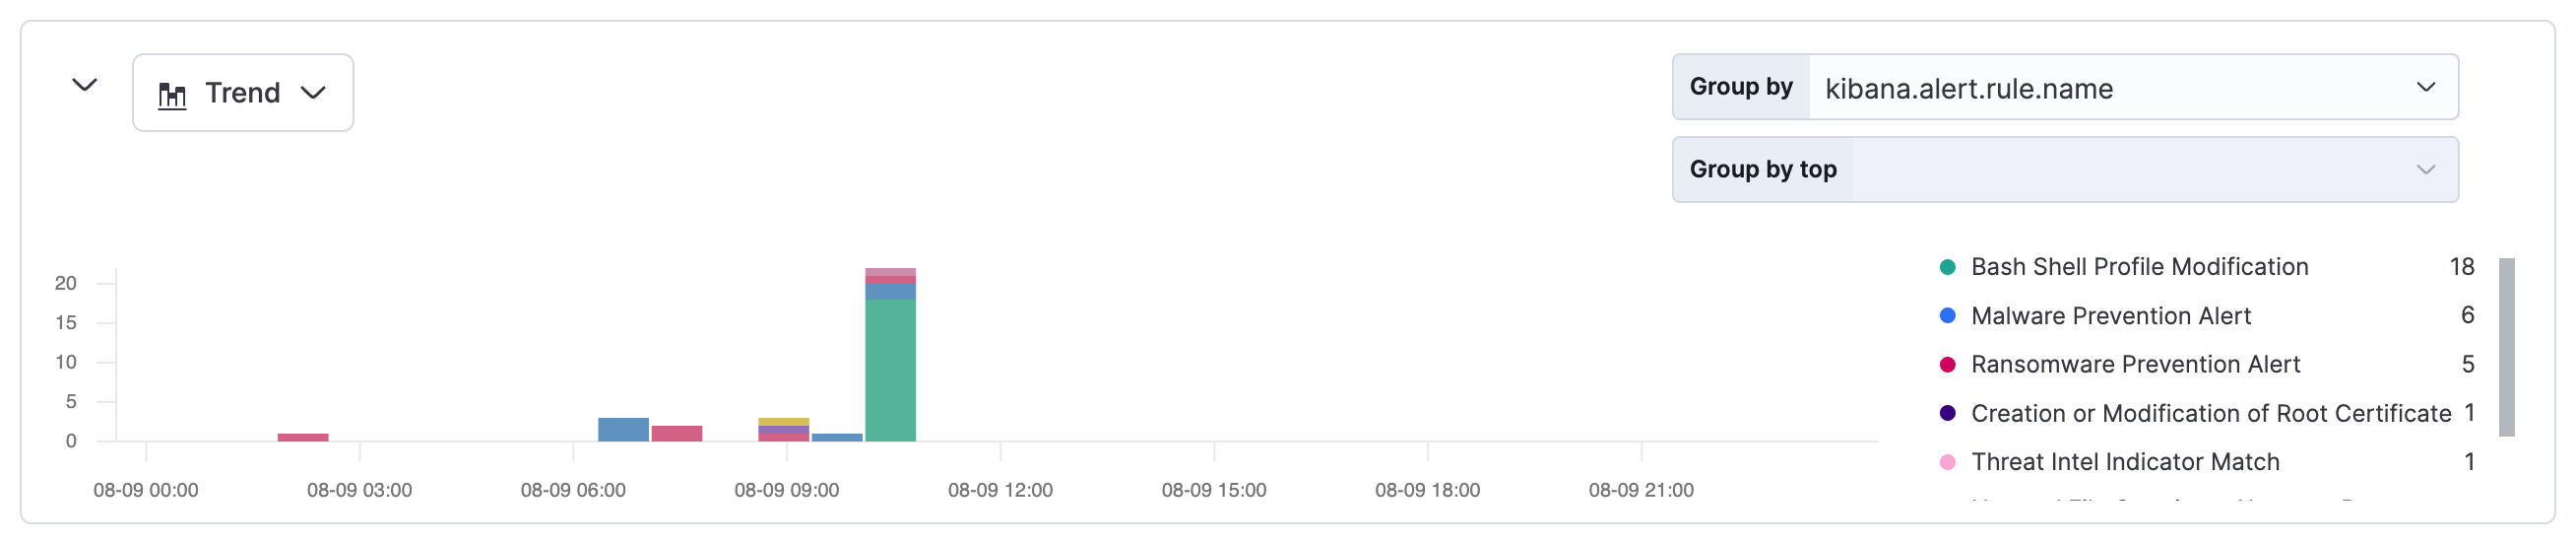
editThe trend view is the default visualization on the Alerts page and shows the occurrence of alerts over time. By default, it groups alerts by detection rule name (kibana.alert.rule.name).
The Group by top menu is unavailable for the trend view.
Table
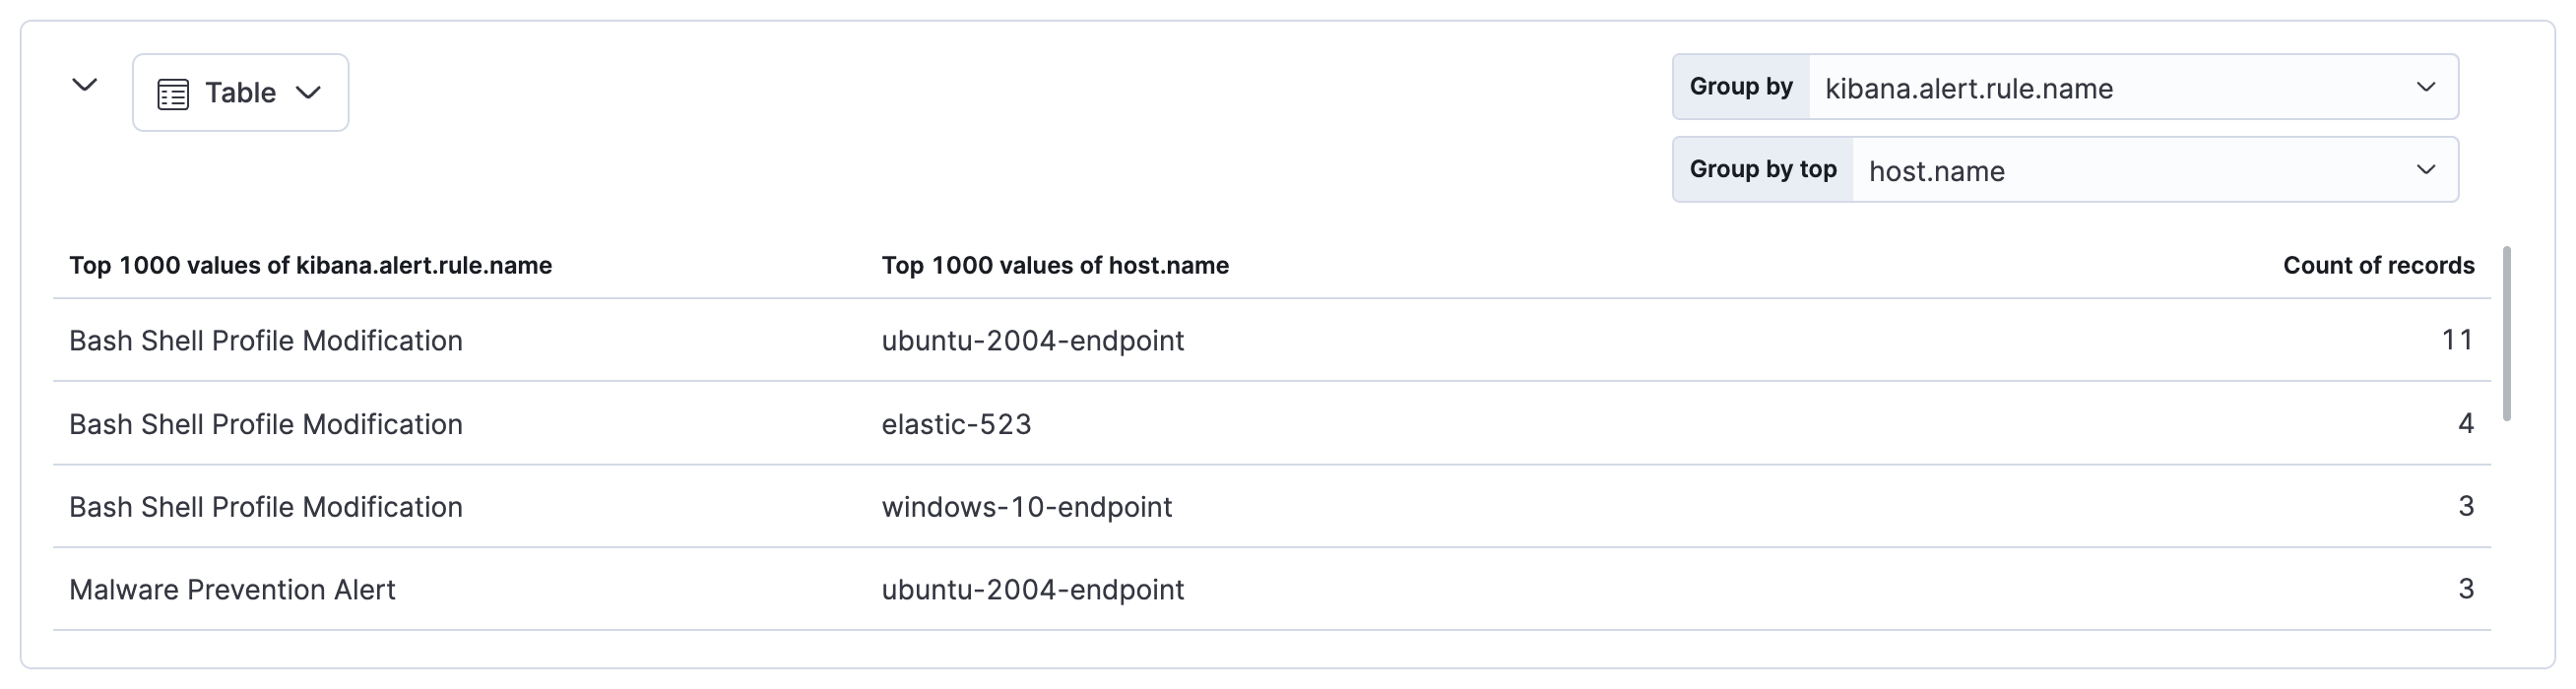
editThe table view shows the count of alerts in each group. By default, it groups alerts first by detection rule name (kibana.alert.rule.name), then by host name (host.name).
Treemap
editThe treemap view shows the distribution of alerts as nested, proportionally-sized tiles. This view can help you quickly pinpoint the most prevalent and critical alerts.
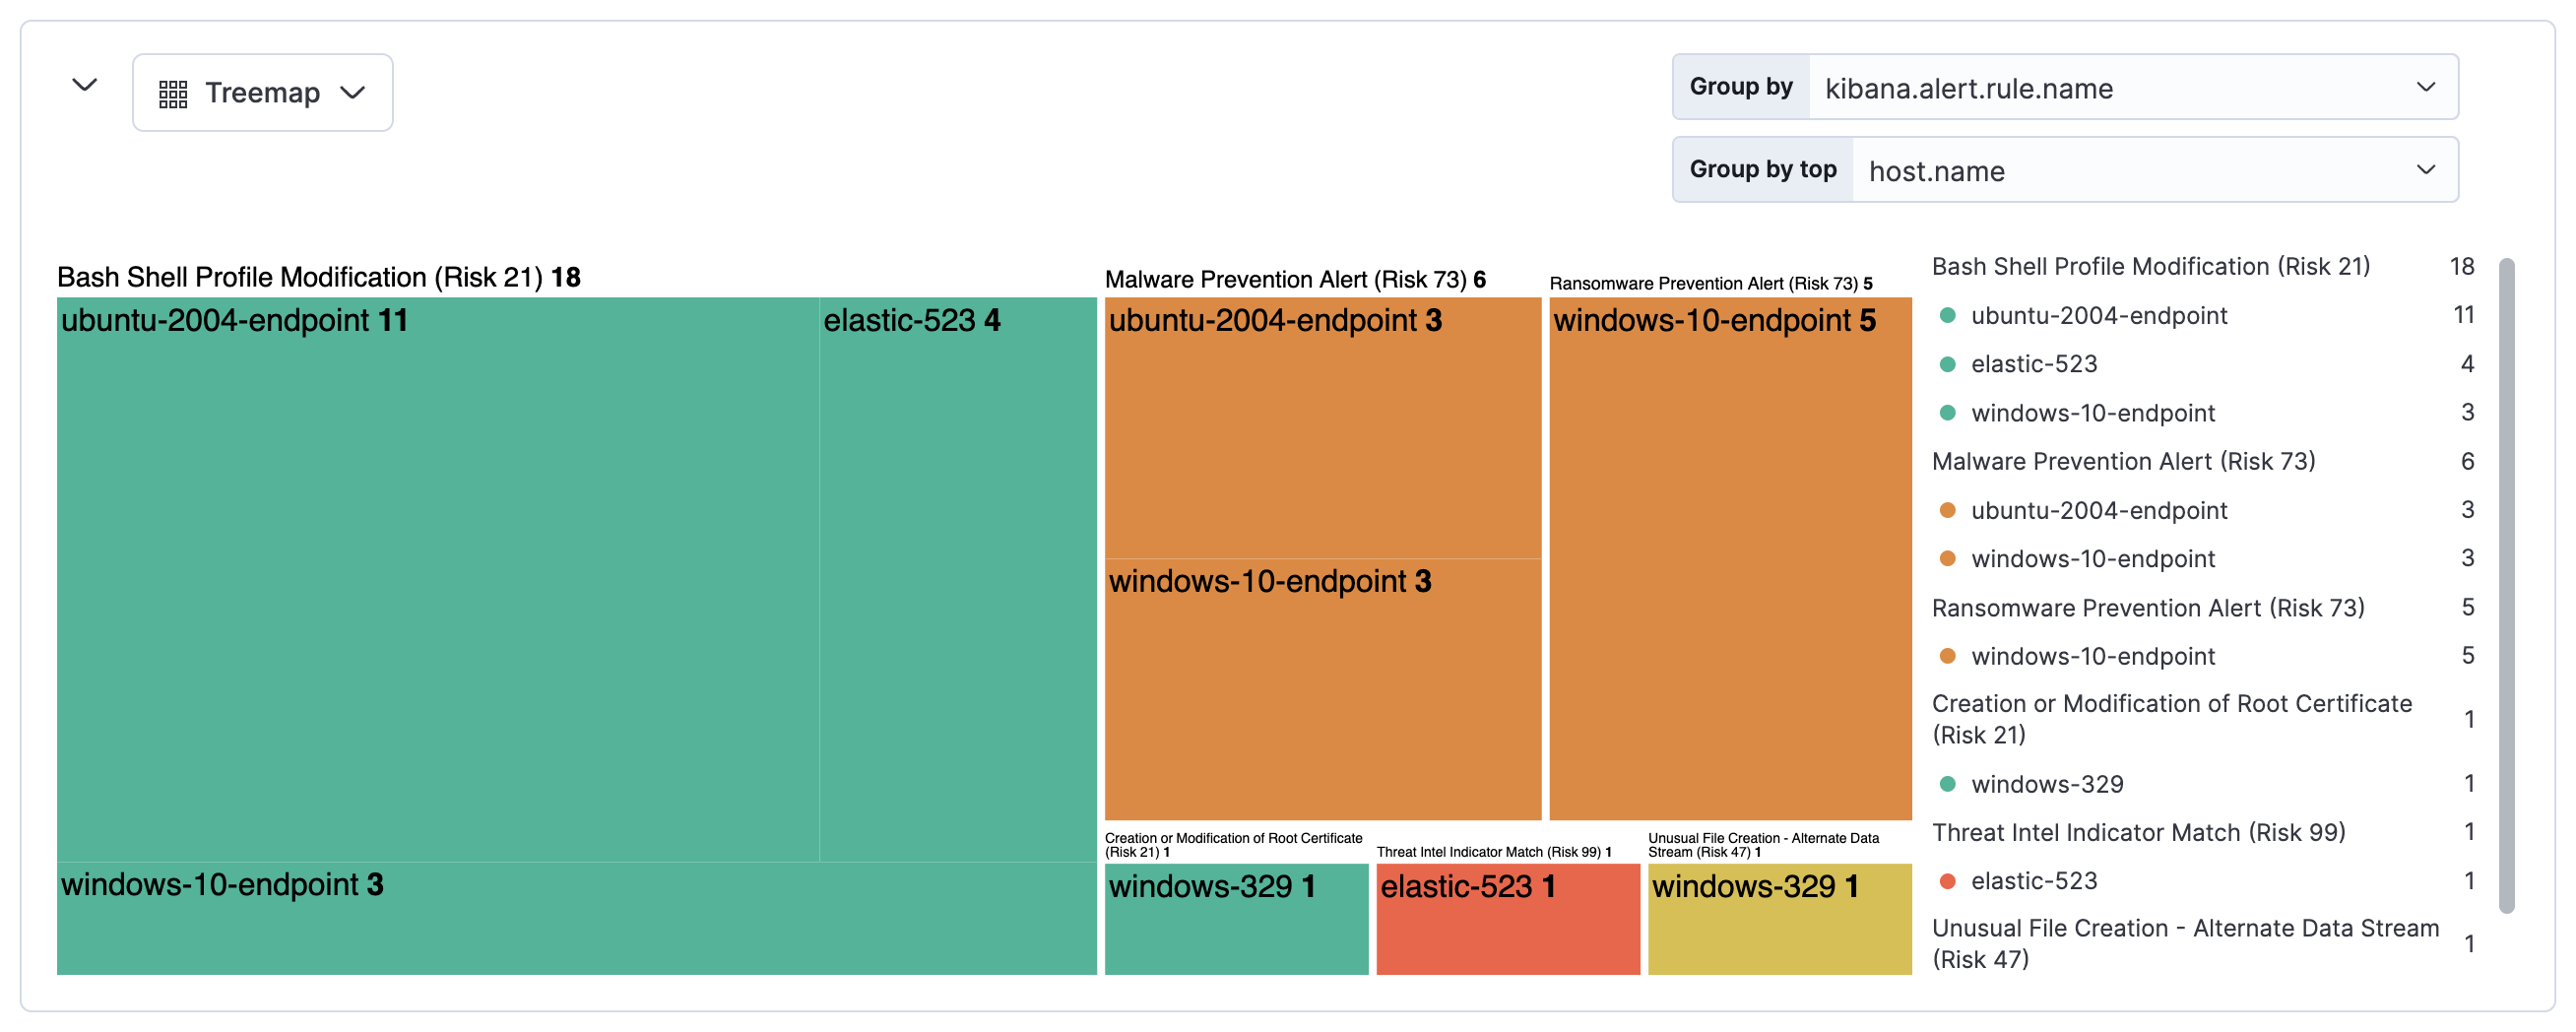
Larger tiles represent more frequent alerts, and each tile’s color is based on the alerts' risk score:
-
Green: Low risk (
0-46) -
Yellow: Medium risk (
47-72) -
Orange: High risk (
73-98) -
Red: Critical risk (
99-100)
By default, the treemap groups alerts first by detection rule name (kibana.alert.rule.name), then by host name (host.name). This shows which rules generated the most alerts, and which hosts were responsible.
Depending on the amount of alerts, some tiles and text might be very small. Hover over the treemap to display information in a tooltip.
You can click on the treemap to narrow down the alerts displayed in both the treemap and the alerts table below. Click the label above a group to display the alerts in that group, or click an individual tile to display the alerts related to that tile. This adds filters under the KQL search bar, which you can edit or remove to further customize the view.