Kubernetes dashboard
editKubernetes dashboard
editThe Kubernetes dashboard provides insight into Linux process data from your Kubernetes clusters. It shows sessions in detail and in the context of your monitored infrastructure.
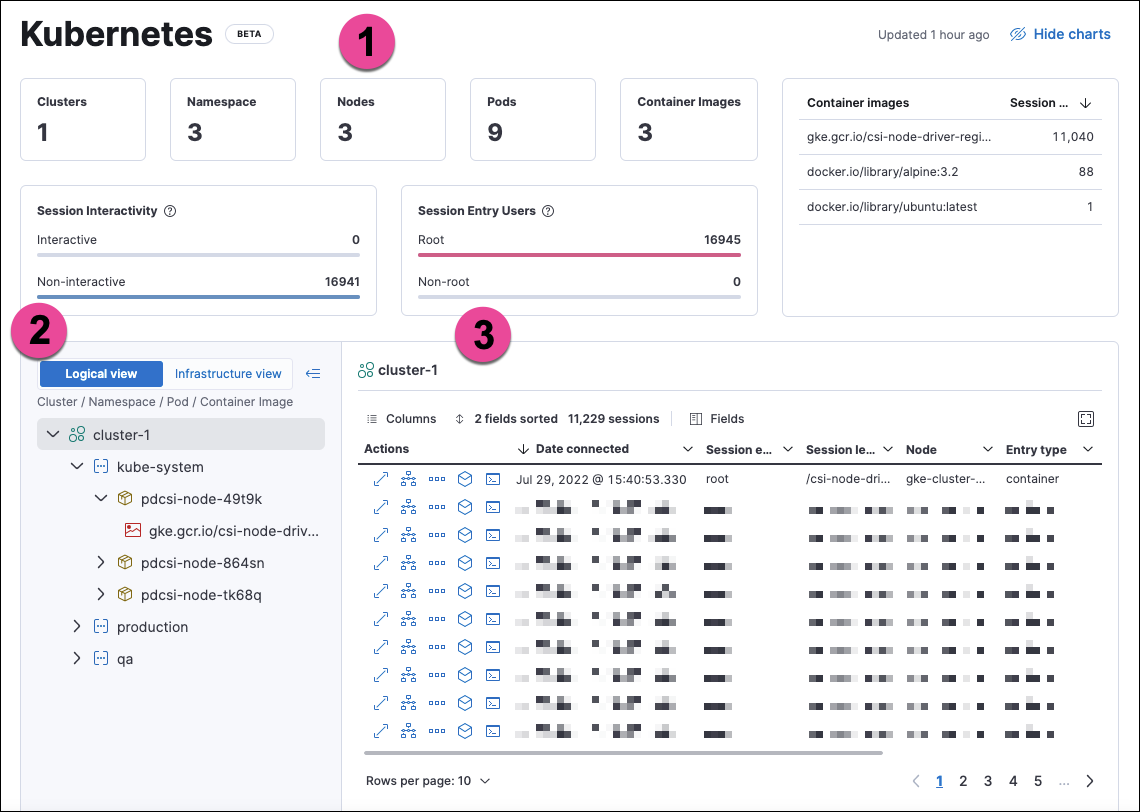
The numbered sections are described below:
- The charts at the top of the dashboard provide an overview of your monitored Kubernetes infrastructure. You can hide them by clicking Hide charts.
- The tree navigation menu allows you to navigate through your deployments and select the scope of the sessions table to the right. You can select any item in the menu to show its sessions. In Logical view, the menu is organized by Cluster, Namespace, Pod, and Container image. In Infrastructure view, it is organized by Cluster, Node, Pod, and Container image.
- The sessions table displays sessions collected from the selected element of your Kubernetes infrastructure. You can view it in fullscreen by selecting the button in the table’s upper right corner. You can sort the table by any of its fields.
You can filter the data using the KQL search bar and date picker at the top of the page.
From the sessions table’s Actions column, you can take the following investigative actions:
- View details
- Open in Timeline
- Run Osquery
- Analyze event
- Open Session View
Session View displays Kubernetes metadata under the Metadata tab of the Detail panel:
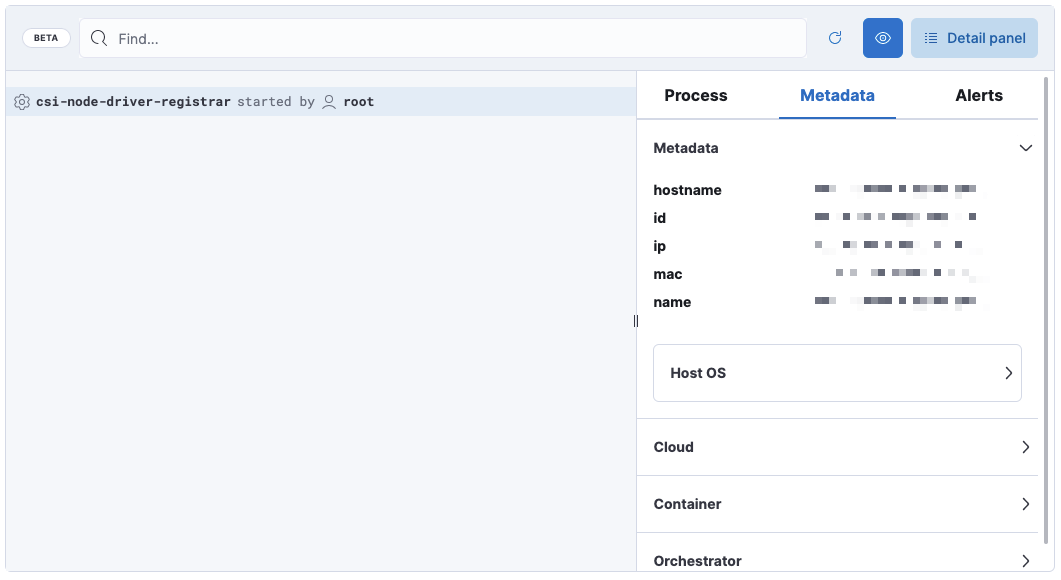
The Metadata tab is organized into these expandable sections:
-
Metadata:
hostname,id,ip,mac,name, Host OS information -
Cloud:
instance.name,provider,region,account.id,project.id -
Container:
id,name,image.name,image.tag,image.hash.all -
Orchestrator:
resource.ip,resource.name,resource.type,namespace,cluster.id,cluster.name,parent.type
Setup
editTo collect session data for the dashboard, you’ll deploy a Kubernetes DaemonSet to your clusters that implements the Elastic Defend integration.
Prerequisites:
- This feature requires Elastic Stack version 8.4 or newer.
- You need an active Fleet Server.
- Your Elastic deployment must have the Elastic Defend integration enabled.
-
The Elastic Defend integration policy must have Include session data set to
true. To modify this setting, go to Manage → Policies, select your policy, and findInclude session datanear the bottom of thePolicy settingstab.
Support matrix: This feature is currently available on GKE and EKS using Linux hosts and Kubernetes versions that match the following specifications:
Kubernetes versions |
Node OSes |
|
EKS |
1.18; 1.19; 1.20; 1.21 |
Amazon Linux 2, Bottlerocket OS |
GKE |
Regular (default channel): 1.21 and 1.22; Stable: 1.20 and 1.21; Rapid: 1.22 and 1.23 |
Container-optimized OS (COS), Ubuntu |
When running within Kubernetes, Elastic Endpoint’s host isolation and malware protection features are disabled.
Download and modify the DaemonSet manifest
editThe DaemonSet integrates Elastic Endpoint into your Kubernetes cluster. The Elastic Agent is enrolled to a running Fleet Server using the FLEET_URL parameter, and connected to a specific Elastic Agent policy using the FLEET_ENROLLMENT_TOKEN.
You first need to download the DaemonSet manifest .yaml, then modify it to include your Fleet URL and Enrollment Token before you deploy it to the clusters you want to monitor.
-
Download the DaemonSet manifest using this command:
curl -L -O https://raw.githubusercontent.com/elastic/endpoint/main/releases/8.5.0/kubernetes/deploy/elastic-defend.yaml
-
Fill in the manifest’s
FLEET_URLfield with your Fleet server’sHost URL. To find it, go to Kibana → Management → Fleet → Settings. For more information, refer to Fleet UI settings. -
Fill in the manifest’s
FLEET_ENROLLMENT_TOKENfield with a Fleet enrollment token. To find one, go to Kibana → Management → Fleet → Enrollment tokens. For more information, refer to Fleet enrollment tokens.
Apply the modified manifest to your cluster or clusters
editTo ensure you install Elastic Endpoint on the desired Kubernetes cluster(s), set the default context using command: kubectl config use-context <name-of-context>.
To check which contexts exist, use kubectl config get-contexts to list them from your local kubectl config file. An asterisk indicates the current default context.
You can repeat the following steps for multiple contexts.
Example:
-
Apply the manifest to a cluster:
kubectl apply -f elastic-endpoint-security.yaml -
Check the DaemonSet’s status:
kubectl get pods -A
Once the DaemonSet is running, Elastic Endpoint will start sending Linux session data from Kubernetes to Kibana. You can then view that data from the Kubernetes dashboard.
This dashboard uses data from the logs-* index pattern, which is included by default in the securitySolution:defaultIndex advanced setting. To collect data from multiple Elasticsearch clusters (as in a cross-cluster deployment), update logs-* to *:logs-*.