Run Osquery from a detection alert
editRun Osquery from a detection alert
editOsquery allows you to run live queries against an alert’s host to learn more about your infrastructure and operating systems. For example, with Osquery, you can search your system for indicators of compromise that might have contributed to the alert. You can then use this data to form your investigation and alert triage efforts.
You must complete the following to access Osquery and run searches against your hosts:
- Enable the Osquery manager integration on the host associated with the alert.
- Update your role’s privileges to allow access to Osquery.
- Verify that Elastic Agent’s status is Healthy. Refer to Fleet Troubleshooting if it is not.
Run live queries
edit-
Do one of the following from the Alerts table:
- Click the View details button to open the Alert details flyout, then click Take action → Run Osquery.
- Select the More actions menu (…), then select Run Osquery.
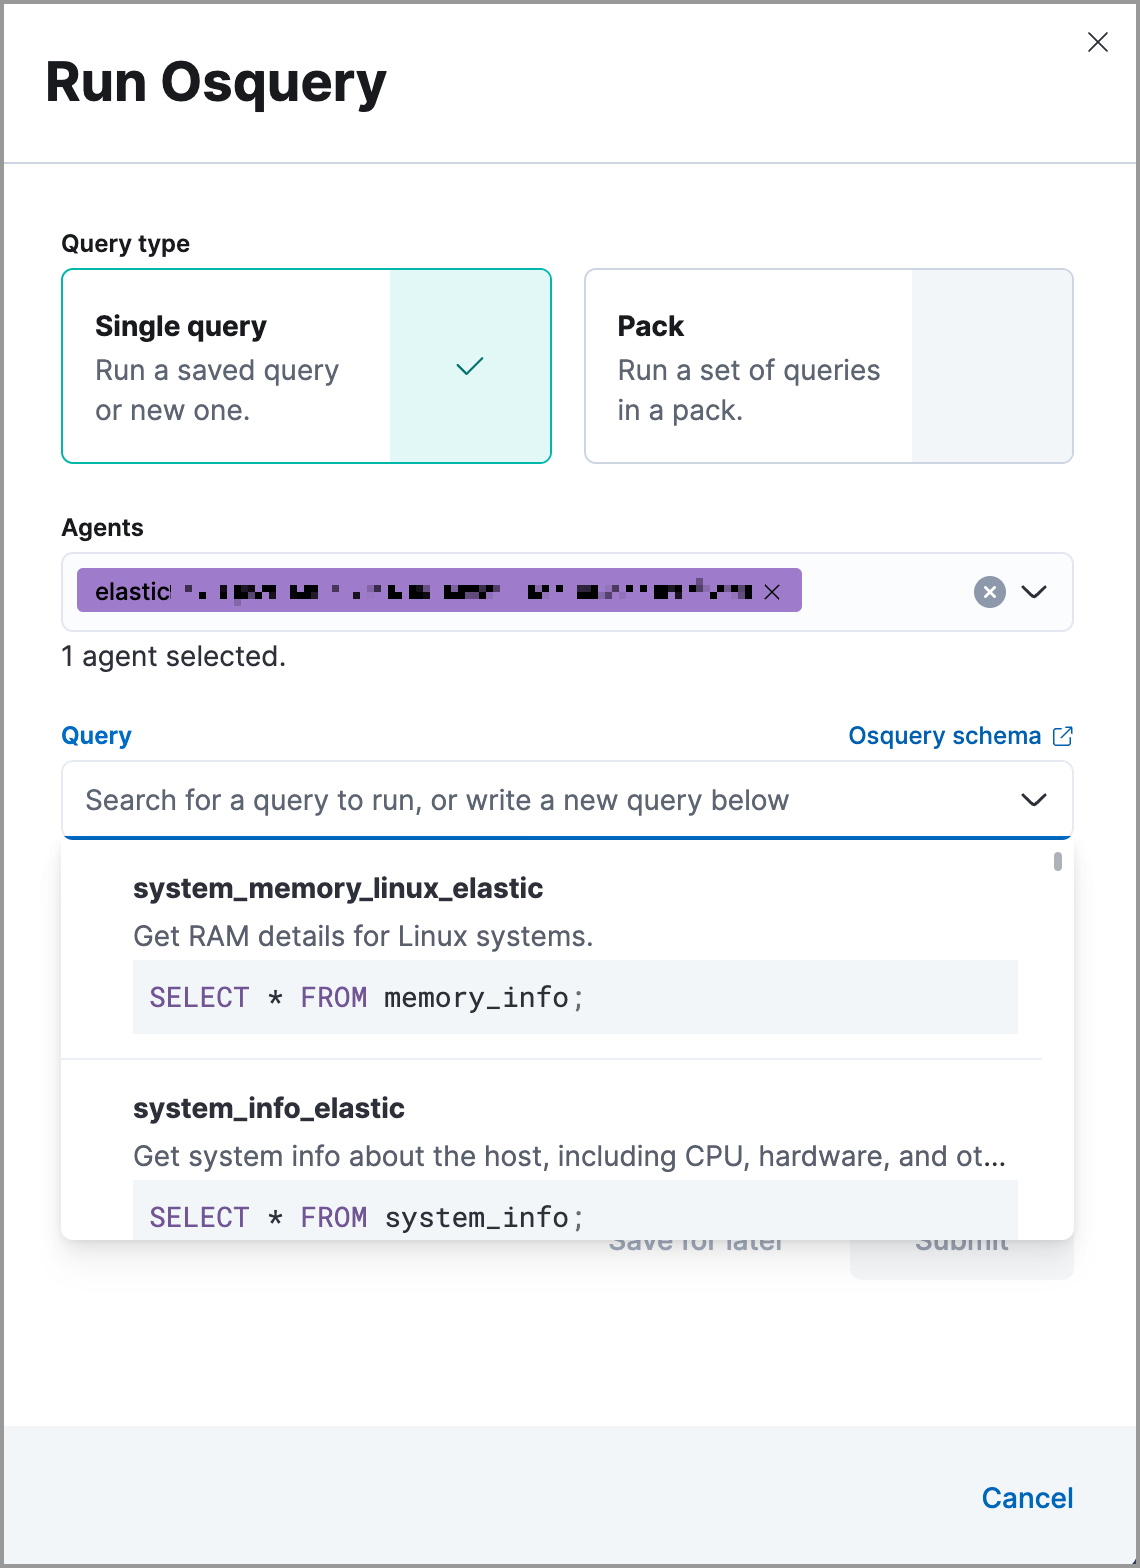
- Choose to run a single query or a query pack.
-
Select one or more Elastic Agents or groups to query. Start typing in the search field to get suggestions for Elastic Agents by name, ID, platform, and policy.
The host associated with the alert is automatically selected. You can specify additional hosts to query.
-
Specify the query or pack to run:
- Query: Select a saved query or enter a new one in the text box. After you enter the query, you can expand the Advanced section to view or set mapped ECS fields included in the results from the live query. Mapping ECS fields is optional.
-
Pack: Select from query packs that have been loaded and activated. After you select a pack, all of the queries in the pack are displayed.
Refer to prebuilt packs to learn about using and managing Elastic prebuilt packs.
-
Click Submit. Queries will timeout after 5 minutes if there are no responses.
To save the query for future use, click Save for later and define the ID, description, and other details.
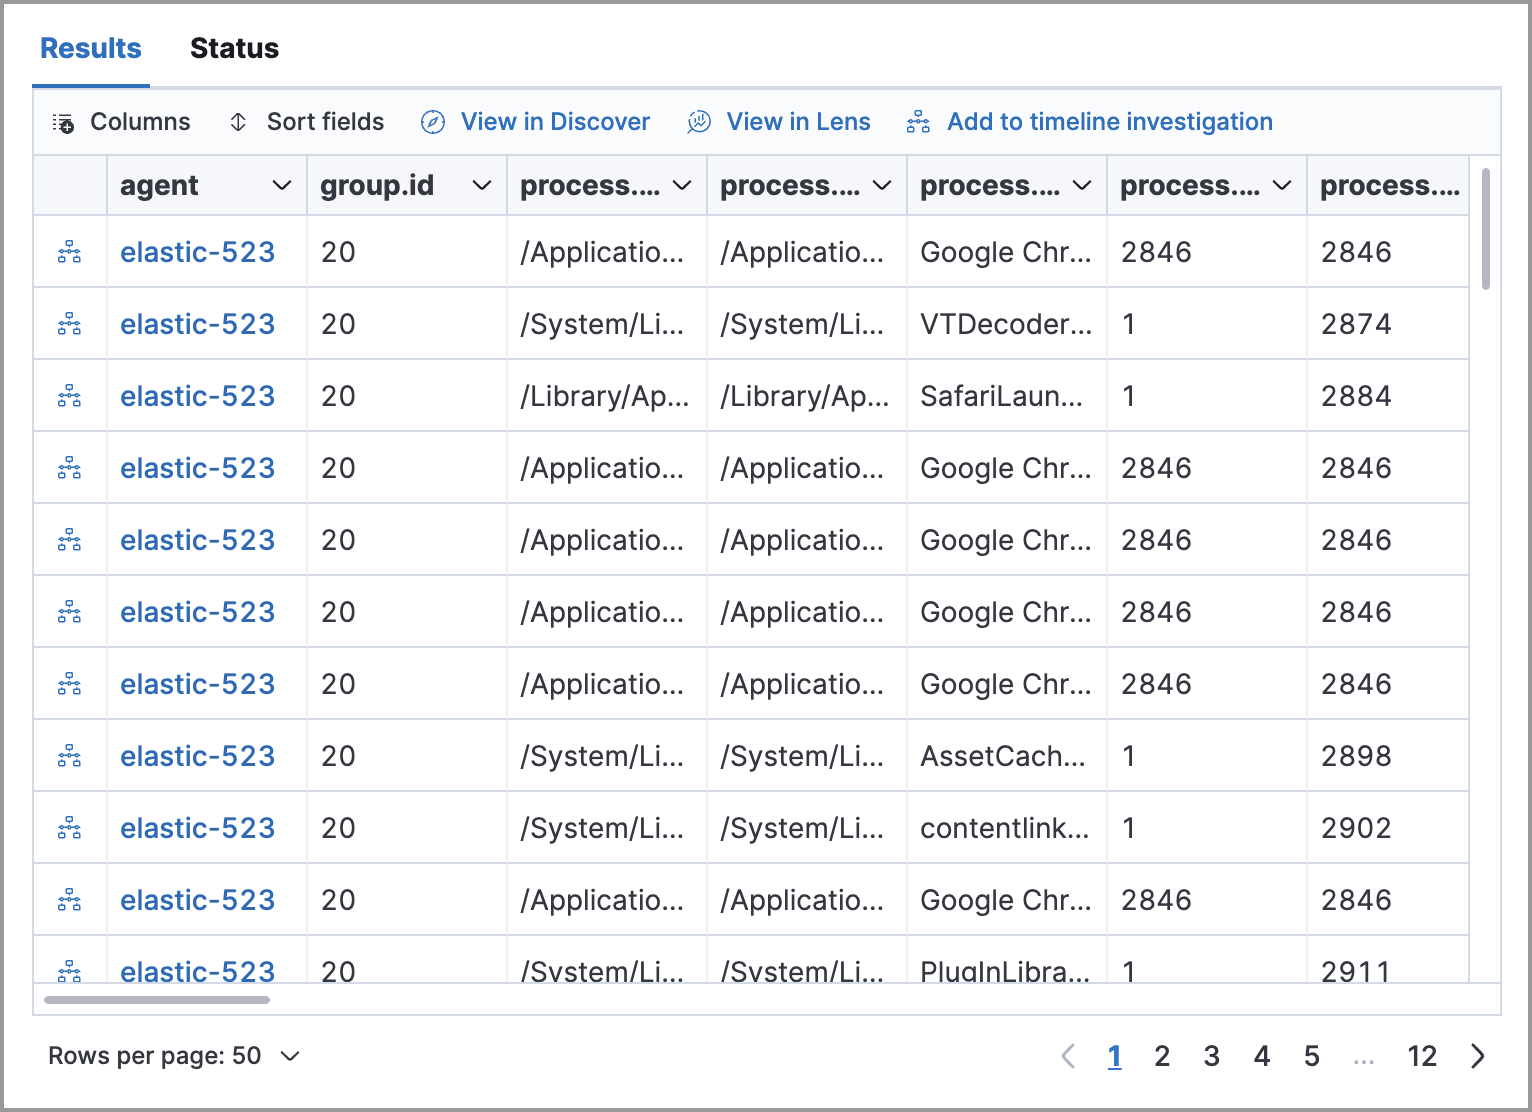
Review single query results
editResults for single queries appear in the Results tab. When you run a query, the number of agents queried and query status temporarily display in a status bar above the results table. Agent responses can be Sucessful, Not yet responded (pending), and Failed.
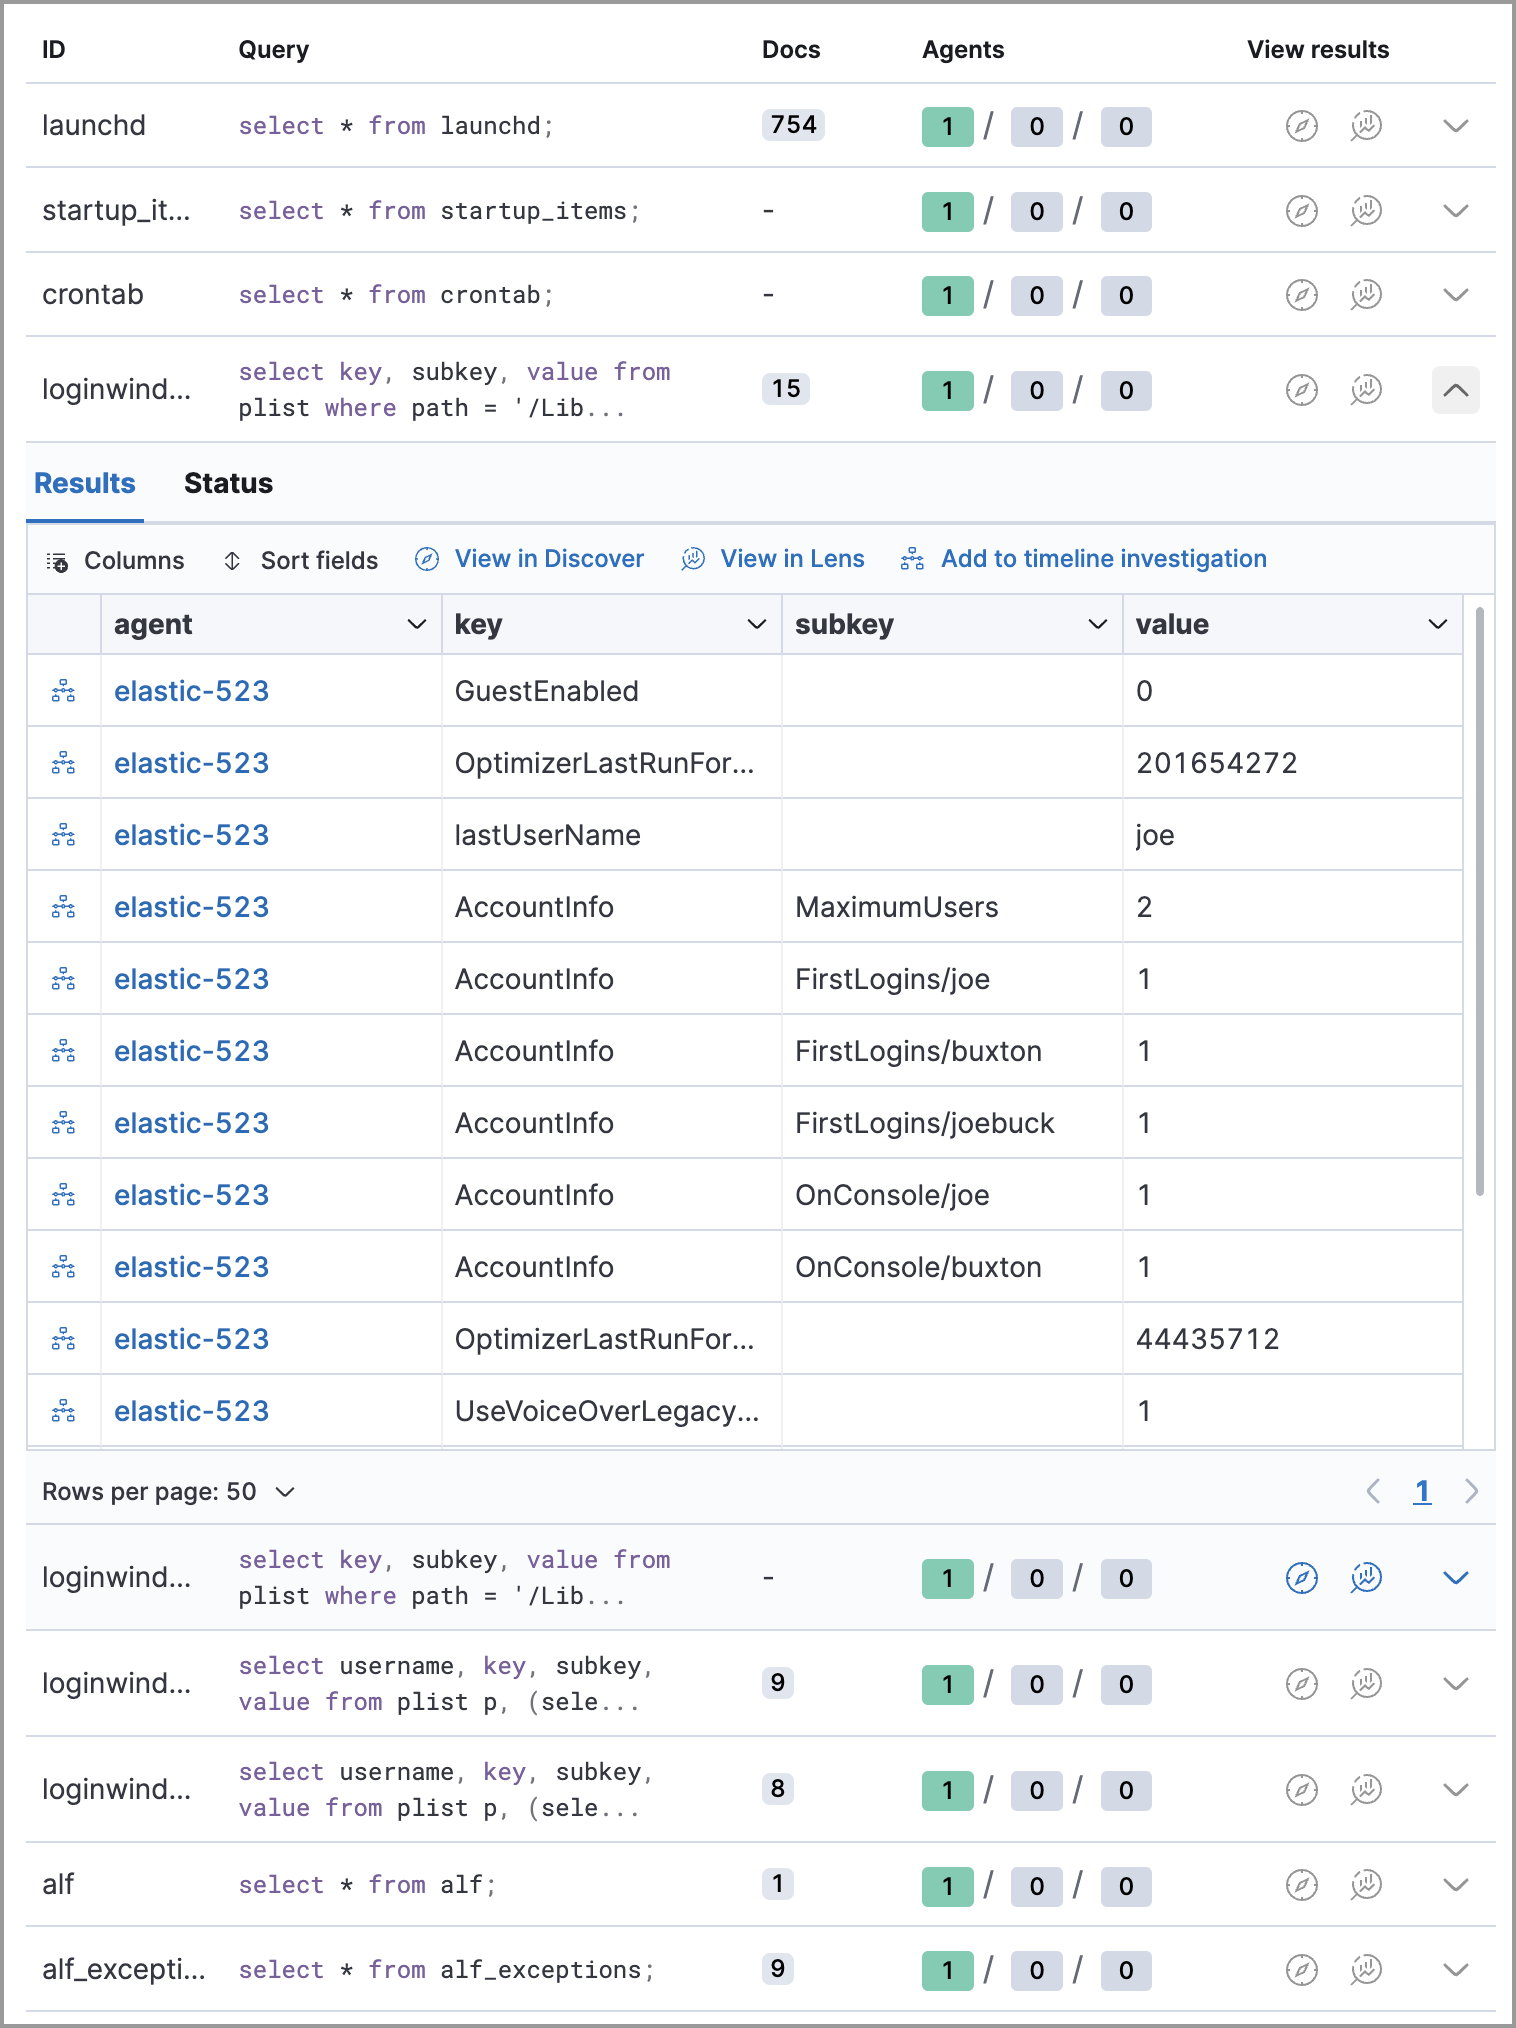
Review query pack results
editResults for each query in the pack appear in the Results tab. Click the expand button (![]() ) at the far right of each query row to display query results. The number of agents that were queried and their responses are shown for each query. Agent responses are color-coded. Green is
) at the far right of each query row to display query results. The number of agents that were queried and their responses are shown for each query. Agent responses are color-coded. Green is Sucessful, Not yet responded (pending) is gray, and Failed is red.
Investigate query results
editFrom the results table, you can:
-
Click the View in Discover button (
 ) to explore the results in Discover.
-
Click the View in Lens button (
 ) to navigate to Lens, where you can use the drag-and-drop Lens editor to create visualizations.
-
Click the Timeline button (
 ) to investigate a single query result in Timeline or Add to timeline investigation to investigate all results. This option is only available for single query results.
When you open all results in Timeline, the events in Timeline are filtered based on the
action_IDgenerated by the Osquery query. - View more information about the request, such as failures, by opening the Status tab.