Hosts page overview
editHosts page overview
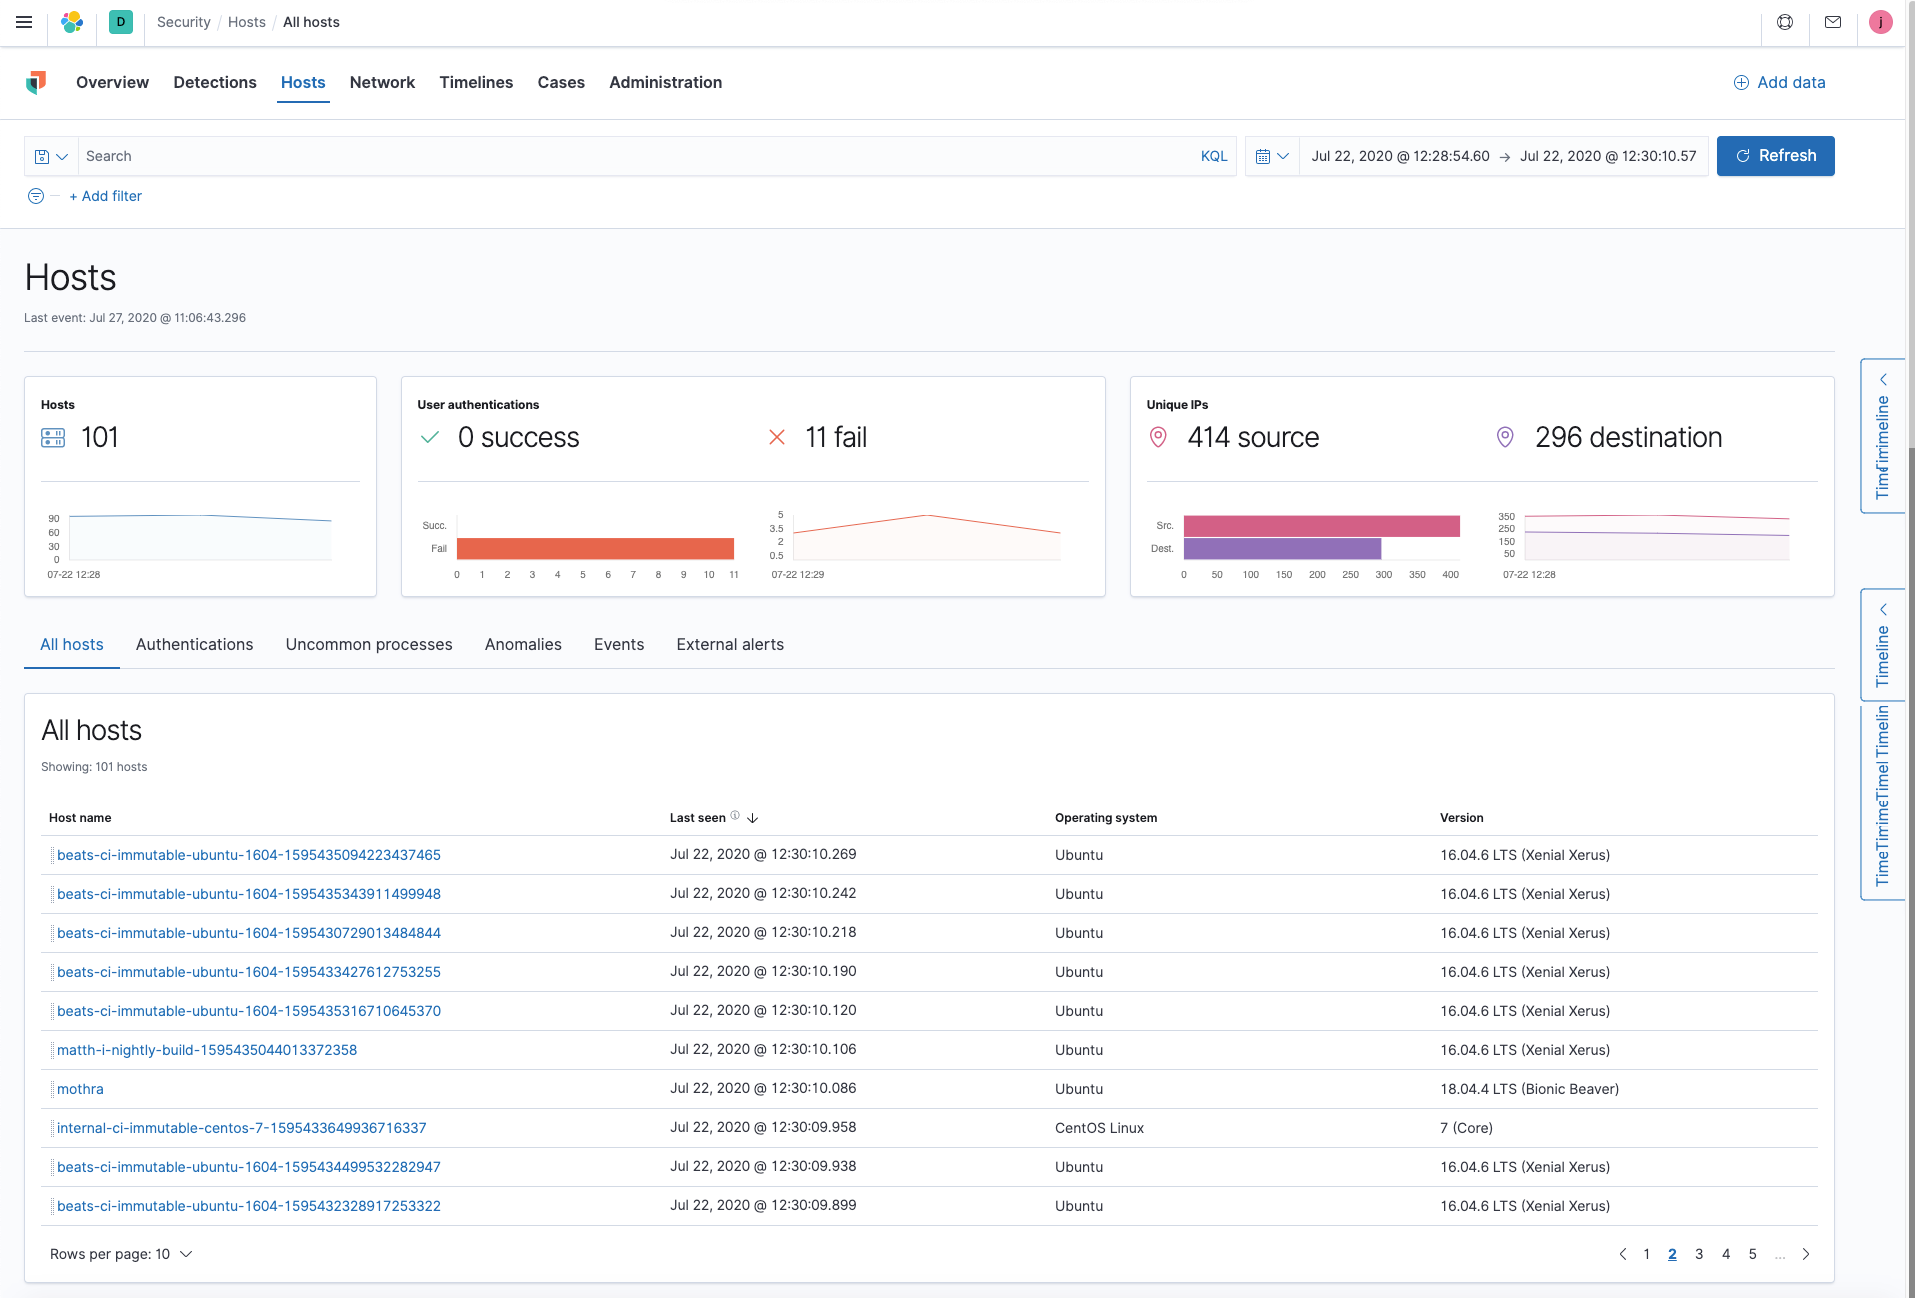
editThe Hosts page provides a comprehensive overview of all hosts and host-related security events. Key Performance Indicator (KPI) charts, data tables, and interactive widgets let you view specific data, drill down for deeper insights, and interact with the Timeline Event Viewer for further investigation.
Search and filter hosts
The Kibana Query Language (KQL) bar, which appears at the top of each page in the Elastic Security app, is useful to search and filter hosts. Use the timepicker to the right of the KQL bar to select a specific date and time range. NOTE: For more information about searching using KQL, see Search data.
Host Key Performance Indicators (KPIs) charts
KPI charts show data metrics for hosts, user authentications, and unique IPs based on the time range specified in the date picker. Data in the KPI charts is depicted via linear or bar graphs. NOTE: The default time range is within the last 15 minutes.
Data tables
Beneath the KPI charts are data tables, categorized by individual tabs, which are useful for viewing and investigating specific types of data. Select the relative tab to view the following data:
- All hosts: high-level host details
- Authentications: authentication events
- Uncommon processes: uncommon processes running on hosts
- Anomalies: anomalies discovered by machine learning jobs
- Events: all host events
- External alerts: alerts received from external monitoring tools
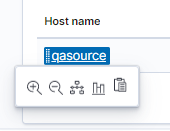
Numerous values in the data tables (e.g., host name, process name, etc.) contain inline options when you hover over them: Filter for value, Filter out value, Add to timeline investigation, Show top host.name, and Copy to Clipboard.
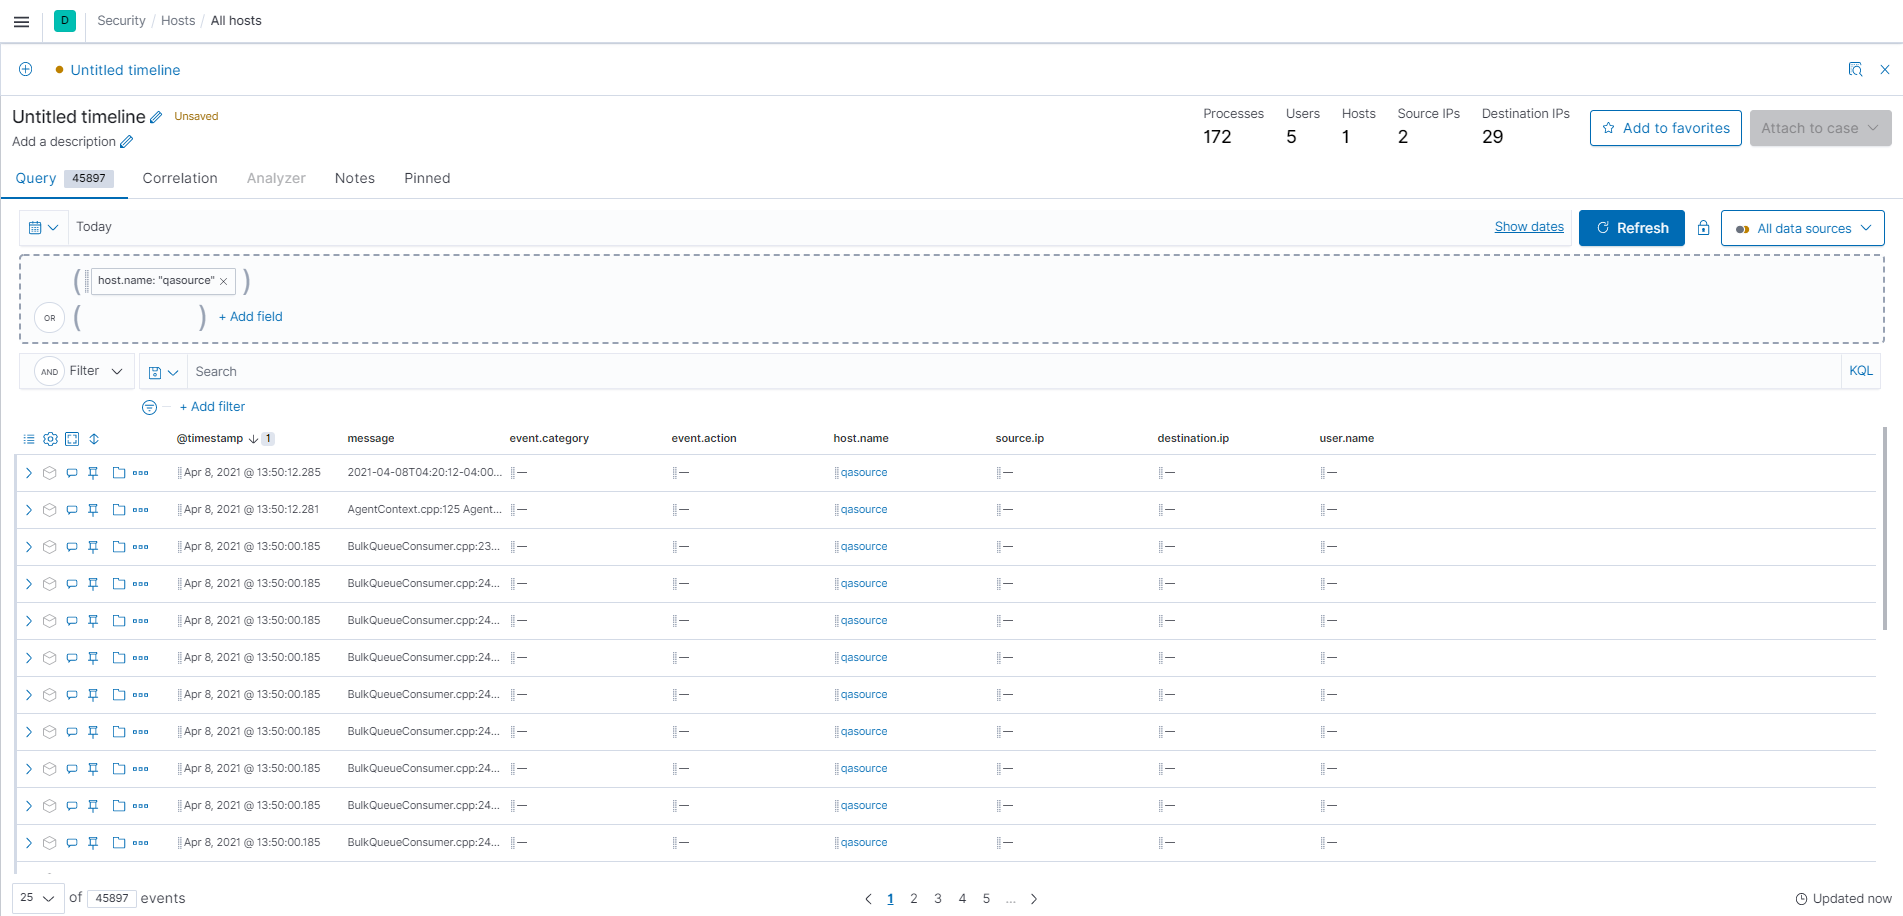
Add data values to the Timeline
You can add any highlighted value in the data tables to a Timeline query by dragging and dropping the value from the table to the Timeline tab on the rightmost side of the page. You can also select the Add to timeline inline option if you hover over a highlighted value in the table. If the Timeline panel is already open, drag and drop the value to the Query box. Repeat to add additional fields to the query, or click +Add Field in the Timeline pane.
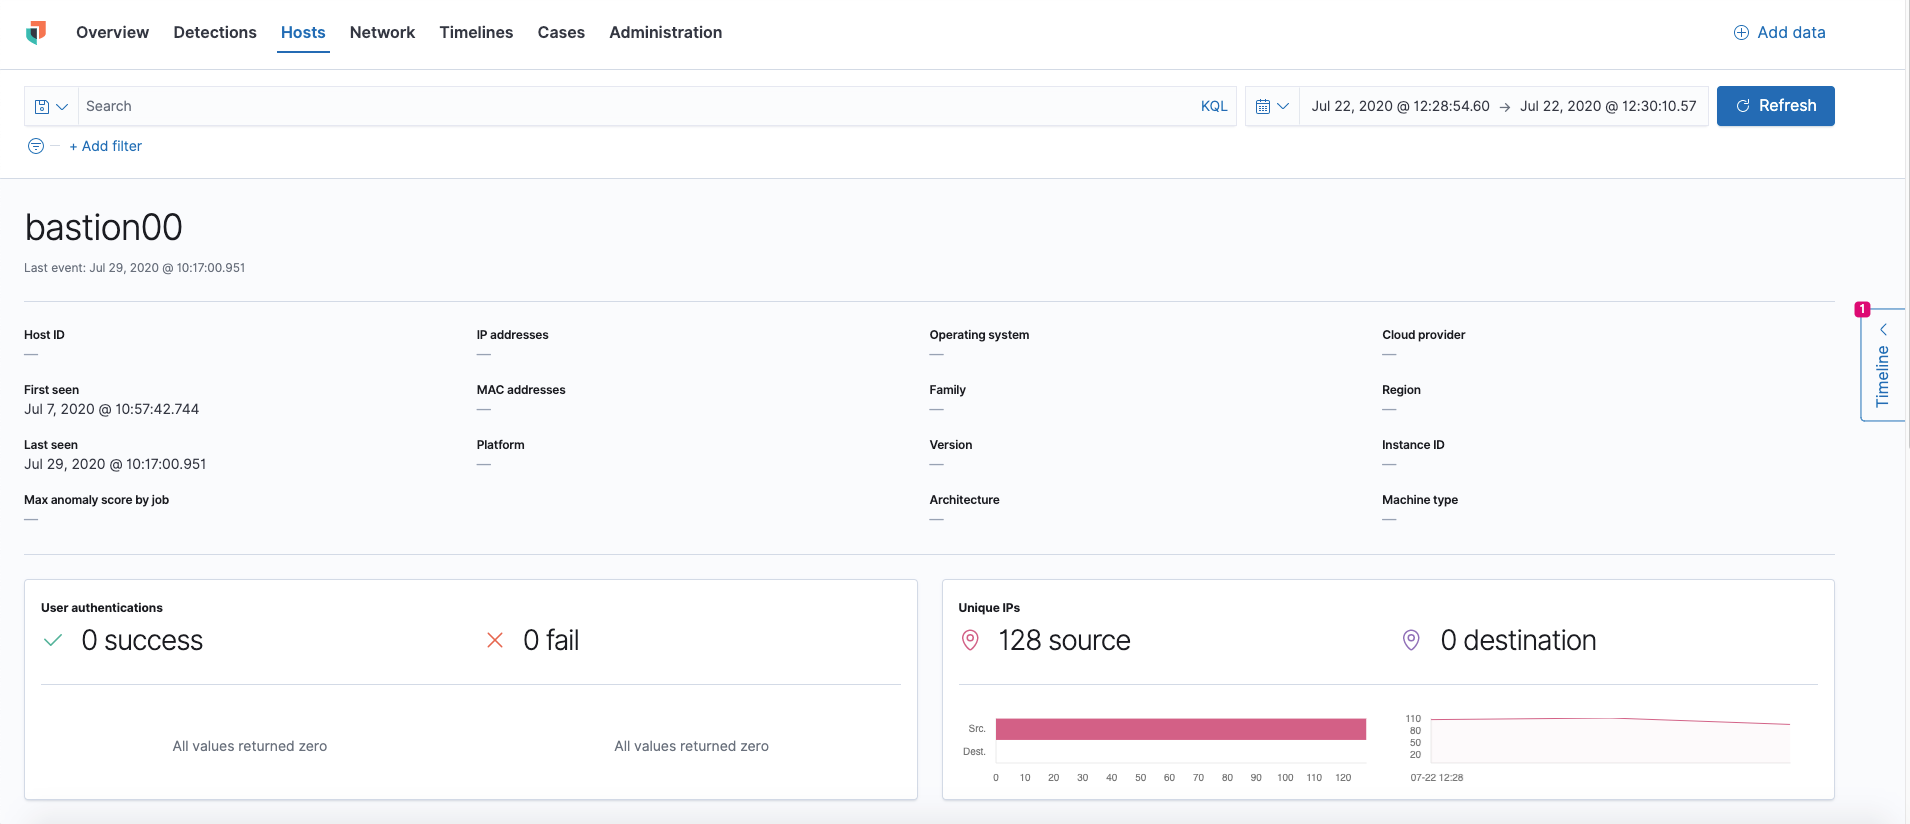
Host detail pages
Host detail pages display all relative information for a selected host, such as the Host ID, First Seen and Last Seen timestamps, IP addresses, Operating System, and more. To view a host detail page, click on the relative Host name link from the Hosts tab.