Get started
editGet started
editTo set up a synthetic monitor, you need to configure the monitor, run it, and send data back to Elasticsearch. After setup is complete, the data will be available in the Uptime app in Kibana to view, analyze, and alert on.
There are three ways to set up a synthetic monitor:
- Heartbeat
- Project Monitors
- The Uptime app UI
Read more about each option below, and choose the approach that works best for you.
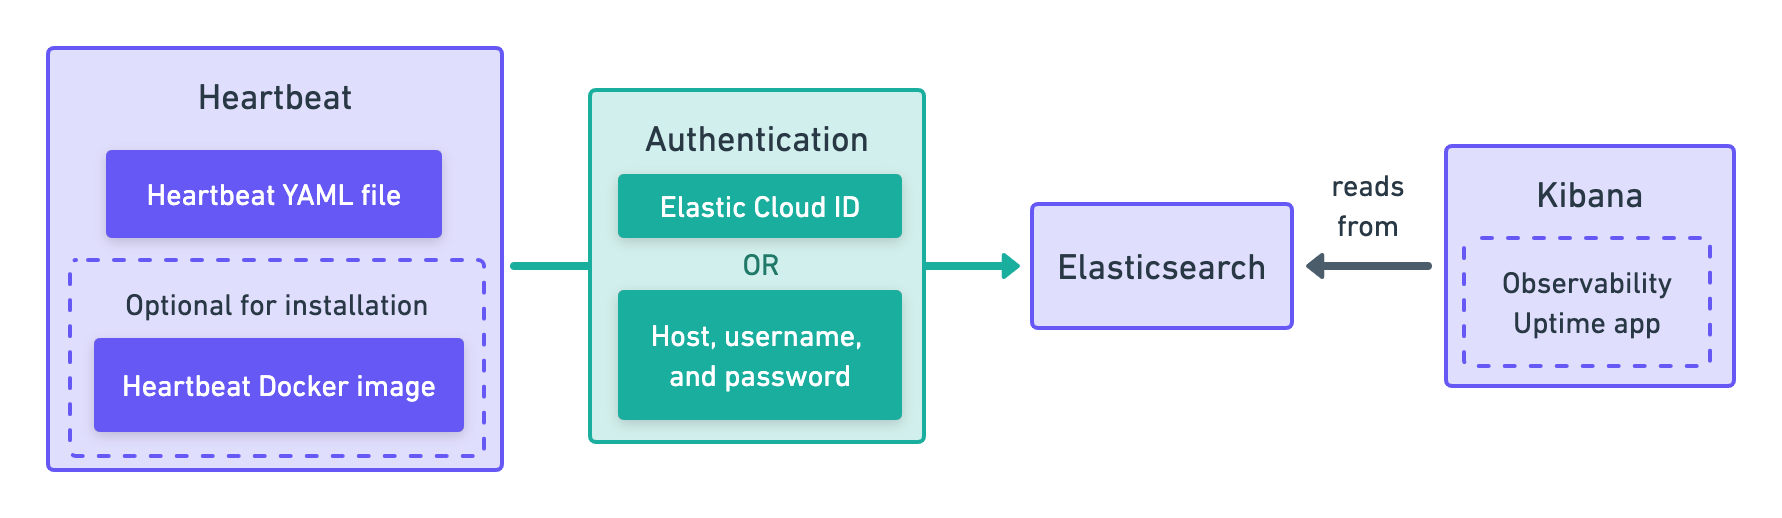
Heartbeat
editHeartbeat is a lightweight daemon that you install on a remote server to periodically check the status of your services and determine if they are available. Performance data is then gathered and reported back to Heartbeat, where it’s formatted and sent to the Elastic Stack.
This approach is only recommended for lightweight checks, and works well for system administrators wanting to configure lightweight monitors using YAML files. You should not use this approach to create browser monitors. If you want to create browser monitors, use Project Monitors or the Uptime app instead.
Get started in Use Heartbeat.
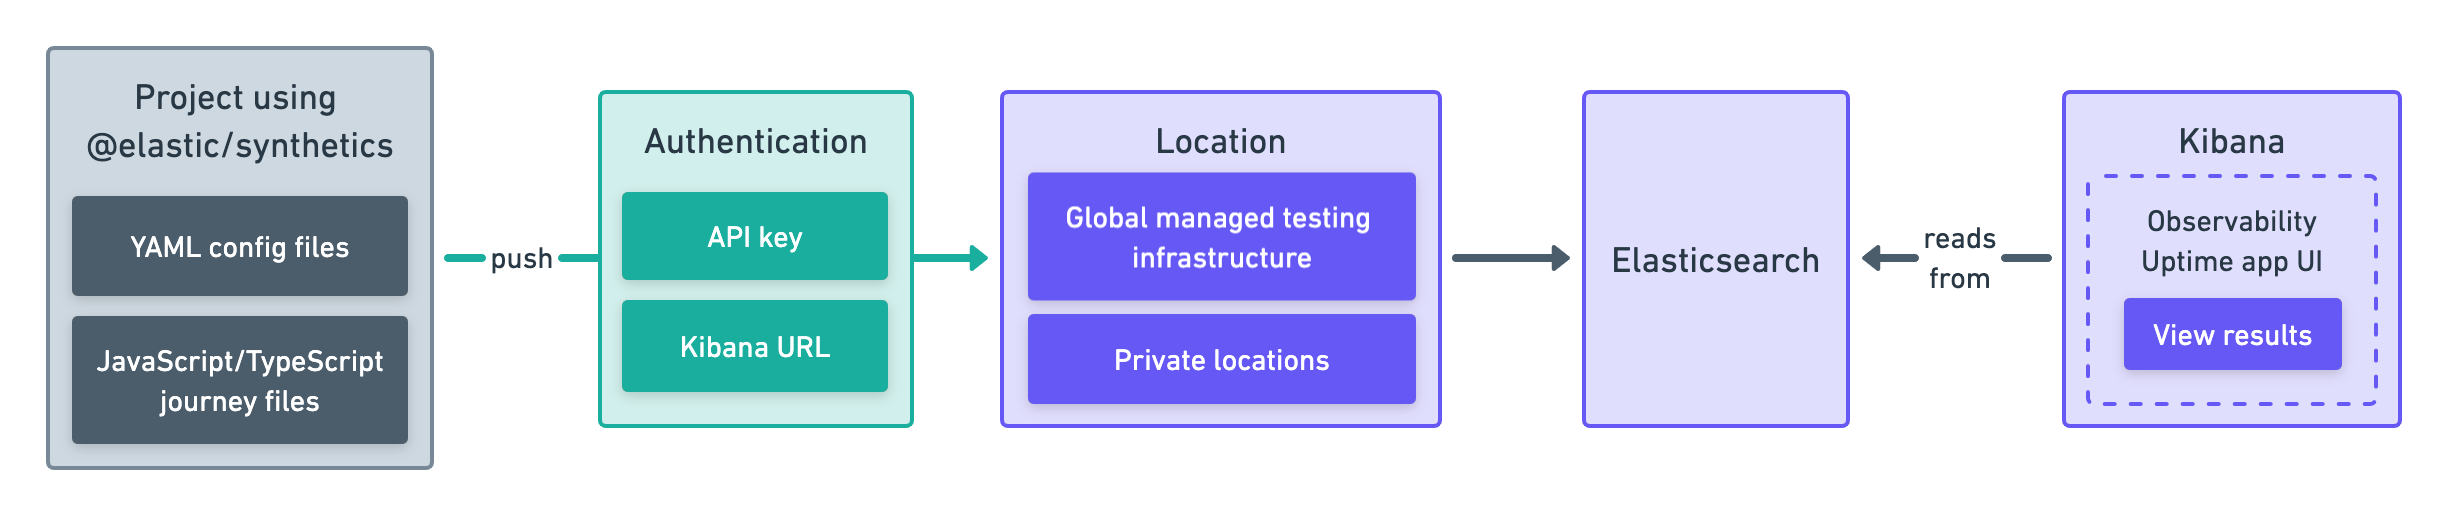
Project Monitors
editThis functionality is in beta and is subject to change. The design and code is less mature than official GA features and is being provided as-is with no warranties. Beta features are not subject to the support SLA of official GA features.
With Elastic Project Monitors, you write tests in an external version-controlled
project using YAML for lightweight monitors and JavaScript or TypeScript for browser monitors.
Then, you use the @elastic/synthetics NPM library’s push command to create
monitors in Kibana.
This approach works well if you want to create both browser monitors and lightweight monitors. It also allows you to configure and update monitors using a GitOps workflow. However, this functionality is in beta and is subject to change.
Get started in Use Project Monitors.
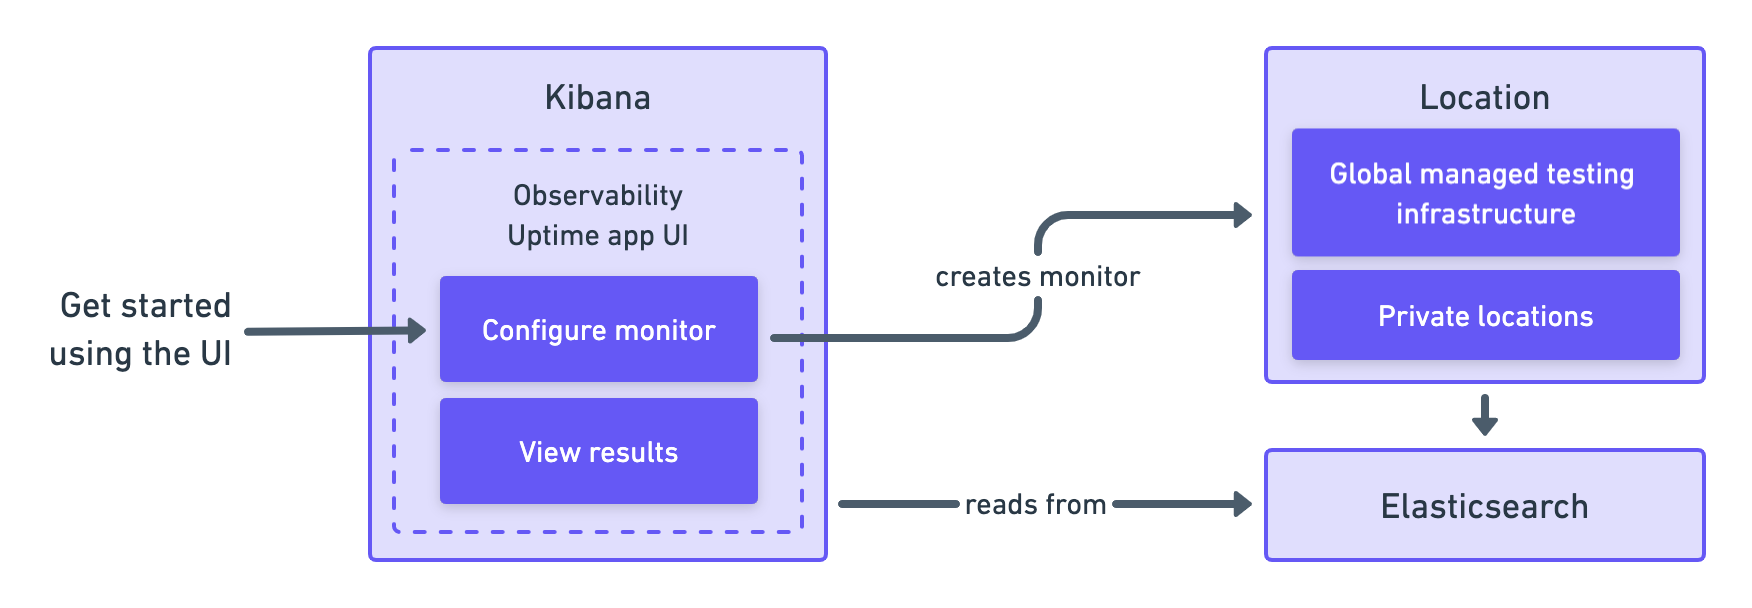
Uptime app
editThis functionality is in beta and is subject to change. The design and code is less mature than official GA features and is being provided as-is with no warranties. Beta features are not subject to the support SLA of official GA features.
The Uptime app is an application in Kibana. You can create monitors directly in the Uptime app using the user interface. To try out this beta functionality, you will need to enable Monitor Management.
This approach works well if you want to configure and update monitors using a UI in your browser. However, this functionality is in beta and is subject to change.
Get started in Use the Uptime app.
To use the Elastic Synthetics integration, see the 8.3 documentation. The Elastic Synthetics integration is similar to the Uptime app approach described above, but contains fewer configuration options and does not allow you to run monitors against Elastic’s global managed testing locations.