Set up monitors
editSet up monitors
editTo set up an uptime monitor, you need to configure the monitor, run it, and send data back to Elasticsearch. After setup is complete, the data will be available in the Uptime app in Kibana to view, analyze, and alert on.
Choose an approach
editThere are two ways to set up an uptime monitor: Heartbeat or the Uptime app.
Heartbeat |
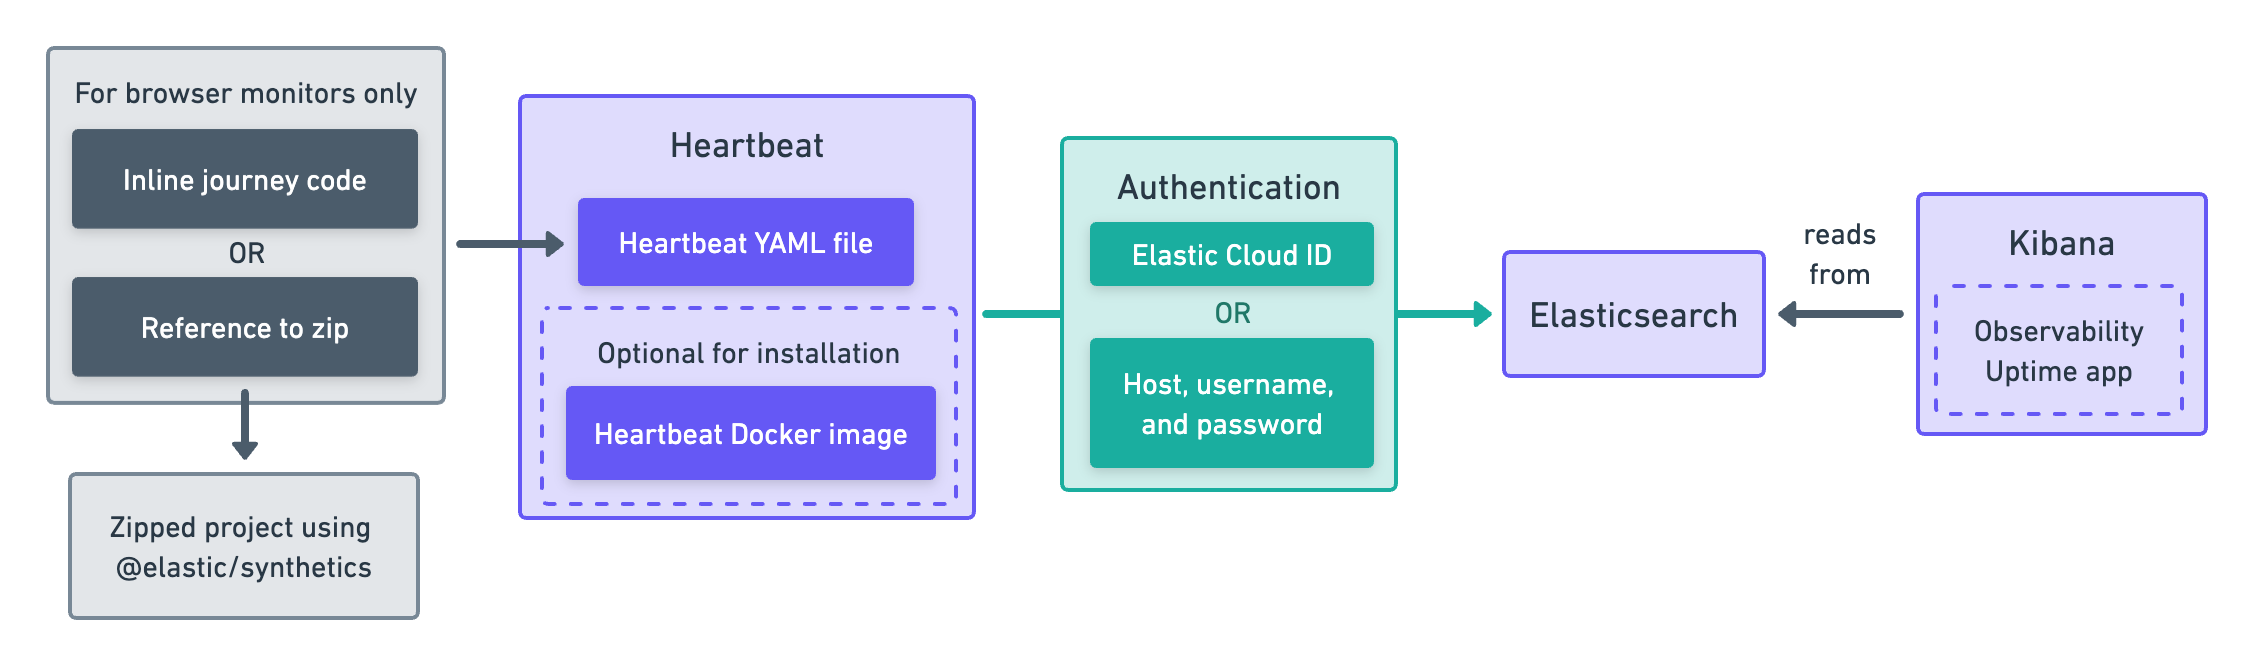
Heartbeat is a lightweight daemon that you install on a remote server to periodically check the status of your services and determine if they are available. Performance data is then gathered and reported back to Heartbeat, where it’s formatted and sent to the Elastic Stack. This approach works well for system administrators wanting to configure monitors using YAML files. Read more in Use Heartbeat.
|
Uptime app |
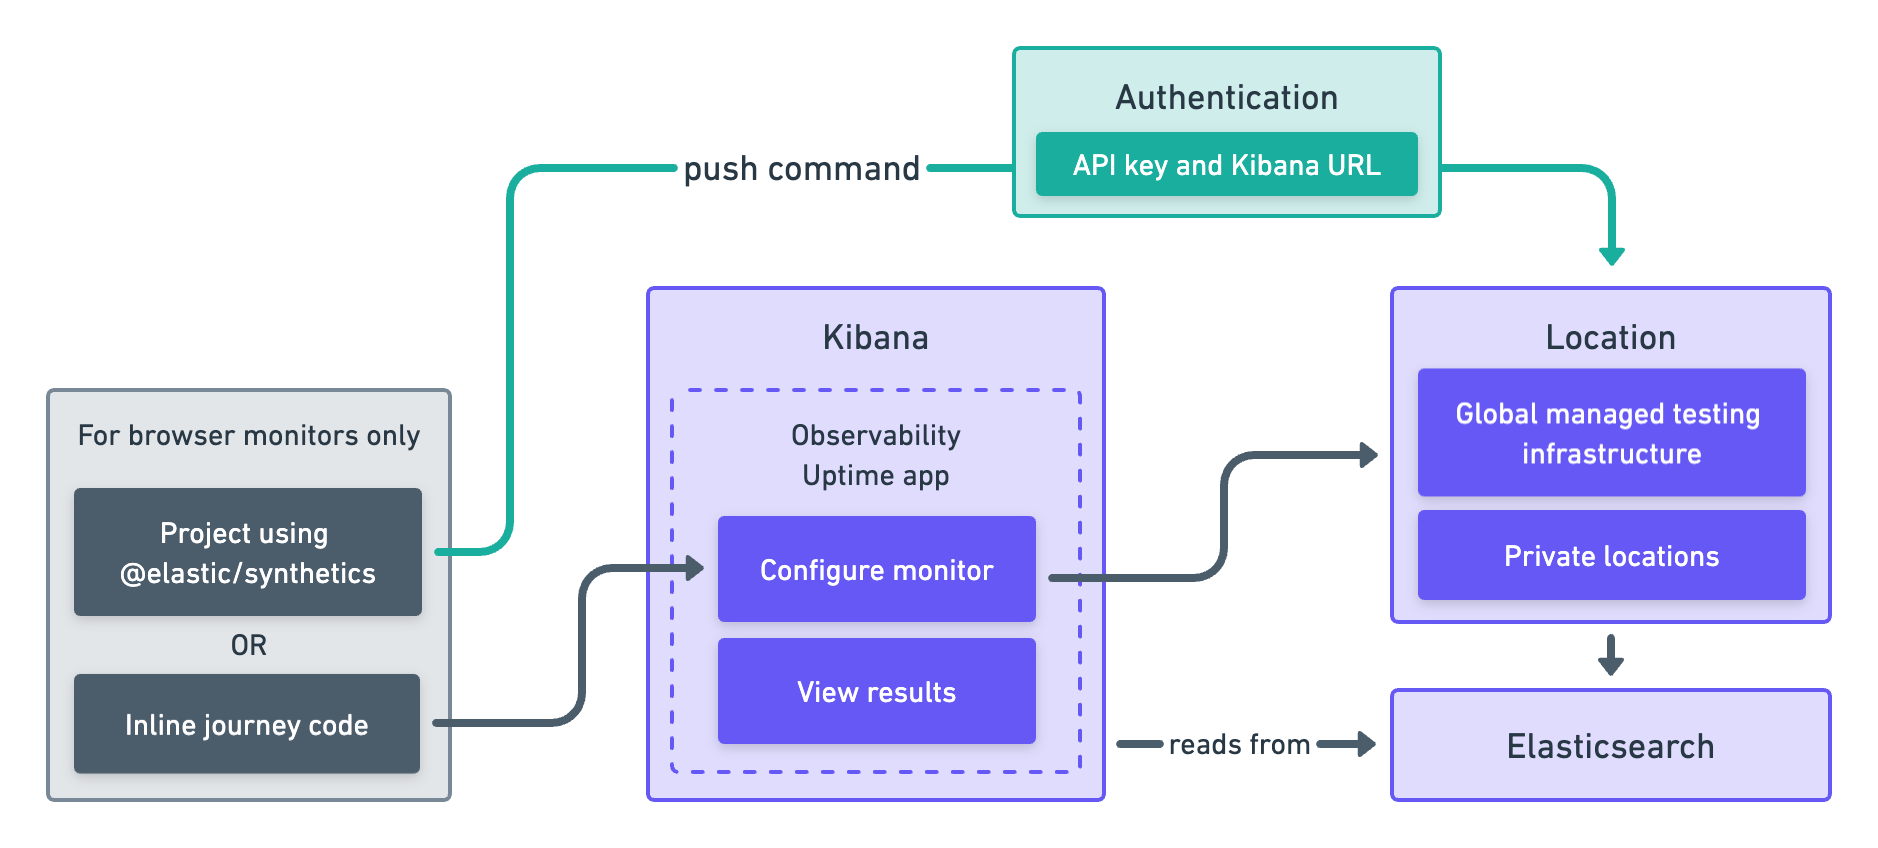
[beta] This functionality is in beta and is subject to change. The design and code is less mature than official GA features and is being provided as-is with no warranties. Beta features are not subject to the support SLA of official GA features. The Uptime app is an application in Kibana. You can now create monitors directly in the Uptime app. To try out this beta functionality, you will need to enable Monitor Management. This approach works well if you want to configure and update monitors using a UI in your browser. However, this functionality is in beta and is subject to change. Read more in Use the Uptime app.
|
To use the Elastic Synthetics integration, see the 8.3 documentation. The Elastic Synthetics integration is similar to the Uptime app approach described above, but contains fewer configuration options and does not allow you to run monitors against Elastic’s global managed testing locations.