Use Heartbeat
editUse Heartbeat
editHeartbeat is a lightweight daemon that you install on a remote server to periodically check the status of your services and determine if they are available. It gathers performance data, formats it, and sends the data to the Elastic Stack.
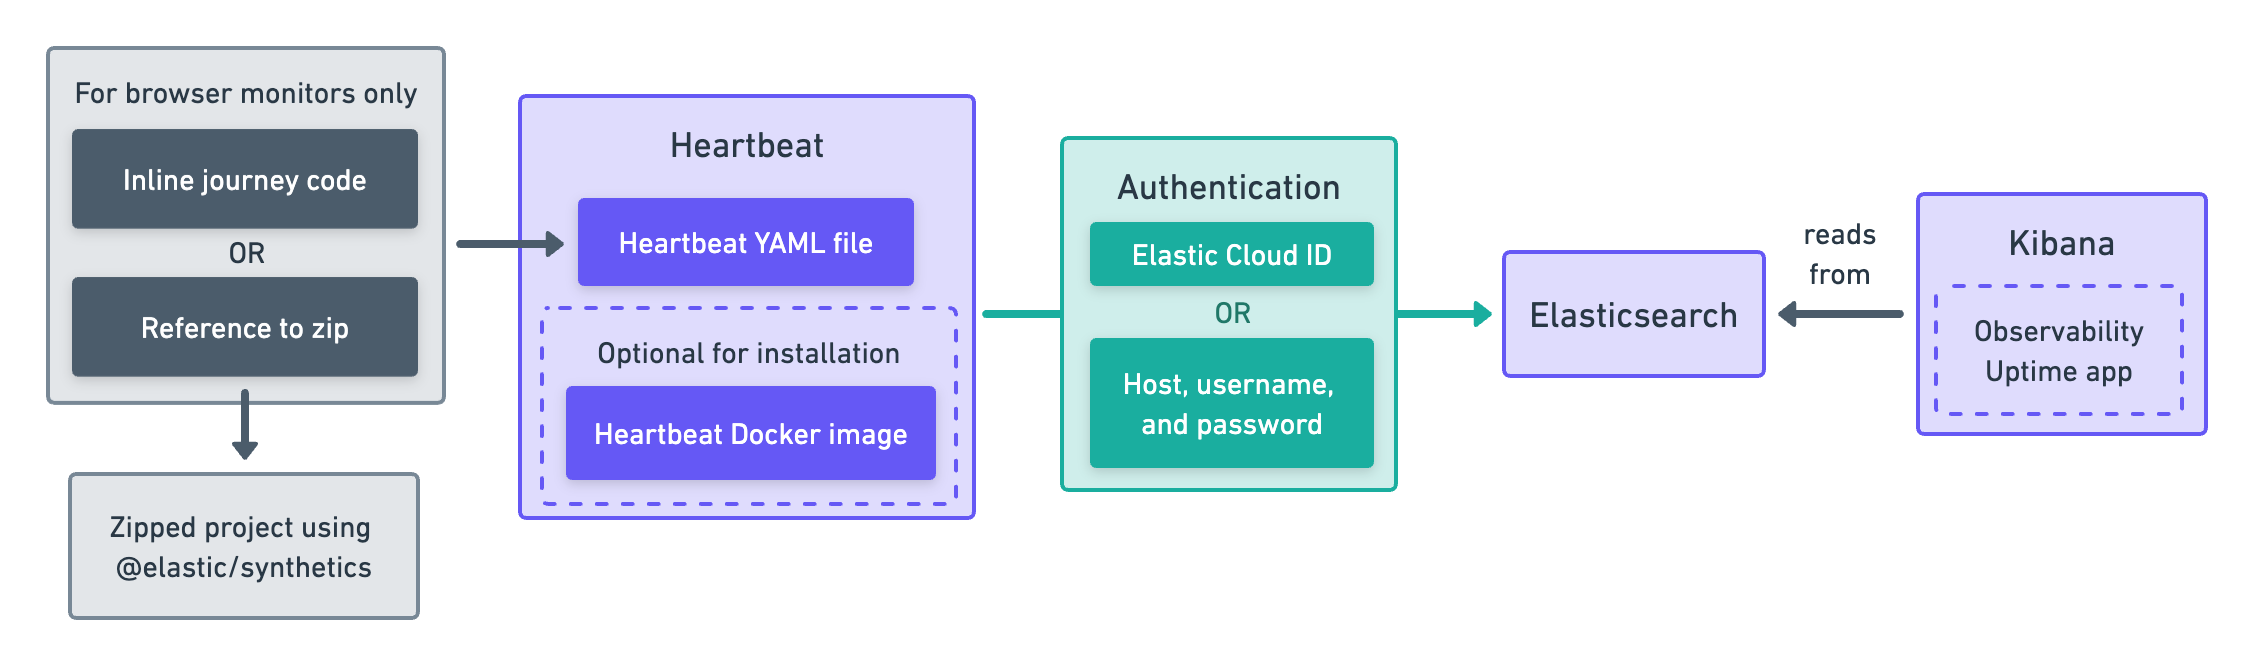
Diagram text description
-
Configure monitors using the Heartbeat YAML file. If configuring a browser monitor, include either:
- Inline journey code
-
Reference to a zip URL (If using a zip URL, you need a Zipped project using
@elastic/synthetics.)
- Optionally, use the Heartbeat Docker image to install Heartbeat.
-
When creating monitors, use either one of the following methods of Authentication:
- Elastic Cloud ID
- Host, username, and password
- Monitors send data to Elasticsearch.
- Kibana, specifically the Observability Uptime app, reads results from Elasticsearch and visualizes those results in the UI.
Pull the Docker image
editElastic provides Docker images that you can use to run monitors. Start by pulling the Heartbeat Docker image.
docker pull docker.elastic.co/beats/heartbeat:8.4.3
Configure
editNext, create a heartbeat.yml configuration file.
The example below shows how to configure an http monitor, one of four types of monitors.
heartbeat.monitors:
- type: http
  id: service-status
  name: Service Status
  service.name: my-apm-service-name
  hosts: ["http://localhost:80/service/status"]
  check.response.status: [200]
  schedule: '@every 5s'
|
Each |
Read more about configuration options in Configure Heartbeat monitors.
If you are setting up a browser monitor, see Write a synthetic test
for more details on writing synthetic tests. You can add tests directly to the configuration file
using inline or reference tests stored elsewhere using zip_url.
Connect to the Elastic Stack
editAfter configuring the monitor, run it in Docker and connect the monitor to the Elastic Stack.
You’ll need to retrieve your Elasticsearch credentials for either an Elastic Cloud ID or another Elasticsearch Cluster.
The example below, shows how to run synthetics tests indexing data into Elasticsearch.
You’ll need to insert your actual cloud.id and cloud.auth values to successfully index data to your cluster.
docker run \
  --rm \
  --name=heartbeat \
  --user=heartbeat \
  --volume="$PWD/heartbeat.yml:/usr/share/heartbeat/heartbeat.yml:ro" \
  --cap-add=NET_RAW \
  docker.elastic.co/beats/heartbeat:8.4.3 heartbeat -e \
  -E cloud.id={cloud-id} \
  -E cloud.auth=elastic:{cloud-pass}
If you aren’t using Elastic Cloud, replace -E cloud.id and -E cloud.auth with your Elasticsearch hosts,
username, and password:
docker run \
  --rm \
  --name=heartbeat \
  --user=heartbeat \
  --volume="$PWD/heartbeat.yml:/usr/share/heartbeat/heartbeat.yml:ro" \
  --cap-add=NET_RAW \
  docker.elastic.co/beats/heartbeat:8.4.3 heartbeat -e \
  -E output.elasticsearch.hosts=["localhost:9200"] \
  -E output.elasticsearch.username=elastic \
  -E output.elasticsearch.password=changeme
Note the --volume option, which mounts local directories into the
container. Here, we mount the heartbeat.yml from the working directory,
into Heartbeat’s expected location for heartbeat.yml.
Elastic Synthetics runs Chromium without the extra protection of its process
sandbox
for greater compatibility with Linux server distributions.
Add the sandbox: true option to a given browser monitor in Heartbeat to enable sandboxing.
This may require using a custom seccomp policy with docker, which brings its own added risks.
This is generally safe when run against sites whose content you trust,
and with a recent version of Elastic Synthetics and Chromium.
View in Kibana
editHeartbeat is now sending synthetic monitoring data to the Elastic Stack. Navigate to the Uptime app in Kibana, where you can see screenshots of each run, set up alerts in case of test failures, and more.
If a test does fail (shown as down in the Uptime app), you’ll be able to view the step script that failed,
any errors, and a stack trace.
See Visualize for more information.