Monitor Amazon Web Services (AWS) with Elastic Agent
editMonitor Amazon Web Services (AWS) with Elastic Agent
editIn this tutorial, you’ll learn how to deploy Elastic Agent and monitor your AWS infrastructure with Elastic Observability.
What you’ll learn
editYou’ll learn how to:
- Collect VPC flow logs and S3 access logs from AWS.
- Collect billing and EC2 metrics from CloudWatch.
- Install and configure Elastic Agent to stream the logs and metrics to Elasticsearch.
- Visualize your data in Kibana.
First you’ll focus on monitoring logs, then you’ll add metrics after you’ve confirmed that your logs are streaming to Elasticsearch.
Before you begin
editCreate a deployment using our hosted Elasticsearch Service on Elastic Cloud. The deployment includes an Elasticsearch cluster for storing and searching your data, and Kibana for visualizing and managing your data. To learn more, refer to Spin up the Elastic Stack.
In this tutorial, we assume that:
- Your VPC flow logs are already exported to an S3 bucket. To learn how, refer to the AWS documentation about publishing flow logs to an S3 bucket.
- You have EC2 instances in your AWS account. By default, Amazon EC2 sends metric data to CloudWatch. If you don’t have an EC2 instance in your account, refer to the AWS documentation to learn how to launch, connect to, and use a Linux instance.
Step 1: Create a queue and notifications for VPC flow logs
editIn this step, you create an Amazon Simple Queue Service (SQS) queue and configure the S3 bucket containing your VPC flow logs to send a message to the SQS queue whenever new logs are present in the S3 bucket.
You should already have an S3 bucket that contains exported VPC flow logs. If you don’t, create one now. To learn how, refer to publishing flow logs to an S3 bucket.
Create an SQS queue
editTo create the SQS queue:
-
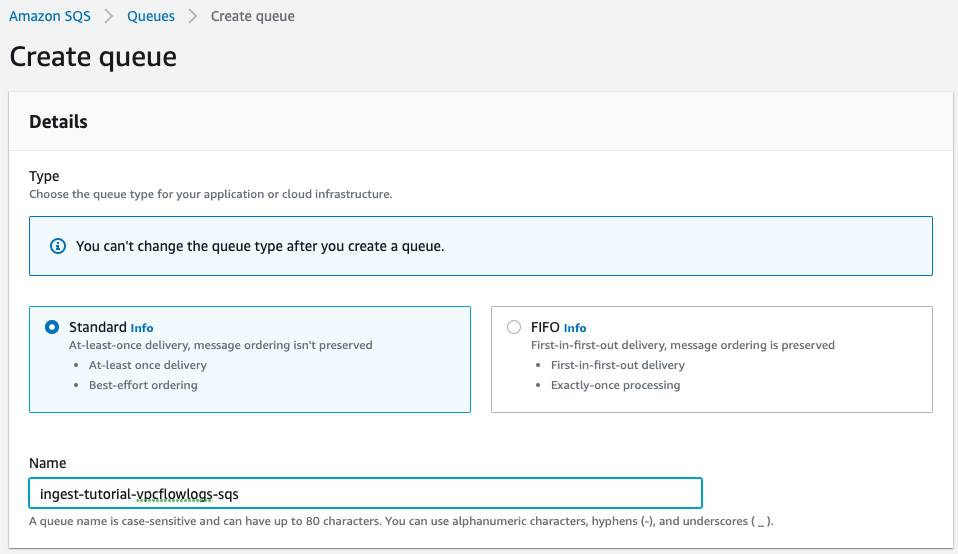
Go to the SQS console and create an SQS queue. Create a standard SQS queue that uses the default settings.
Make sure you create the SQS queue in the same region as the S3 bucket.
-
Edit the queue you created and use a JSON object to define an advanced access policy. The access policy allows S3 ObjectCreated events to be sent to the queue.
{
  "Version": "2012-10-17",
  "Id": "example-ID",
  "Statement": [
    {
      "Sid": "example-statement-ID",
      "Effect": "Allow",
      "Principal": {
        "AWS": "*"
      },
      "Action": "SQS:SendMessage",
      "Resource": "<sqs-arn>",
      "Condition": {
        "StringEquals": {
          "aws:SourceAccount": "<source-account>"
        },
        "ArnLike": {
          "aws:SourceArn": "<s3-bucket-arn>"
        }
      }
    }
  ]
}
Replace
<sqs-arn>with the ARN of the SQS queue.Replace
<source-account>with your AWS account number.Replace
<s3-bucket-arn>with the ARN of the S3 bucket containing your VPC flow logs.Save your changes and make a note of the queue URL. You will need it later when you configure the AWS integration in Kibana.
Enable event notification on the S3 bucket
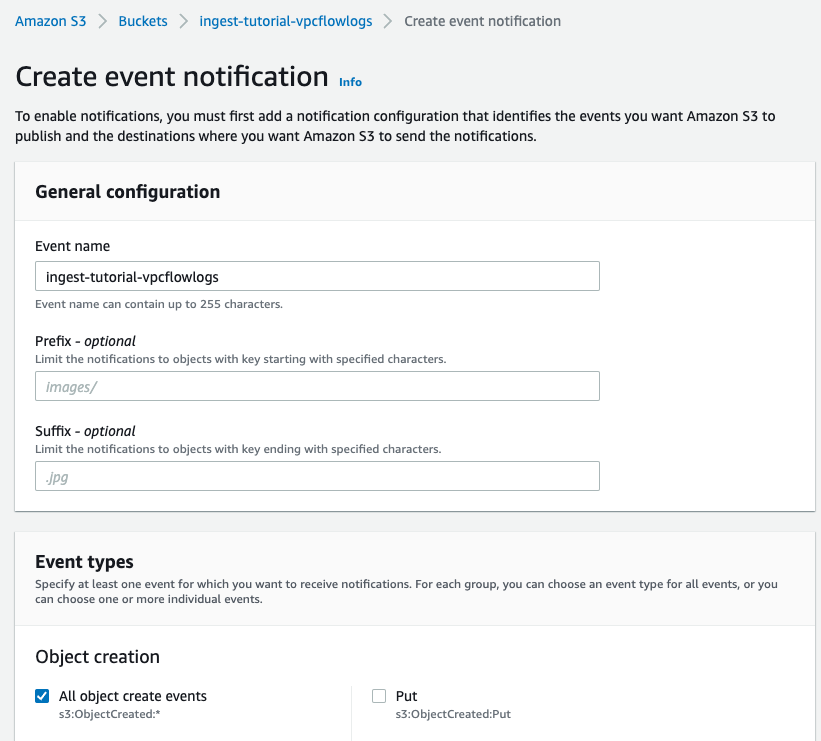
editNow that your queue is created, go to the properties of the S3 bucket containing the VPC flow logs and enable event notification:
- Click Create event notification.
-
For the event type, select All object create events to send a notification for every object creation event.
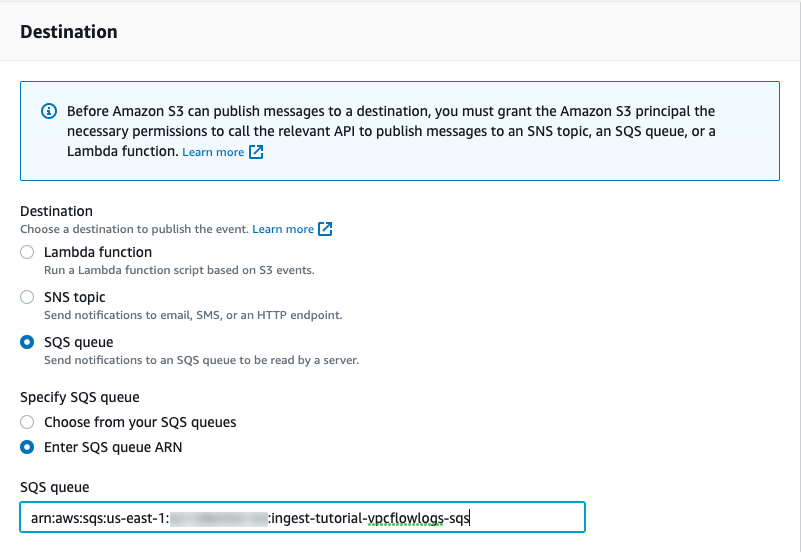
-
For the destination, select the SQS queue you just created.
Step 2: Install the AWS integration
editIn this step, you install the AWS integration in Kibana. The AWS integration contains inputs for collecting a variety of logs and metrics from AWS. You’ll start out by configuring the integration to collect VPC flow logs. After you get that working, you’ll learn how to add S3 access logs.
To add the integration:
-
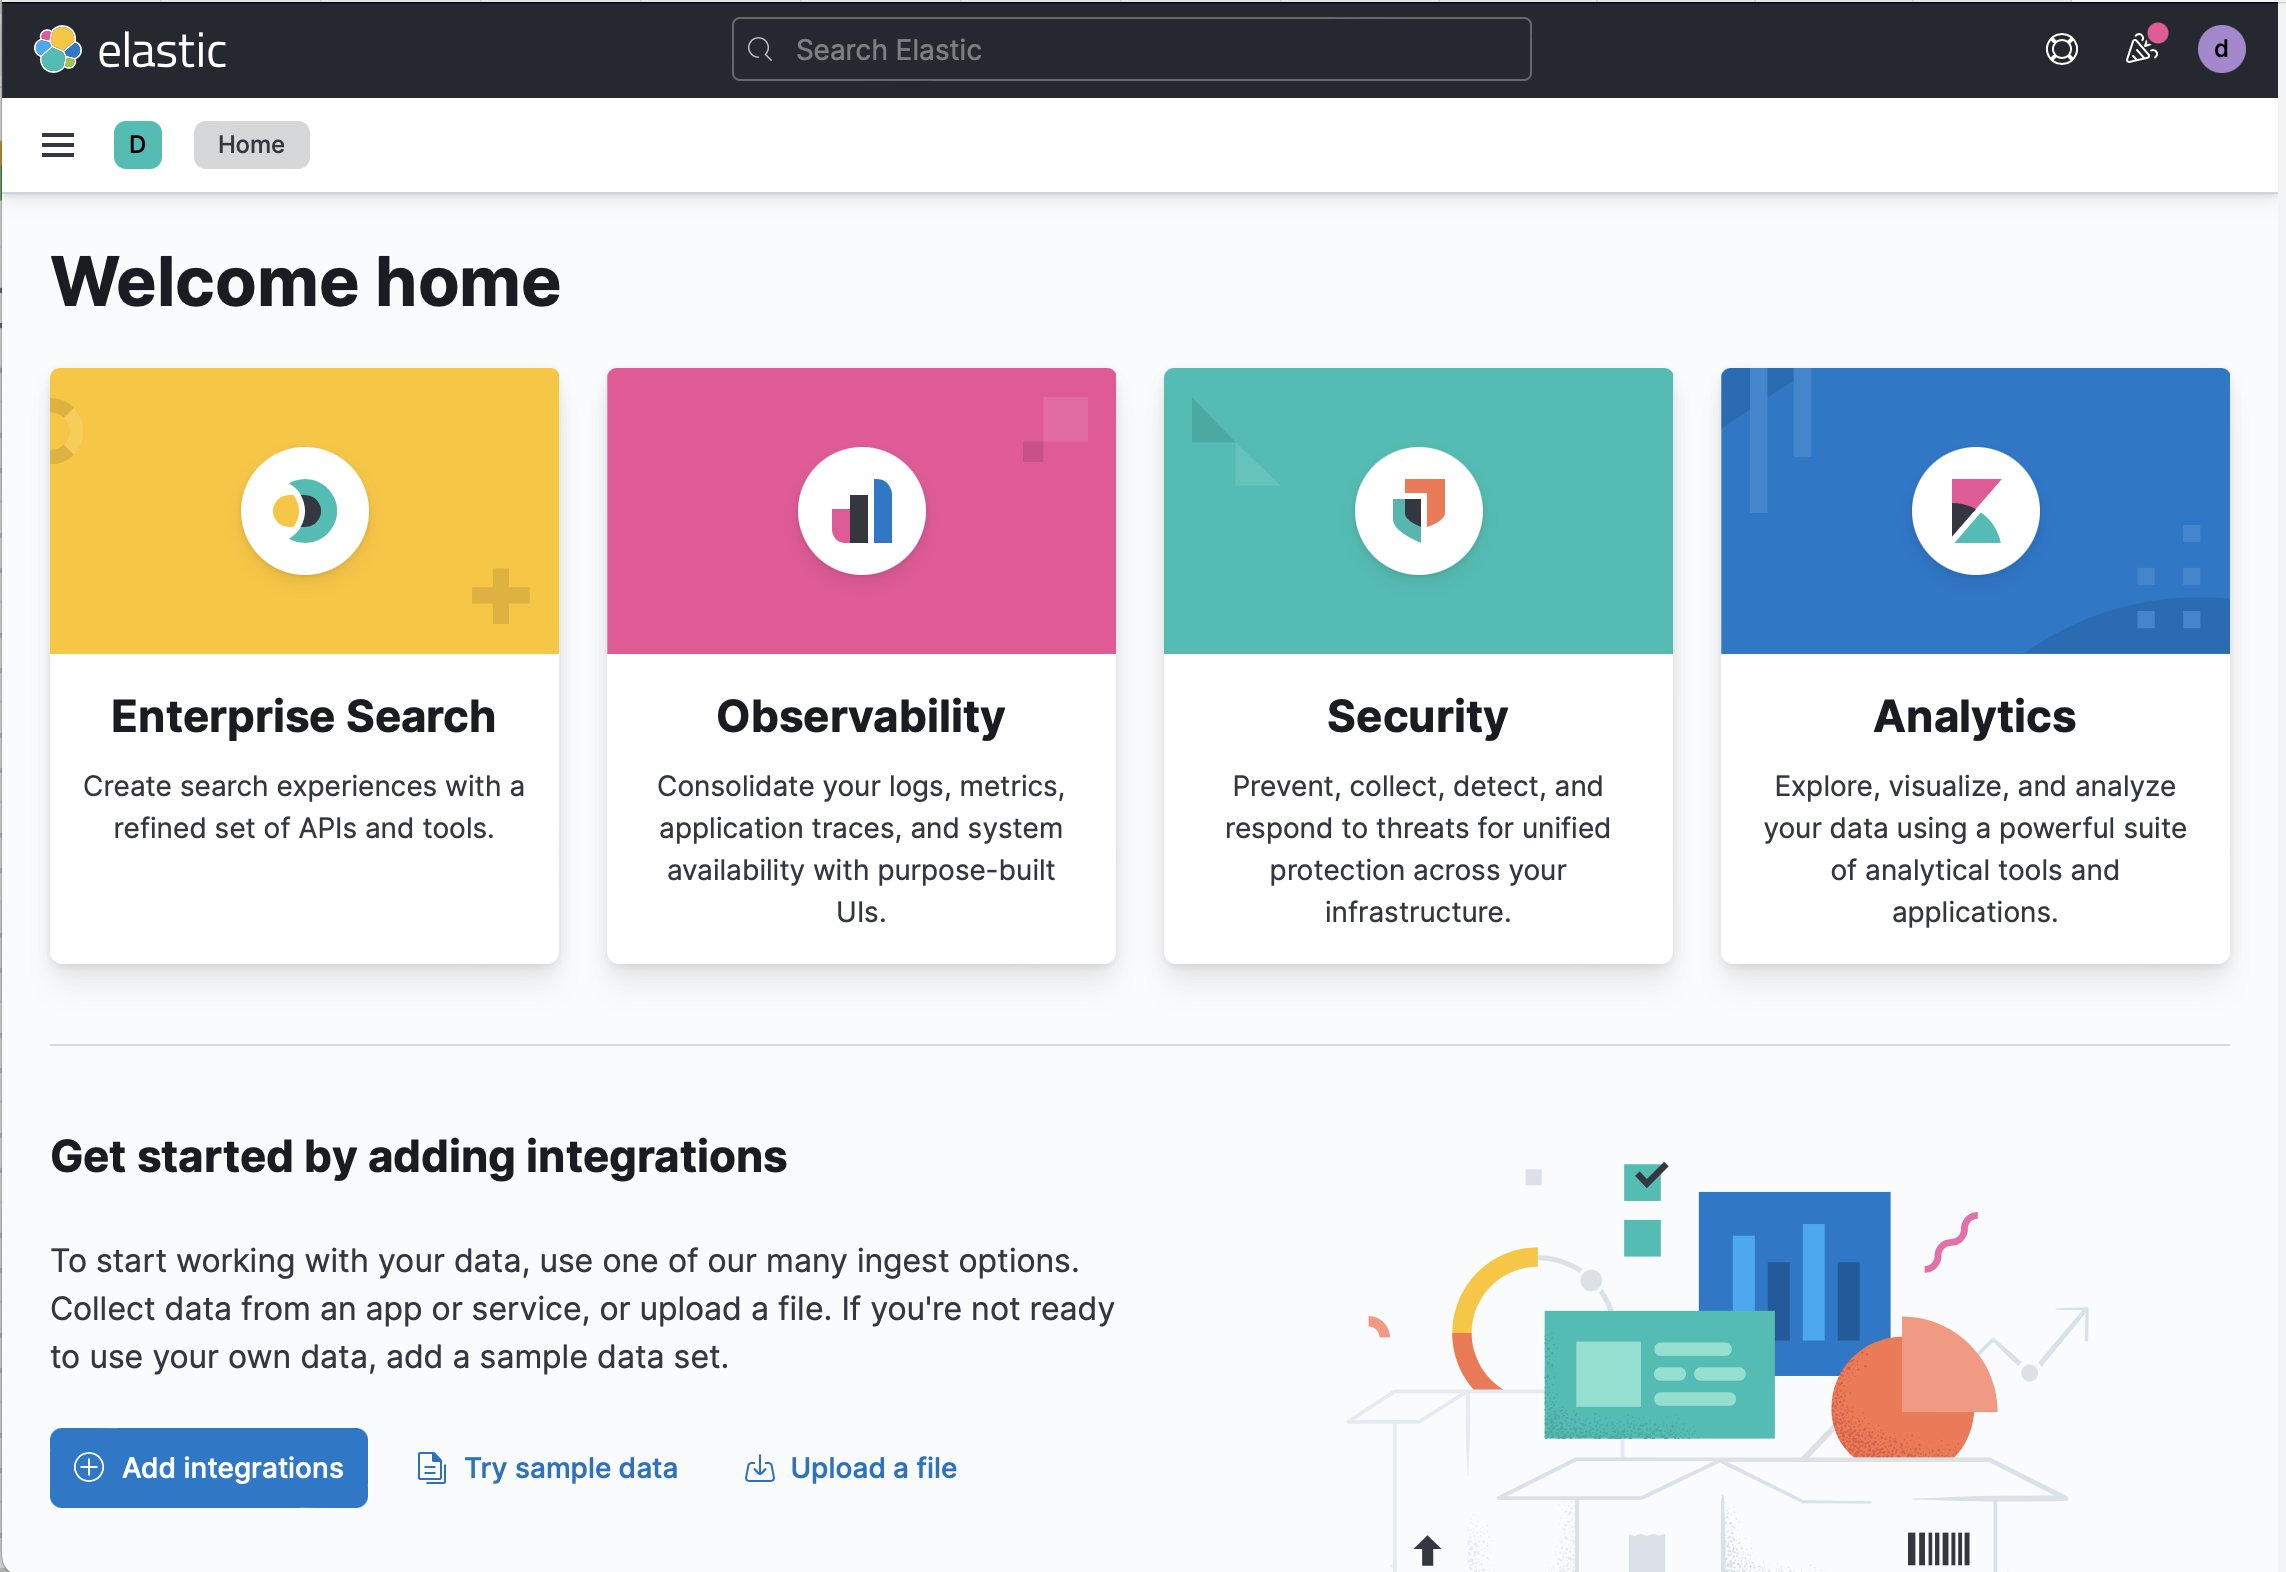
Go to the Kibana home page and click Add integrations.
- In the query bar, search for AWS and select the AWS integration to see more details about it.
- Click Add AWS.
-
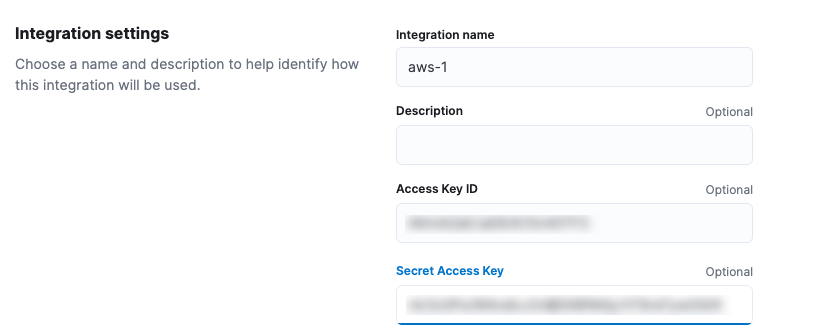
Configure the integration name and optionally add a description.
If you don’t see options for configuring the integration, you’re probably in a workflow designed for new deployments. Follow the steps, then return to this tutorial when you’re ready to configure the integration.
-
Specify the AWS credentials required to connect to AWS and read log files. Here we show how to use an AWS access key ID and secret, but there are a few other ways to provide AWS credentials. To learn more, refer to the AWS integration documentation.
The account you specify must have at least the following privileges:
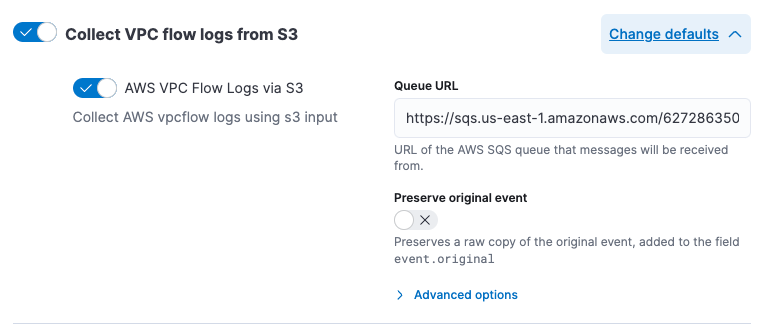
{ "Version": "2012-10-17", "Statement": [ { "Action": [ "s3:GetObject", "sqs:ReceiveMessage", "sqs:ChangeMessageVisibility", "sqs:DeleteMessage" ], "Effect": "Allow", "Resource": "*" } ] } - Turn off all data collection selectors except Collect VPC flow logs from S3.
-
Change defaults and in the Queue URL field, specify the URL of the SQS queue you created earlier.
- Click Save and continue. This step takes a minute or two to complete. When it’s done, you’ll have an agent policy that contains the AWS configuration you just specified.
A popup should appear that prompts you to Add Elastic Agent to your hosts.
Step 3: Install and run an Elastic Agent on your machine
editYou can install Elastic Agent on any host that can access the AWS account and forward events to Elasticsearch.
-
In the popup, click Add Elastic Agent to your hosts to open the Add agent flyout.
If you accidentally closed the popup, go to Fleet → Agents, then click Add agent to access the installation instructions.
The Add agent flyout has two options: Enroll in Fleet and Run standalone. The default is to enroll the agents in Fleet, as this reduces the amount of work on the person managing the hosts by providing a centralized management tool in Kibana.
-
The enrollment token you need should already be selected.
The enrollment token is specific to the Elastic Agent policy that you just created. When you run the command to enroll the agent in Fleet, you will pass in the enrollment token.
- To download, install, and enroll the Elastic Agent, select your host operating system and copy the installation command shown in the instructions.
- Run the command on the host where you want to install Elastic Agent.
It takes a few minutes for Elastic Agent to enroll in Fleet, download the configuration specified in the policy, and start collecting data. You can wait to confirm incoming data, or close the window.
What have you achieved so far?
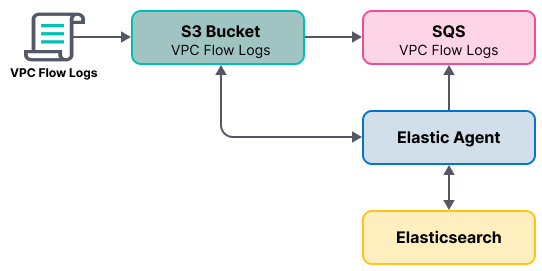
VPC flow logs are sent to an S3 bucket, which sends a notification to the SQS queue. When Elastic Agent detects a new message in the queue, it uses the information in the message to retrieve flow logs from the S3 bucket. Elastic Agent processes each message, parses it into fields, and then sends the data to Elasticsearch.
Step 4: Collect S3 access logs
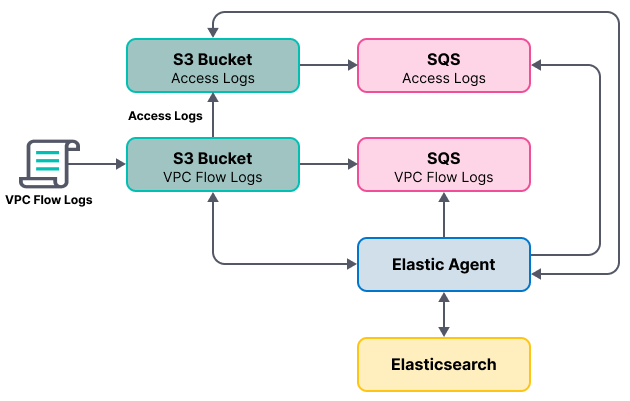
editNext, you’ll collect S3 access logs generated by the bucket that contains VPC flow logs. You could use any S3 bucket to generate S3 access logs, but to avoid creating extra buckets in AWS, you’ll use a bucket that already exists.
You create a new S3 bucket and queue for the access logs, then configure the older S3 bucket to generate access logs.
When you’re done, your monitoring architecture will look like this:
Create a bucket and queue for S3 access logs
editTo create the new bucket and queue for S3 access logs:
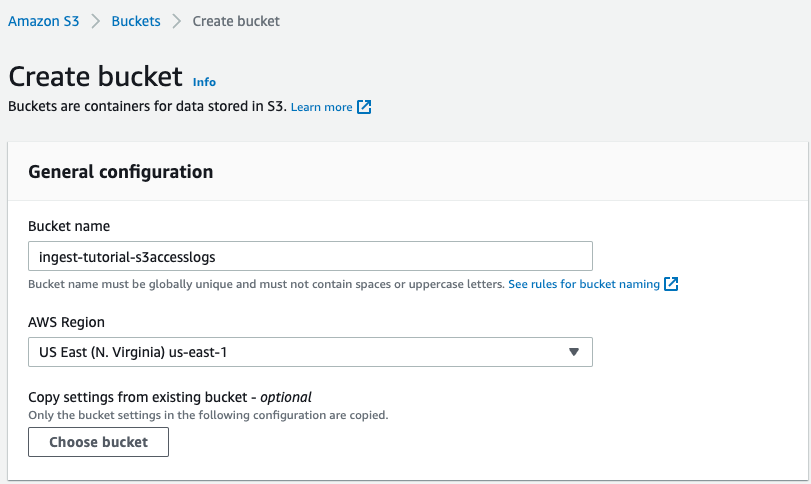
-
In the AWS S3 console, click Create bucket. Give the bucket a name and specify the region where you want it deployed.
Make sure you create the S3 bucket and SQS queue (next step) in the same region as the bucket containing VPC flow logs.
- Follow the steps you learned earlier to create an SQS queue and edit the access policy (use the ARNs of the new S3 bucket and queue). Make a note of the queue URL because you will need it later when you configure S3 access log collection.
- Configure the new S3 bucket to send notifications to the new queue when objects are created (follow the steps you learned earlier).
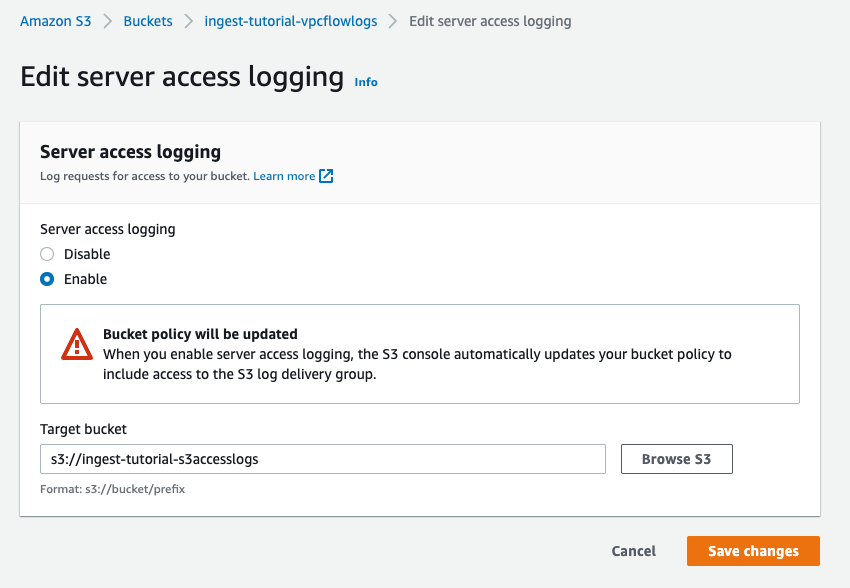
-
Go back to the old S3 bucket (the one that contains VPC flow logs), and under Properties, edit the Server access logging properties. Enable server access logging, and select the new bucket you created as the target bucket.
Now you’re ready to edit the agent policy and configure S3 access log collection.
Configure the integration to collect S3 access logs
editThe Elastic Agent you’ve deployed is already running and collecting VPC flow logs. Now you need to edit the agent policy and configure the integration to collect S3 access logs.
- From the main menu in Kibana, go to Fleet → Agents and click the policy your agent is using.
- Edit the AWS integration policy and turn on the Collect S3 access logs from S3 selector.
- In the Queue URL field, enter the URL of the SQS queue you created for S3 access log notifications, then save and deploy your changes.
It takes a few minutes for Elastic Agent to update its configuration and start collecting data.
Step 5: Visualize AWS logs
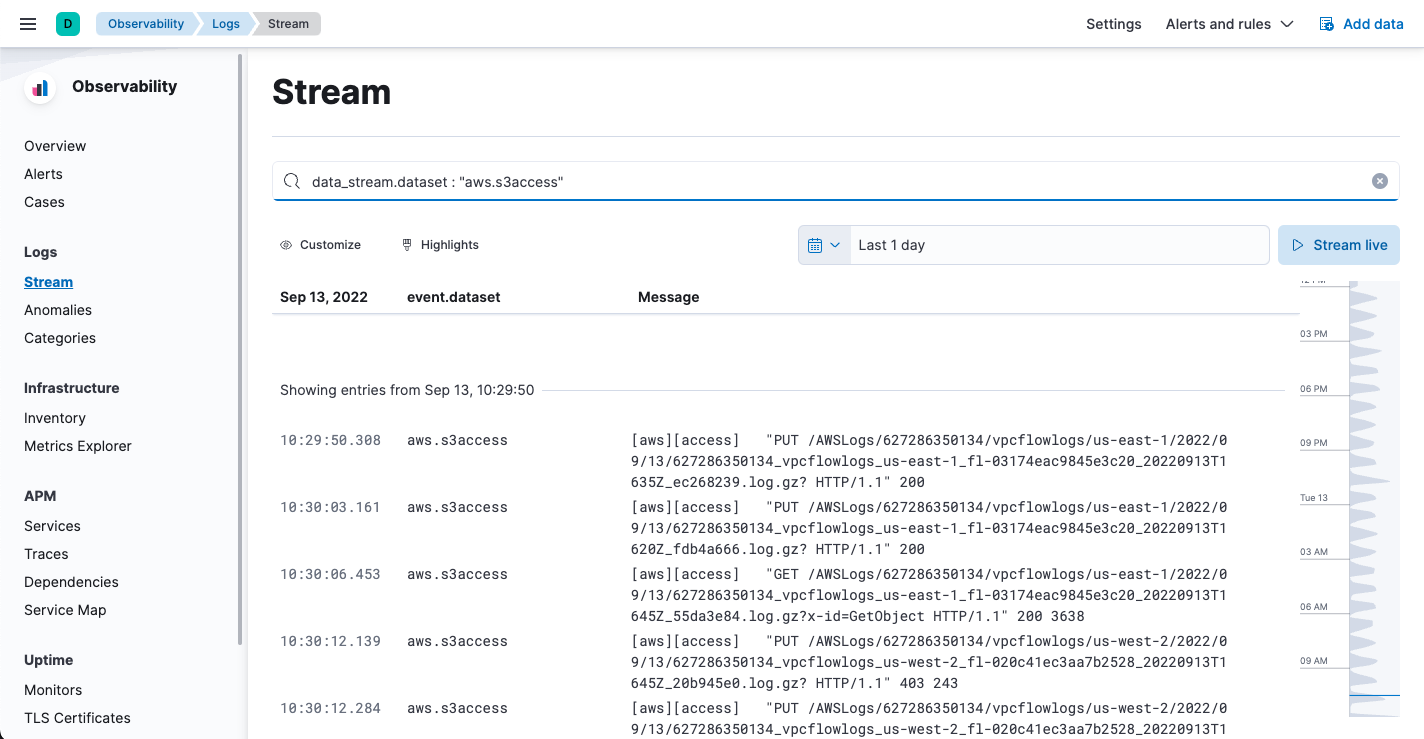
editNow that logs are streaming into Elasticsearch, you can visualize them in Kibana. To see
the raw logs, open the main menu in Kibana, then click Logs. Notice that you
can filter on a specific data stream. This example uses
data_stream.dataset : "aws.s3access" to show S3 access logs:
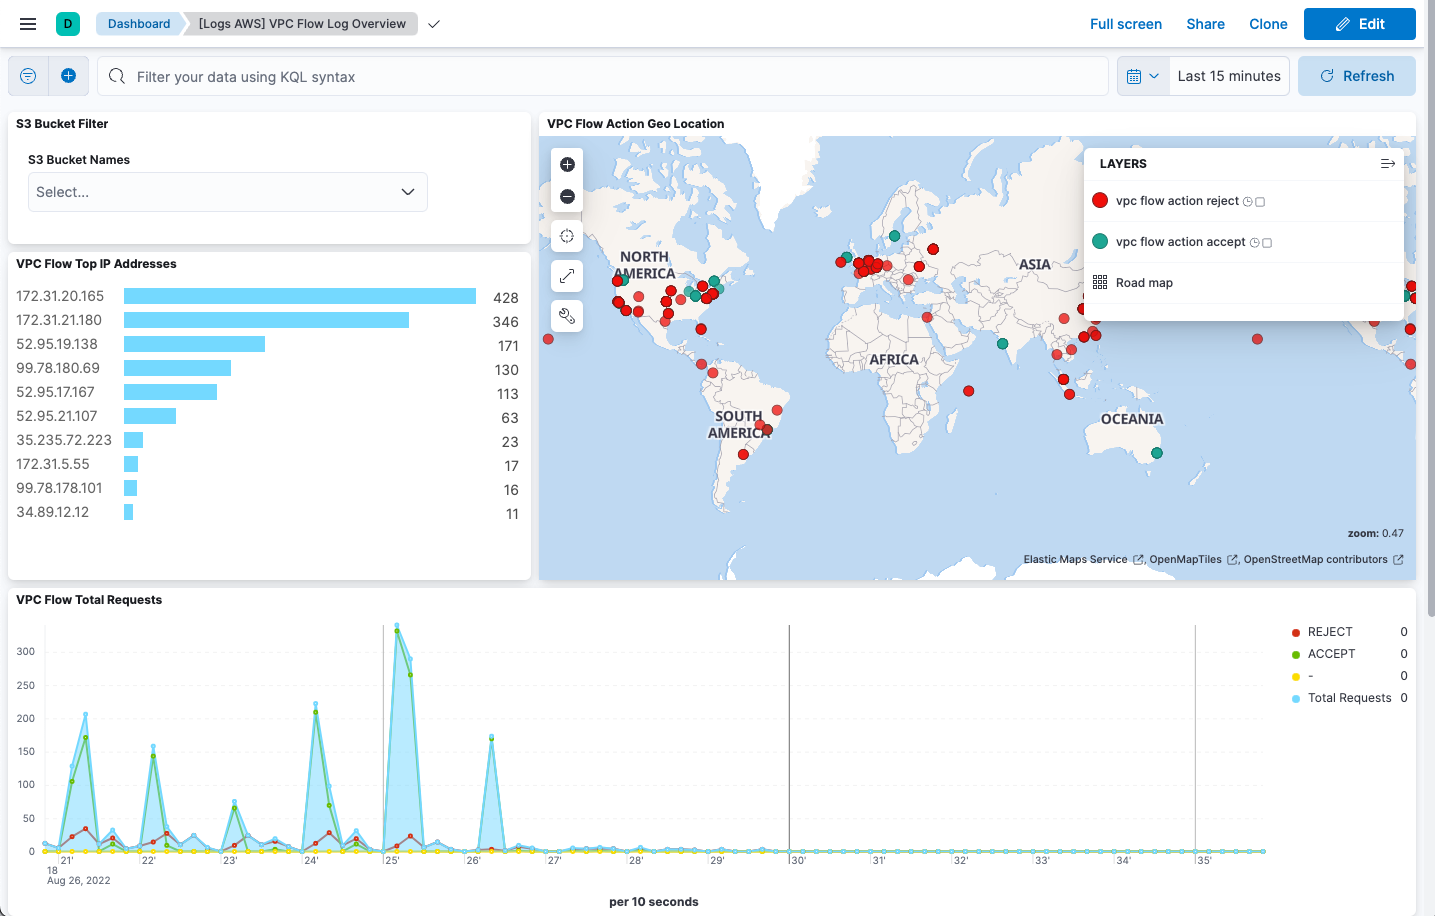
The AWS integration also comes with pre-built dashboards that you can use to
visualize the data. In Kibana, open the main menu and click Dashboard. Search
for VPC Flow and select the dashboard called
[Logs AWS] VPC Flow Log Overview:
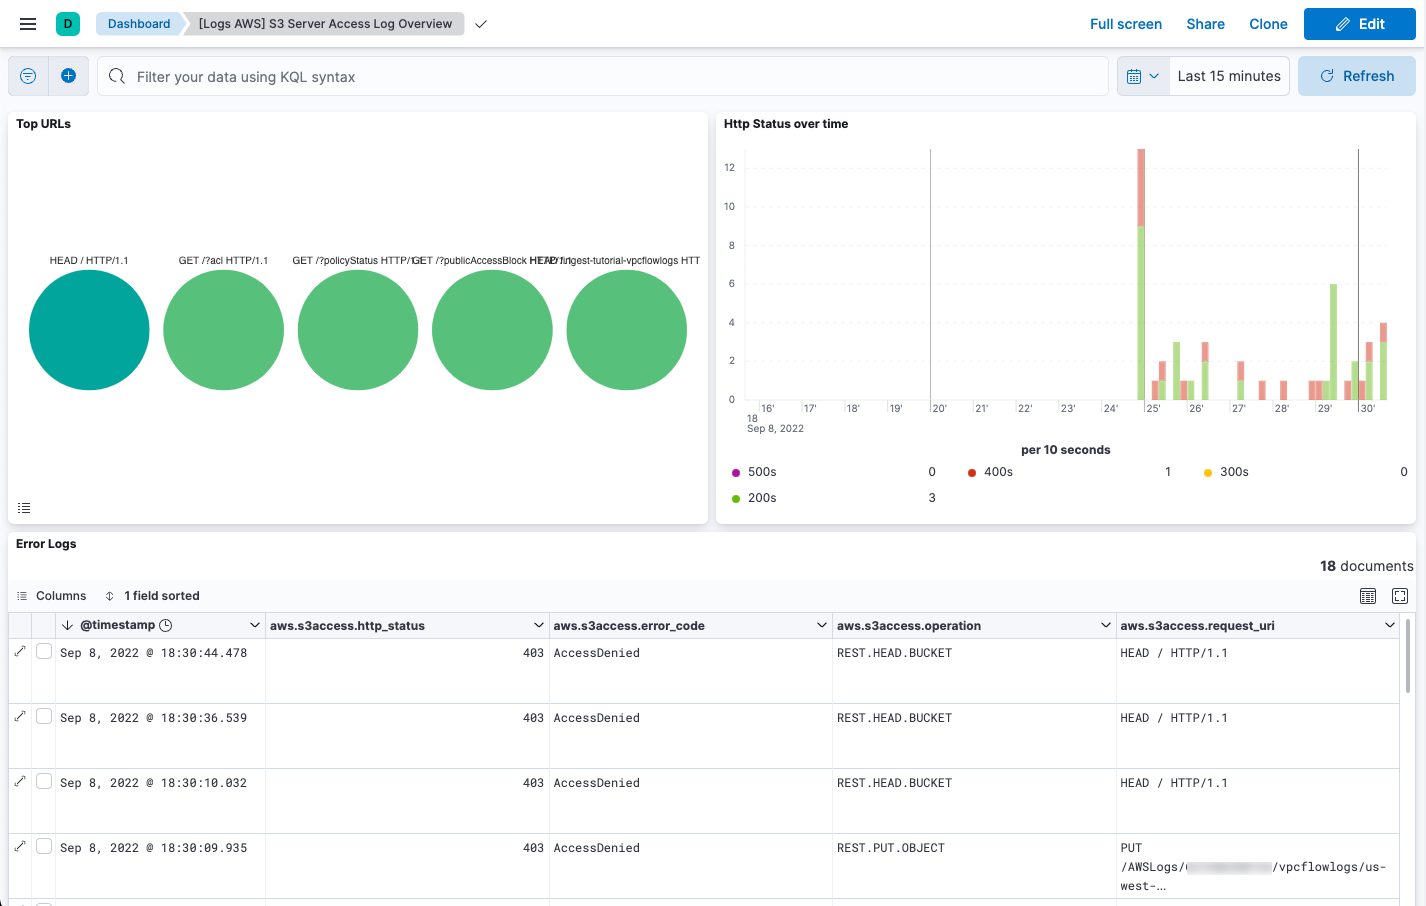
Next, open the dashboard called [Logs AWS] S3 Server Access Log Overview:
Step 6: Collect AWS metrics
editIn this step, you configure the AWS integration to periodically fetch monitoring metrics from AWS CloudWatch using GetMetricData API for AWS services. Specifically you’ll learn how to stream and process billing and EC2 metrics.
Extra AWS charges on CloudWatch API requests may be generated if you configure the AWS integration to collect metrics. To learn more, refer to the Amazon CloudWatch pricing page.
-
Make sure the AWS account used to collect metrics from CloudWatch has at least the following permissions:
{ "Version": "2012-10-17", "Statement": [ { "Action": [ "ec2:DescribeInstances", "ec2:DescribeRegions", "cloudwatch:GetMetricData", "cloudwatch:ListMetrics", "sts:GetCallerIdentity", "iam:ListAccountAliases", "tag:getResources", "ce:GetCostAndUsage" ], "Effect": "Allow", "Resource": "*" } ] } - From the main menu in Kibana, go to Fleet → Agents and click the policy your agent is using.
-
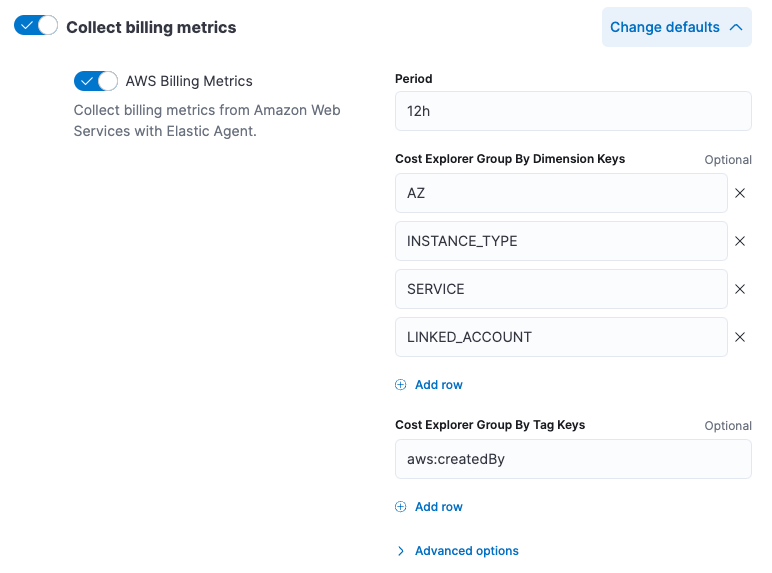
Edit the AWS integration policy and turn on the Collect billing metrics selector. You can accept the defaults.
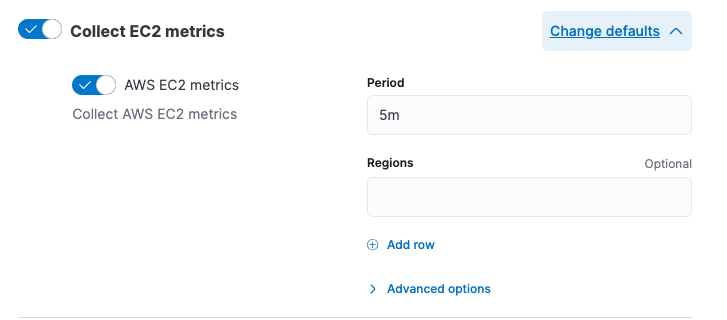
-
Also turn on the Collect EC2 metrics selector. Optionally change the defaults, then save and deploy your changes.
It takes a few minutes for Elastic Agent to update its configuration and start collecting data.
Step 7: Visualize AWS metrics
editNow that the metrics are streaming into Elasticsearch, you can visualize them in Kibana.
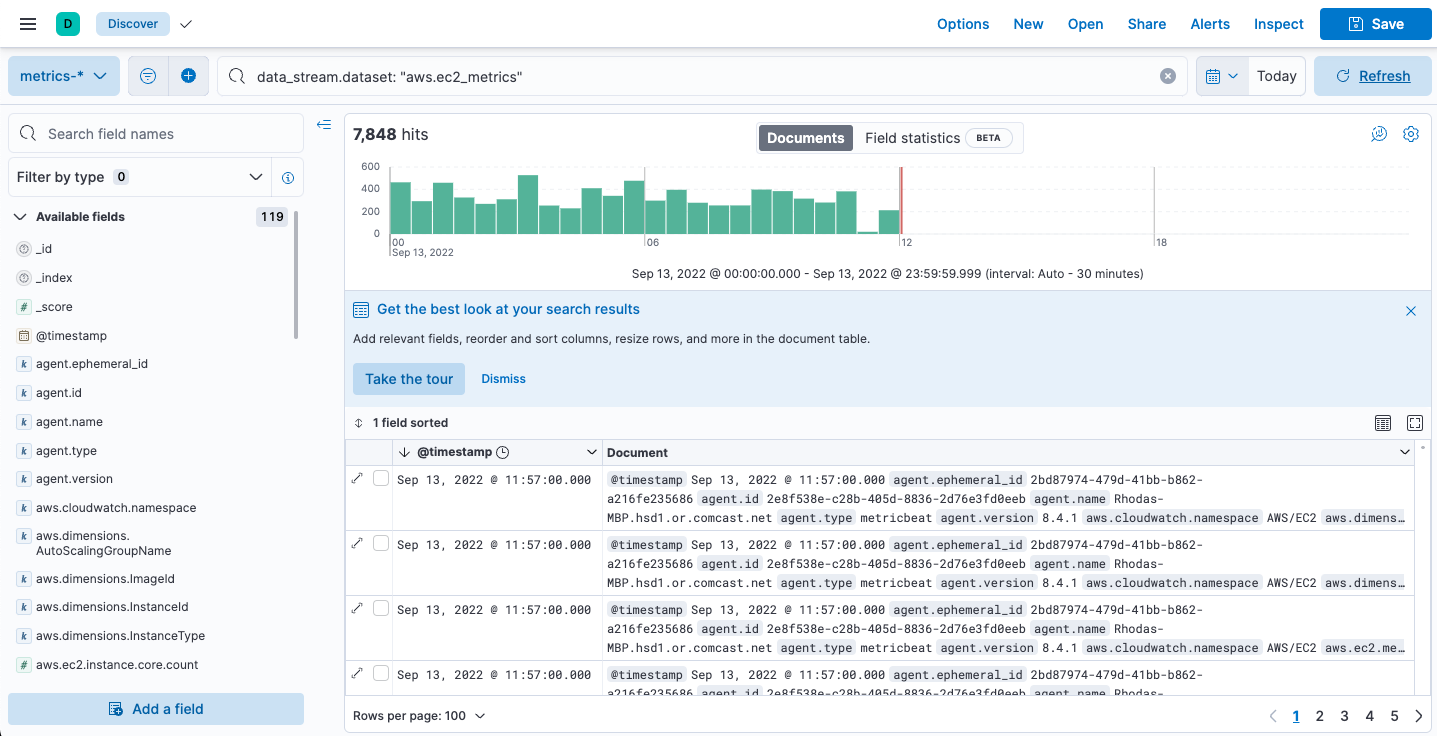
In Kibana, open the main menu and click Discover. Select the metrics-*
data view, then filter on data_stream.dataset: "aws.ec2_metrics":
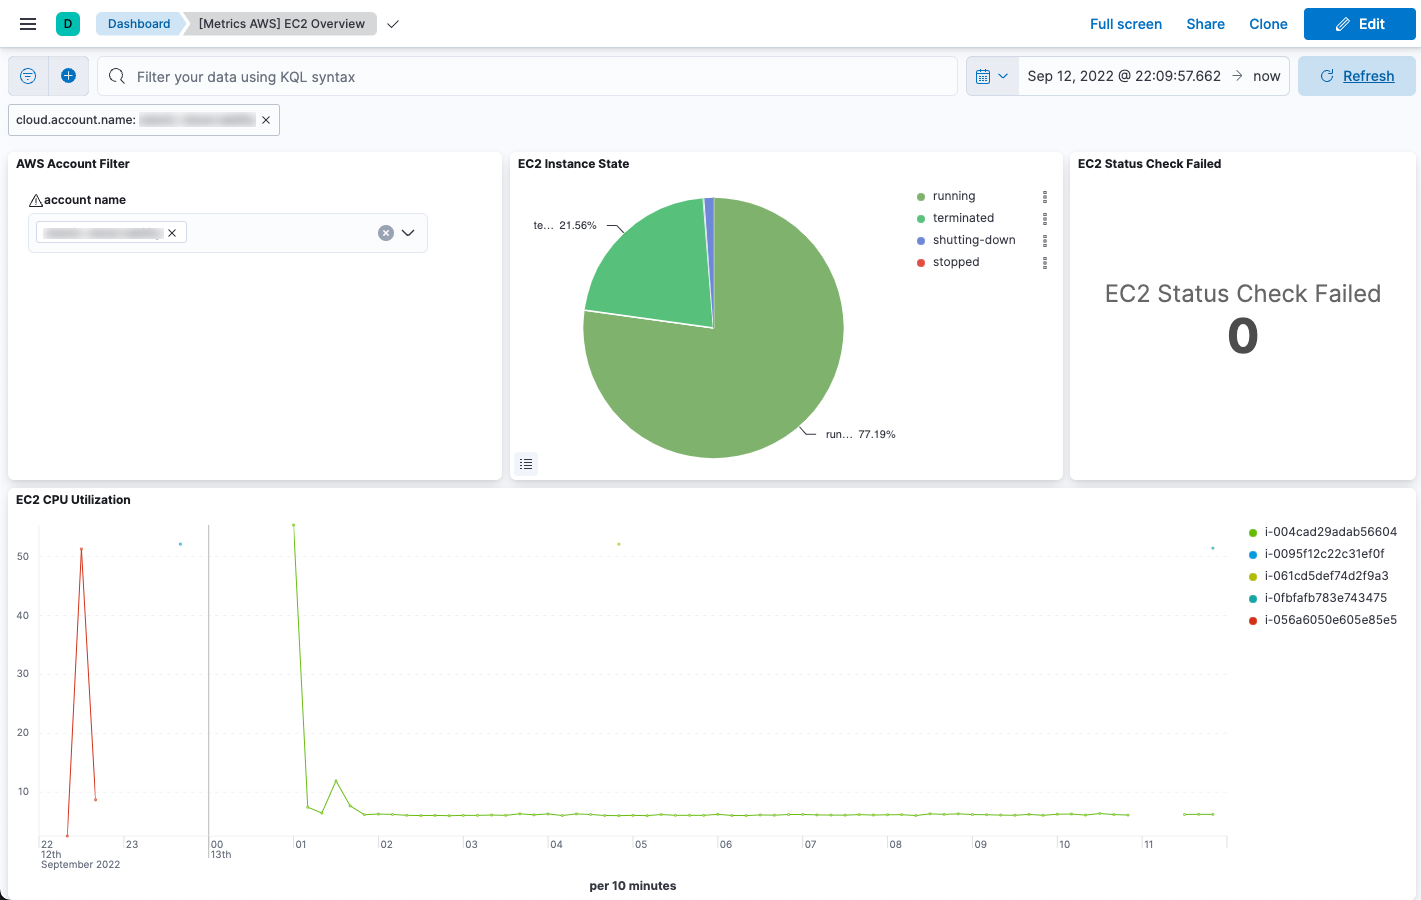
The AWS integration also comes with pre-built dashboards that you can use to visualize the data. In Kibana, open the main menu and click Dashboard.
Search for EC2 and select the dashboard called [Metrics AWS] EC2 Overview:
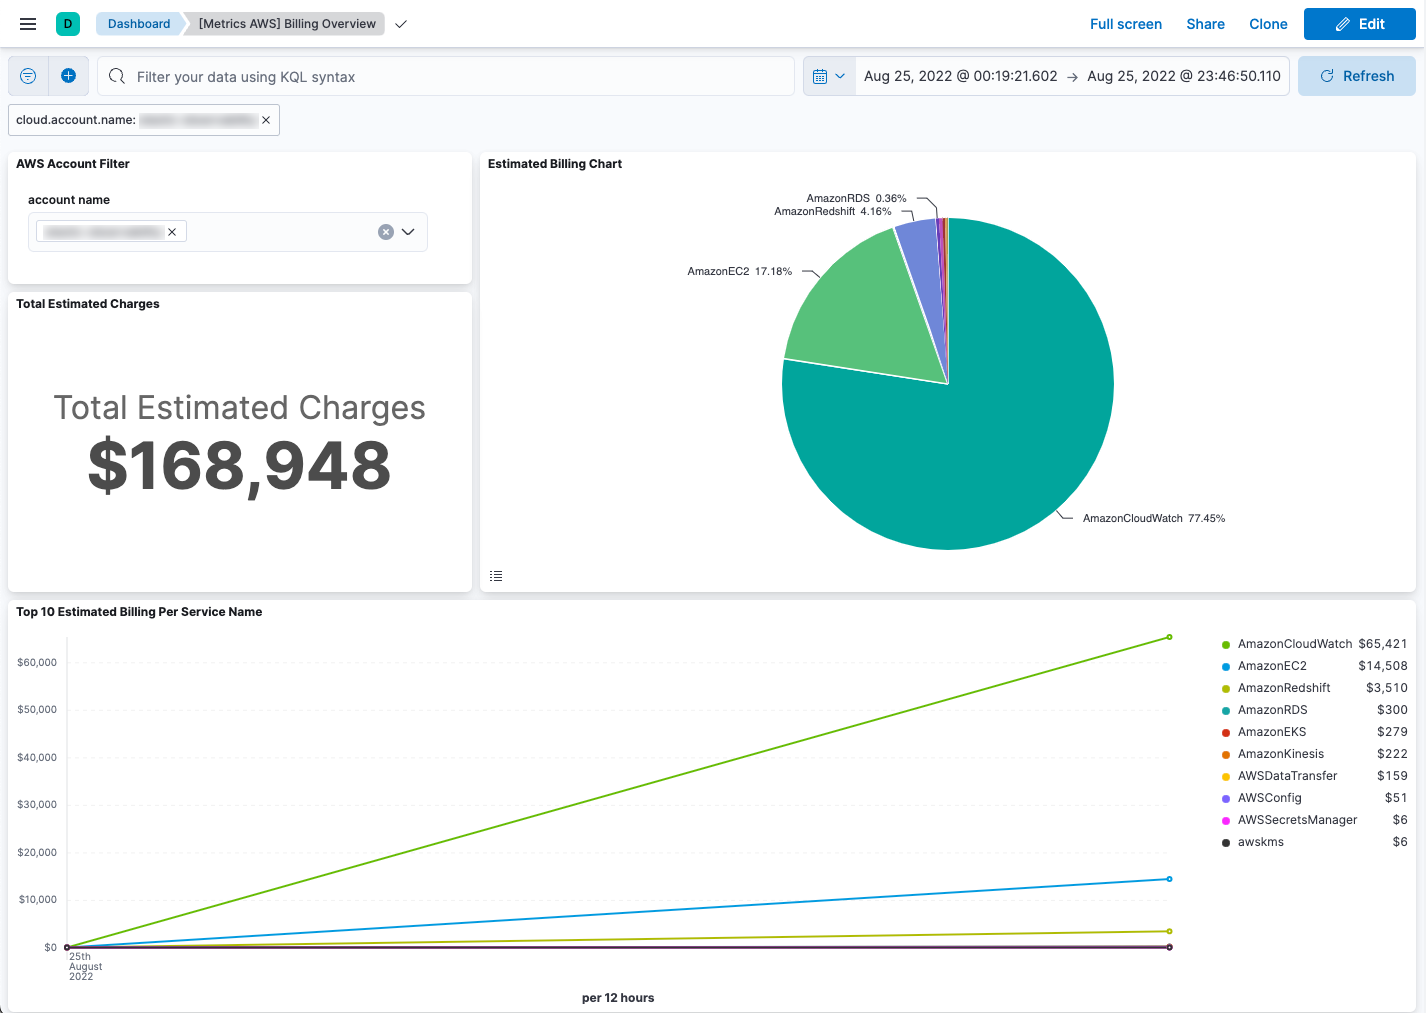
To track your AWS billing, open the [Metrics AWS] Billing Overview dashboard:
Congratulations! You have completed the tutorial. To try other tutorials in this series, visit the Tutorials page.