View alerts
editView alerts
editThis functionality is in technical preview and may be changed or removed in a future release. Elastic will work to fix any issues, but features in technical preview are not subject to the support SLA of official GA features.
The Alerts page lists all the alerts that have met a condition defined by a rule you created using the Logs, Metrics, Uptime, or APM apps.
After alerts have been triggered, you can monitor their activity to verify they are functioning correctly. In addition, you can filter alerts and troubleshoot each alert in their respective app.
You can also add alerts to Cases to open and track potential infrastructure issues.
You can centrally manage rules from the Kibana Management UI that provides a set of built-in rule types and connectors for you to use. Click Manage Rules
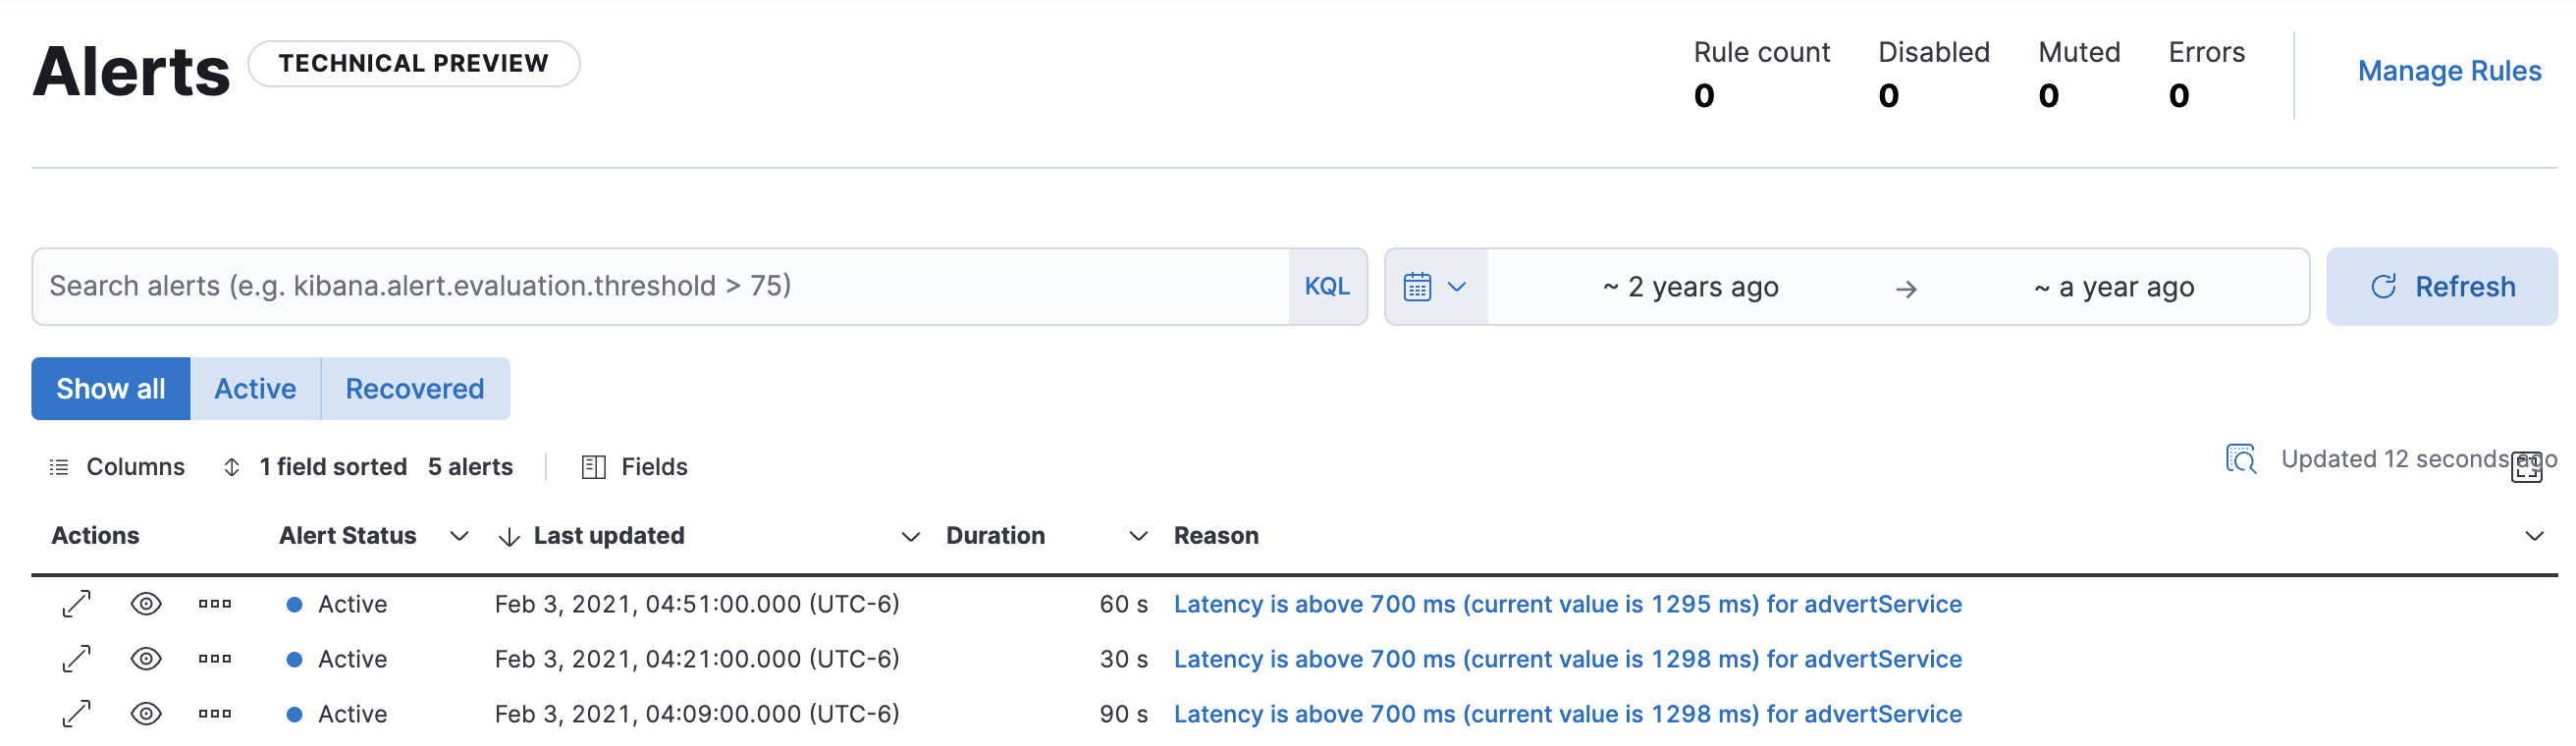
Filter alerts
editTo help you get started with your analysis faster, use the KQL bar to create structured queries using
Kibana Query Language. For example, kibana.alert.rule.name : <>.
You can use the time filter to define a specific date and time range. By default, this filter is set to search for the last 15 minutes.
You can also filter by alert status using the buttons below the KQL bar. By default, this filter is set to Show all alerts, but you can filter to show only Active or Recovered alerts. An alert is "Active" when the condition defined in the rule currently matches, and an alert has "Recovered" when that condition, which previously matched, is currently no longer matching.
View alert details
editThere are a few ways to inspect the details for a specific alert.
From the Alerts table, you can select ![]() to open the alert detail flyout to view a summary of the alert without leaving the page.
There you’ll see the current status of the alert, its duration, and when it was last updated.
To help you determine what caused the alert, you can view the expected and actual threshold values, and the rule that produced the alert.
to open the alert detail flyout to view a summary of the alert without leaving the page.
There you’ll see the current status of the alert, its duration, and when it was last updated.
To help you determine what caused the alert, you can view the expected and actual threshold values, and the rule that produced the alert.
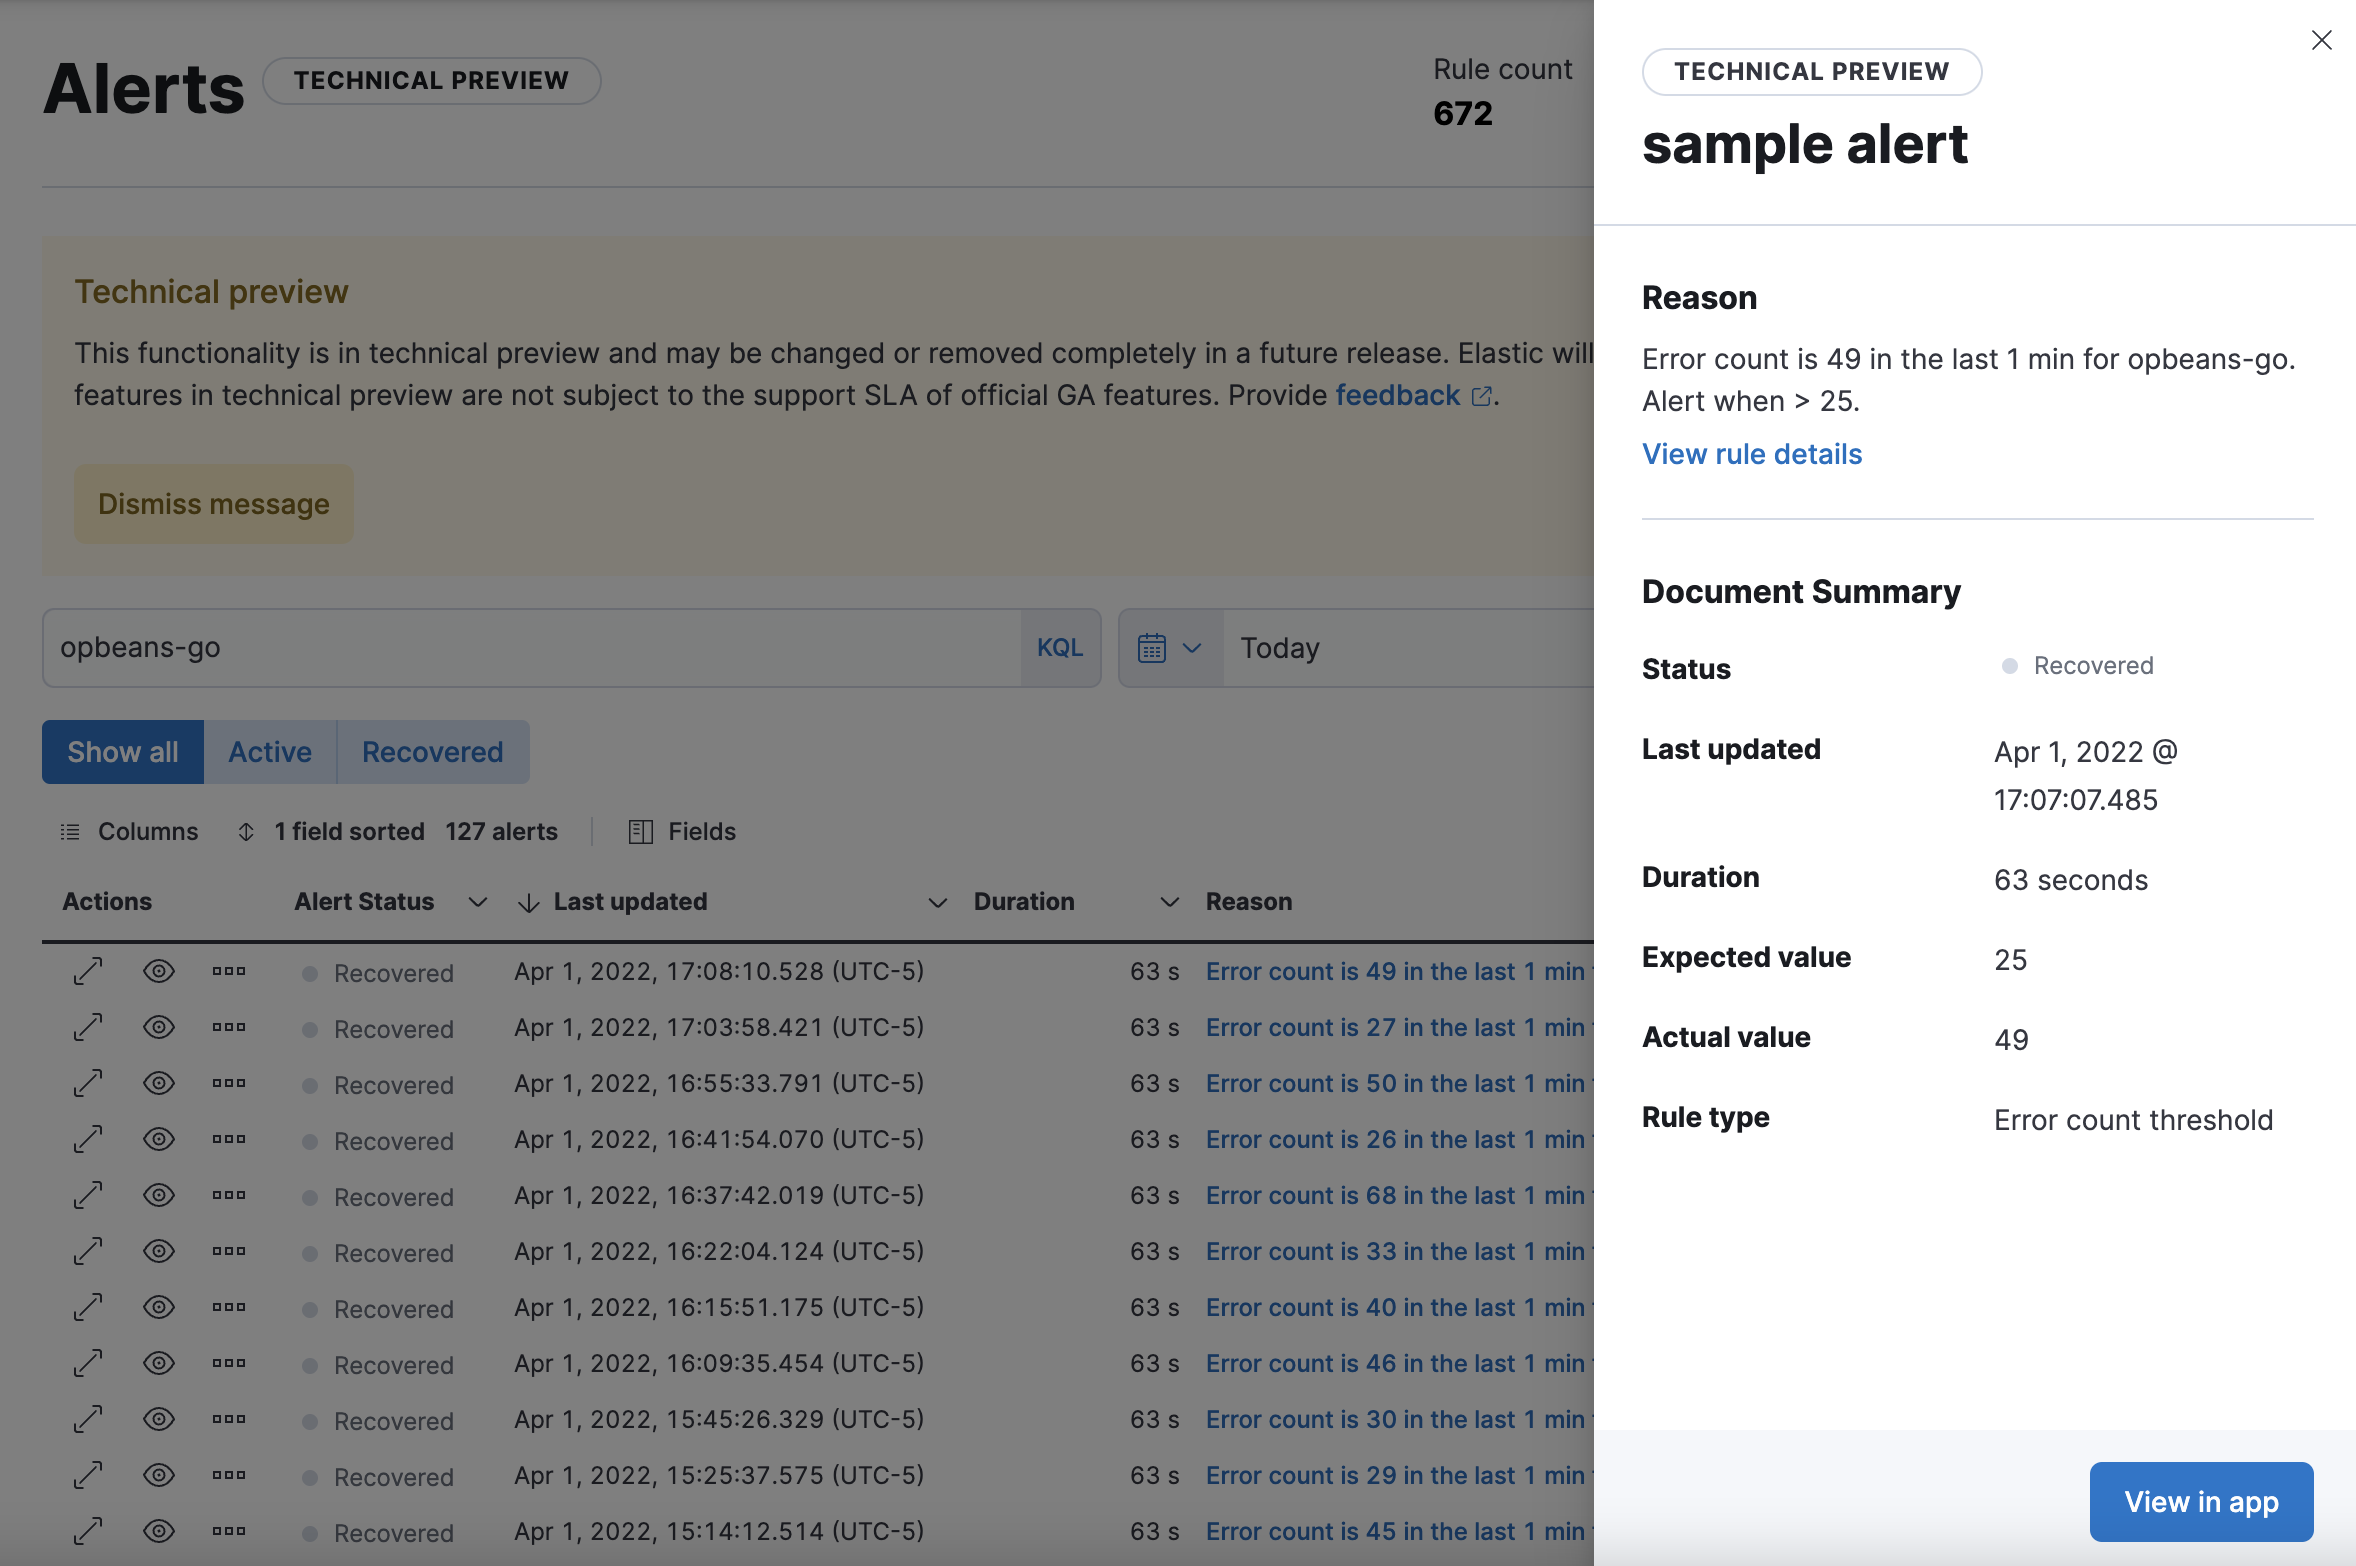
To further inspect the rule:
- From the alert detail flyout, click View rule details.
-
From the Alerts table, use the
 and click View rule details.
To view the alert in the app that triggered it:
- From the alert detail flyout, click View in app.
-
From the Alerts table, click the
 .
.
Add alerts to cases
editFrom the Alerts table, you can add one or more alerts to a case. Select ![]() to add the alert to a new case or add it to an existing case. You can add an unlimited amount of alerts from any rule type.
to add the alert to a new case or add it to an existing case. You can add an unlimited amount of alerts from any rule type.
Add an alert to a new case
editTo add an alert to a new case:
- Select Add to new case.
- Enter a case name, add relevant tags, and include a case description.
- Under External incident management system, select a connector. If you’ve previously added one, that connector displays as the default selection. Otherwise, the default setting is No connector selected.
- After you’ve completed all of the required fields, click Create case. A notification message confirms you successfully created the case. To view the case details, click the notification link or go to the Cases page.
Add an alert to an existing case
editTo add an alert to an existing case:
- Select Add to existing case.
- From the Select case pane, select the case for which to attach an alert. A confirmation message displays with an option to view the updated case. To view the case details, click the notification link or go to the Cases page.