Tail log files
editTail log files
editWithin the Logs app, the Stream page enables you to monitor all of the log events flowing in from your
servers, virtual machines, and containers in a centralized view. You can consider this as a tail -f in your browser,
along with the power of search.
Click Stream Live to view a continuous flow of log messages in real time, or click Stop streaming to view historical logs from a specified time range.
Filter logs
editTo help you get started with your analysis faster and extract fields from your logs, use the search bar
to create structured queries using Kibana Query Language.
For example, enter host.hostname : "host1" to see only the information for host1.
Additionally, click Highlights and enter a term you would like to locate within the log events. The Logs histogram, located to the right, highlights the number of discovered terms and when the log event was ingested. This helps you quickly jump between potential areas of interest in large amounts of logs, or from a high level, view when a large number of events occurred.
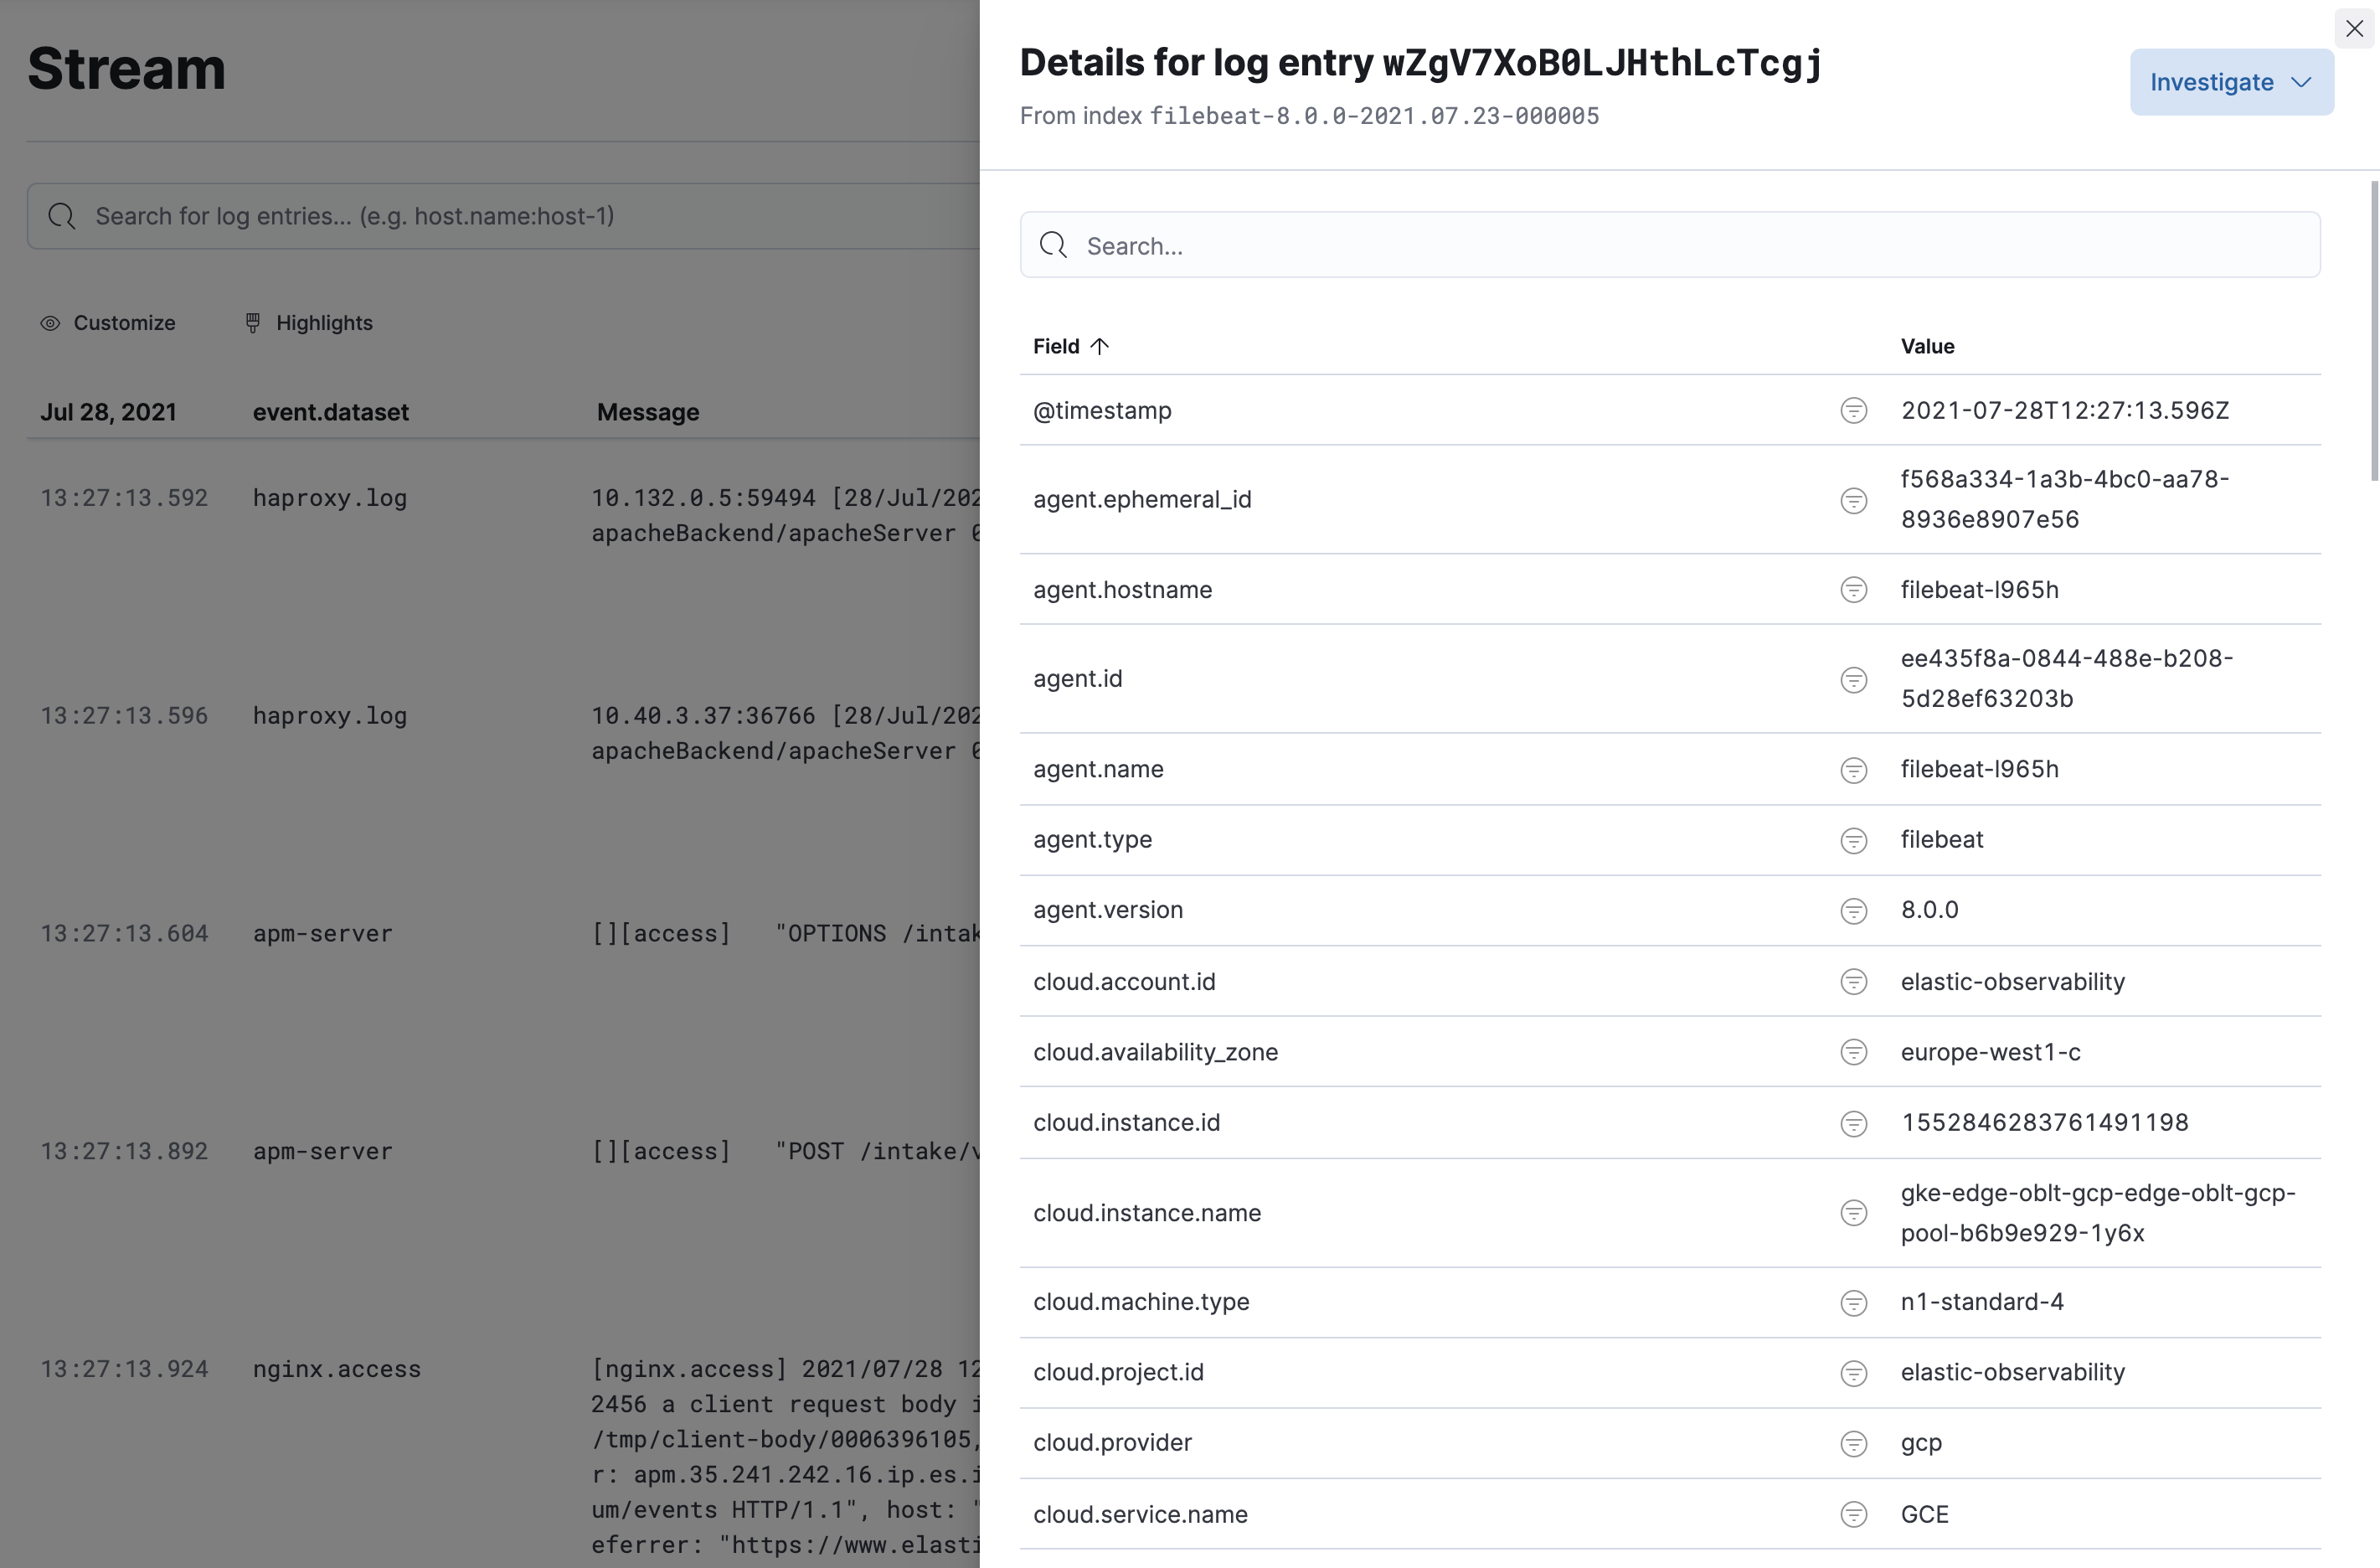
Inspect log event details
editWhen you have searched and filtered your logs for a specific log event, you may want to examine the metadata and the structured fields associated with that event. To view the Log event document details fly-out, hover over the log event, click View actions for line, and then select View details. To further enhance the workflow of monitoring logs, the icons next to each field value enable you to filter the logs per that value.
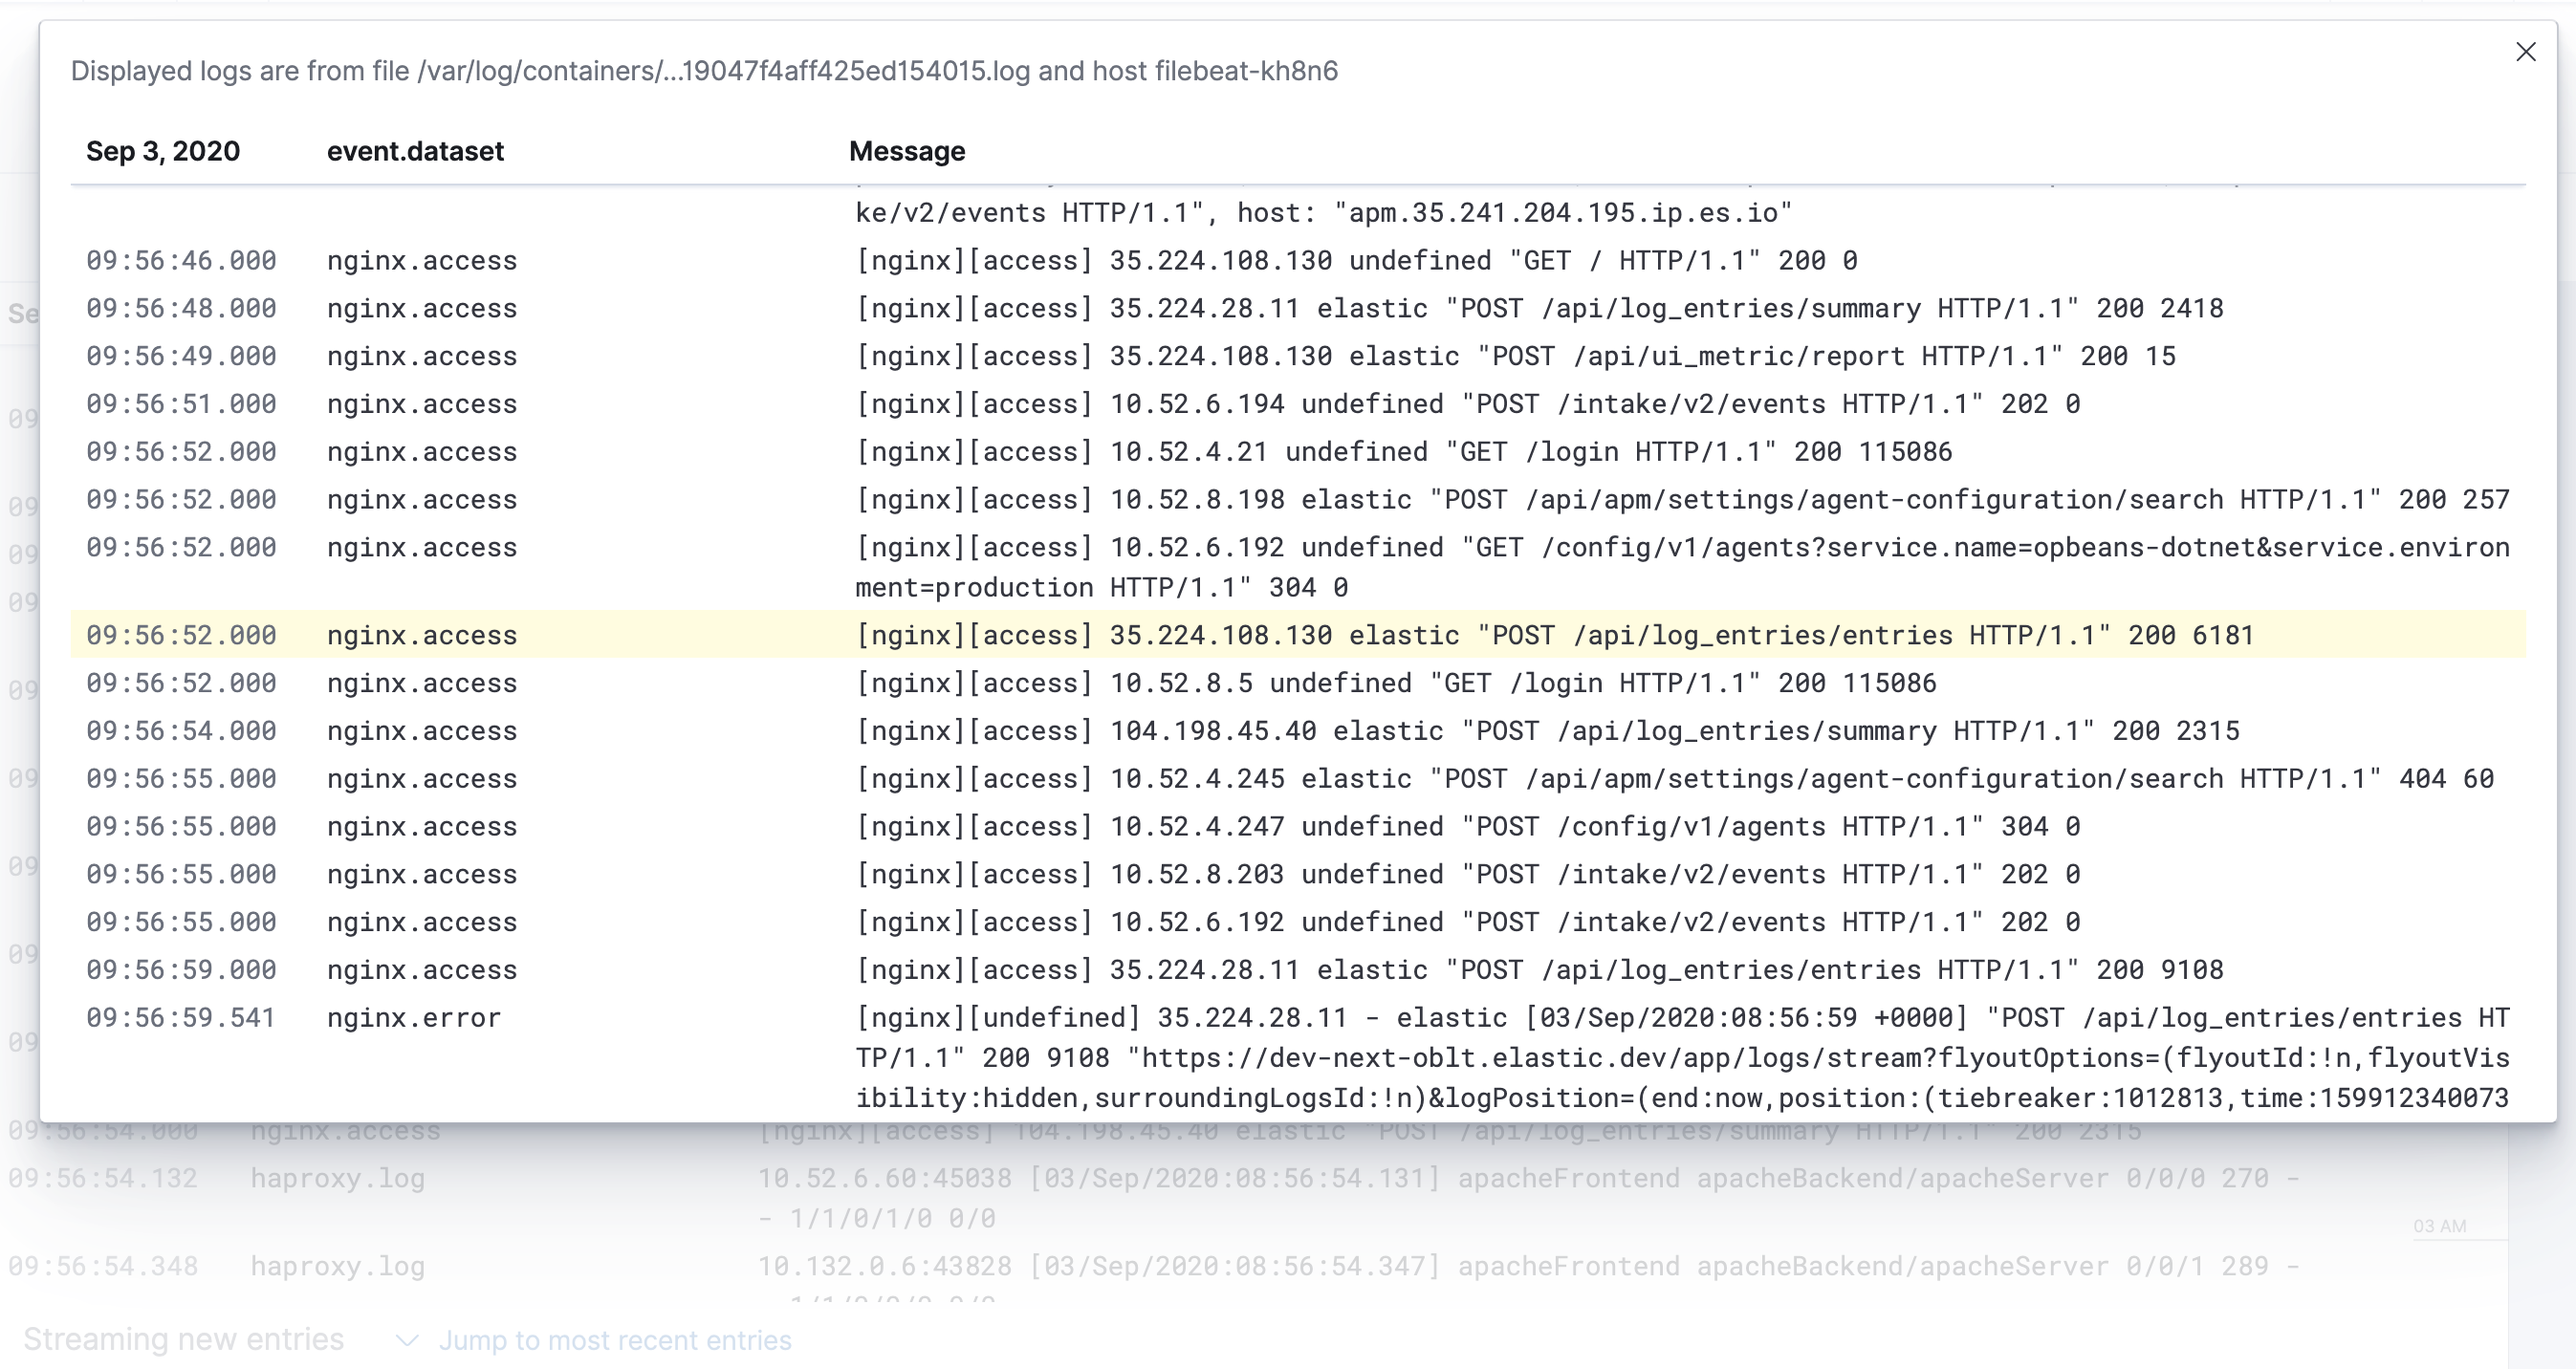
View contextual logs
editOnce your logs are filtered, and you find an interesting log line, the real context you are looking for is
what happened before and after that log line within that data source. For example, you are running
containerized applications on a Kubernetes cluster, you filter the logs for the term error, and you find an
interesting error log line. The context you want is what happened before and after the error line within the
logs of this container and application.
Hover over the log event, click View actions for line, and then select View in context. The context is preserved and helps you find the root cause as soon as possible.
Integrate with Uptime and APM
editTo see other actions related to a log event, click Actions in the Log event document details fly-out. Depending on the event and the features you have configured, you can:
- Select View status in Uptime to view related uptime information in the Uptime app.
- Select View in APM to view corresponding APM traces in the APM app.