Monitor Amazon Web Services (AWS)
editMonitor Amazon Web Services (AWS)
editIn this tutorial, you’ll learn how to monitor your AWS infrastructure using Elastic Observability: Logs and Metrics.
What you’ll learn
editYou’ll learn how to:
- Create and configure an S3 bucket
- Create and configure an SQS queue.
- Install and configure Filebeat and Metricbeat to collect Logs and Metrics
- Collect logs from S3
- Collect metrics from Amazon CloudWatch
Before you begin
editCreate a deployment using our hosted Elasticsearch Service on Elastic Cloud. The deployment includes an Elasticsearch cluster for storing and searching your data, and Kibana for visualizing and managing your data. To learn more, see Spin up the Elastic Stack.
With this tutorial, we assume that your logs and your infrastructure data are already shipped to CloudWatch. We are going to show you how you can stream your data from CloudWatch to Elasticsearch. If you don’t know how to put your AWS logs and infrastructure data in CloudWatch, Amazon provides a lot of documentation around this specific topic:
- Collect your logs and infrastructure data from specific AWS services
- Export your logs to an S3 bucket
Step 1: Create an S3 Bucket
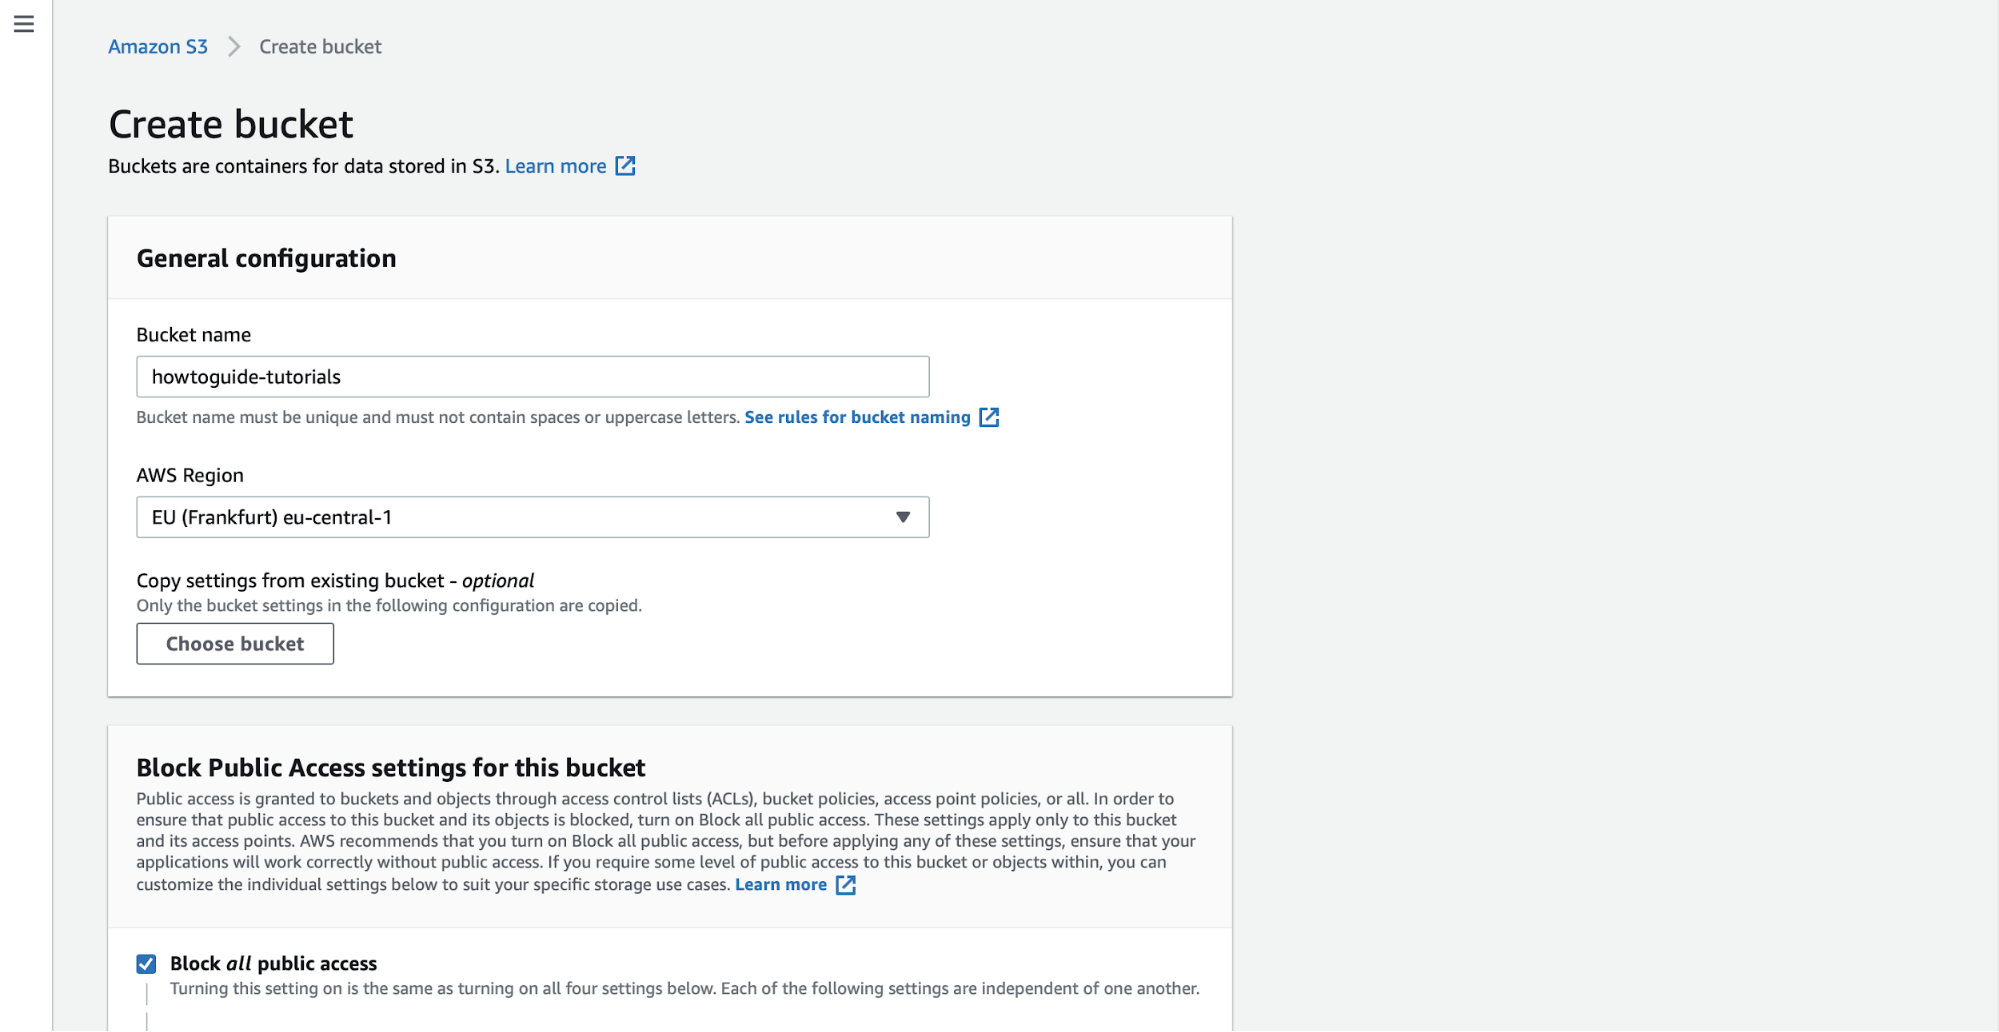
editTo centralize your logs in Elasticsearch, you need to have an S3 bucket. Filebeat, the agent you’ll use to collect logs, has an input for S3.
In the AWS S3 console, click on Create bucket. Give the bucket a name and specify the region in which you want it deployed.
Step 2: Create an SQS Queue
editYou should now have an S3 bucket in which you can export your logs, but you will also need an SQS queue. To avoid significant lagging with polling all log files from each S3 bucket, we will use Amazon Simple Queue Service (SQS). This will provide us with an Amazon S3 notification when a new S3 object is created. The Filebeat S3 input checks SQS for new messages regarding the new object created in S3 and uses the information in these messages to retrieve logs from S3 buckets. With this setup, periodic polling from each S3 bucket is not needed. Instead, the Filebeat S3 input guarantees near real-time data collection from S3 buckets with both speed and reliability.
Create an SQS queue and configure our S3 bucket to send a message to the SQS queue whenever new logs are present in the S3 bucket. Go to the SQS console
Make sure that the queue is created in the same region as the S3 bucket.
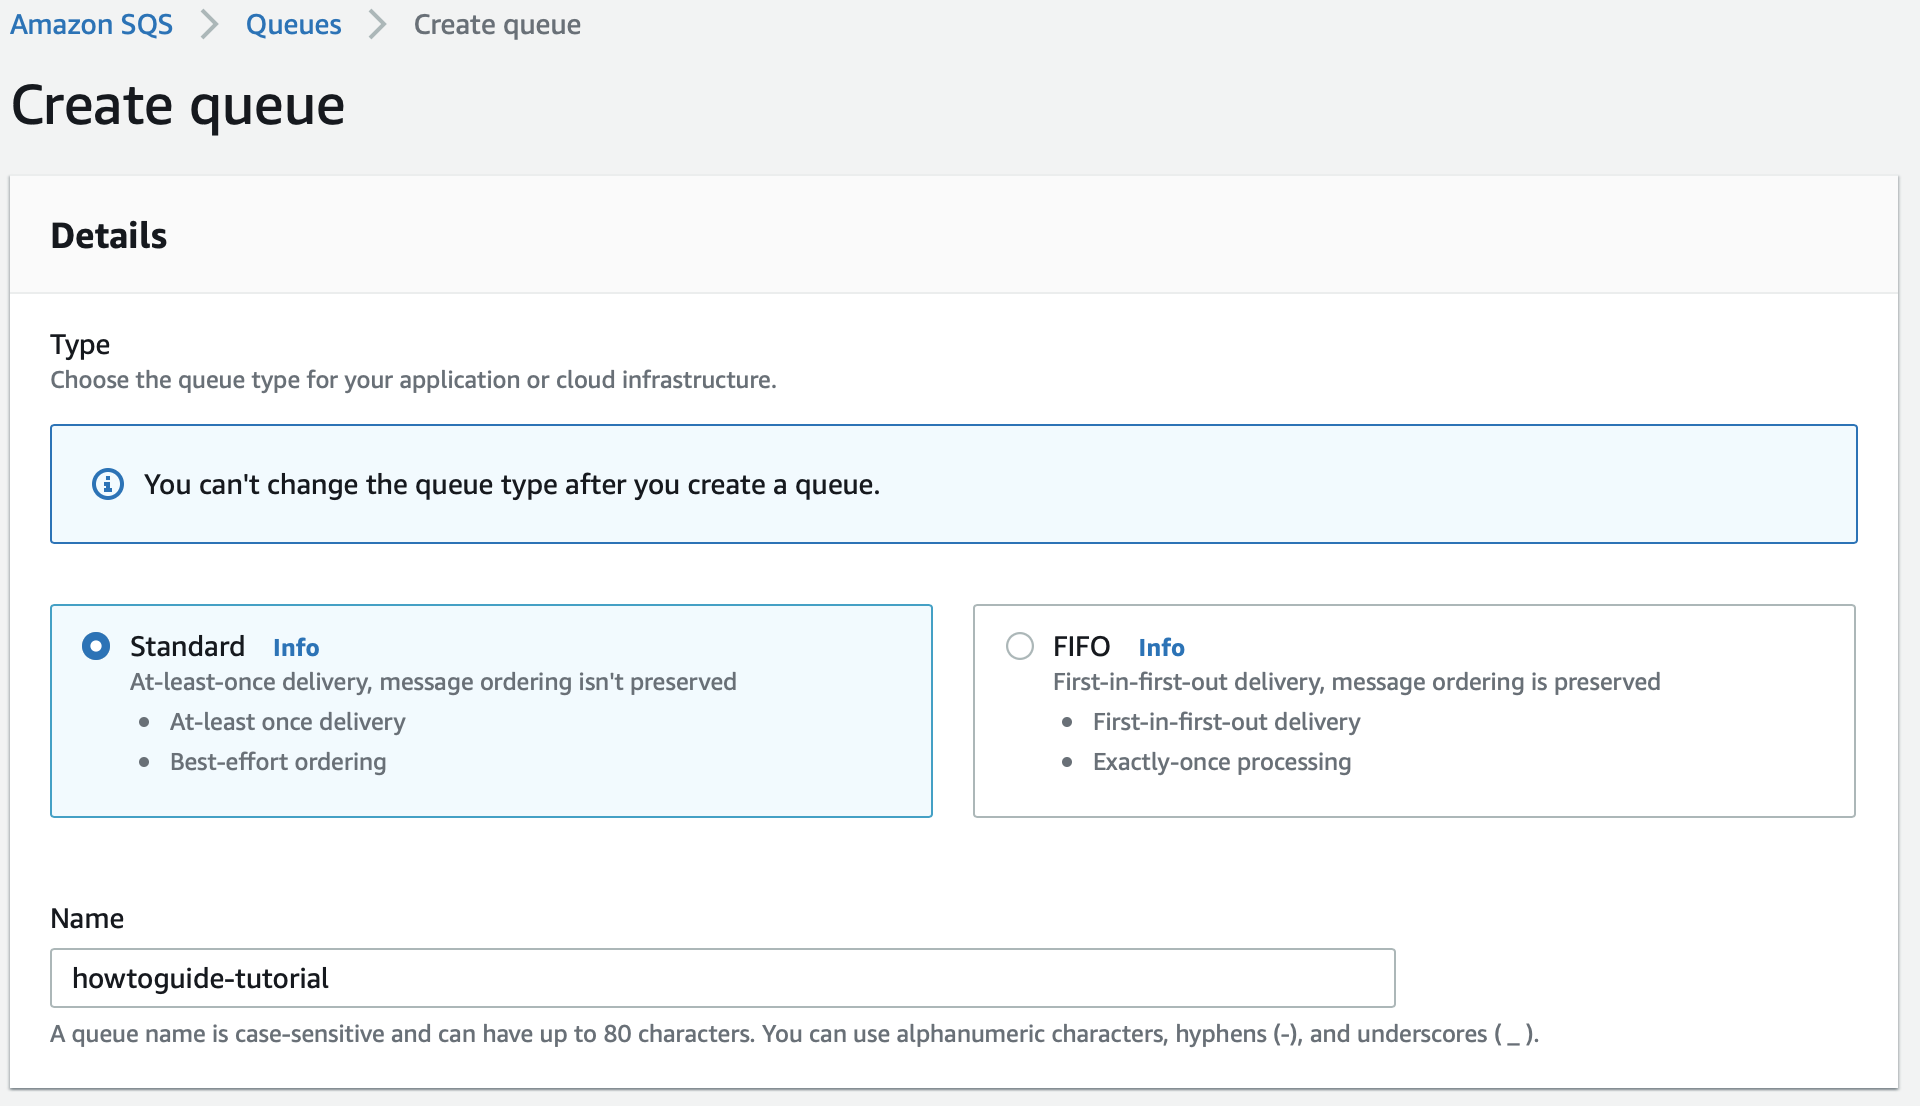
Create a standard SQS queue and edit the access policy by using a JSON object to define an advanced access policy:
Replace <sqs-arn> with the ARN of the SQS queue, <s3-bucket-arn> with the
ARN of the S3 bucket you just created, the <source-account> with your source
account.
{
  "Version": "2012-10-17",
  "Id": "example-ID",
  "Statement": [
    {
      "Sid": "example-statement-ID",
      "Effect": "Allow",
      "Principal": {
        "AWS": "*"
      },
      "Action": "SQS:SendMessage",
      "Resource": "<sqs-arn>",
      "Condition": {
        "StringEquals": {
          "aws:SourceAccount": "<source-account>"
        },
        "ArnLike": {
          "aws:SourceArn": "<s3-bucket-arn>"
        }
      }
    }
  ]
}
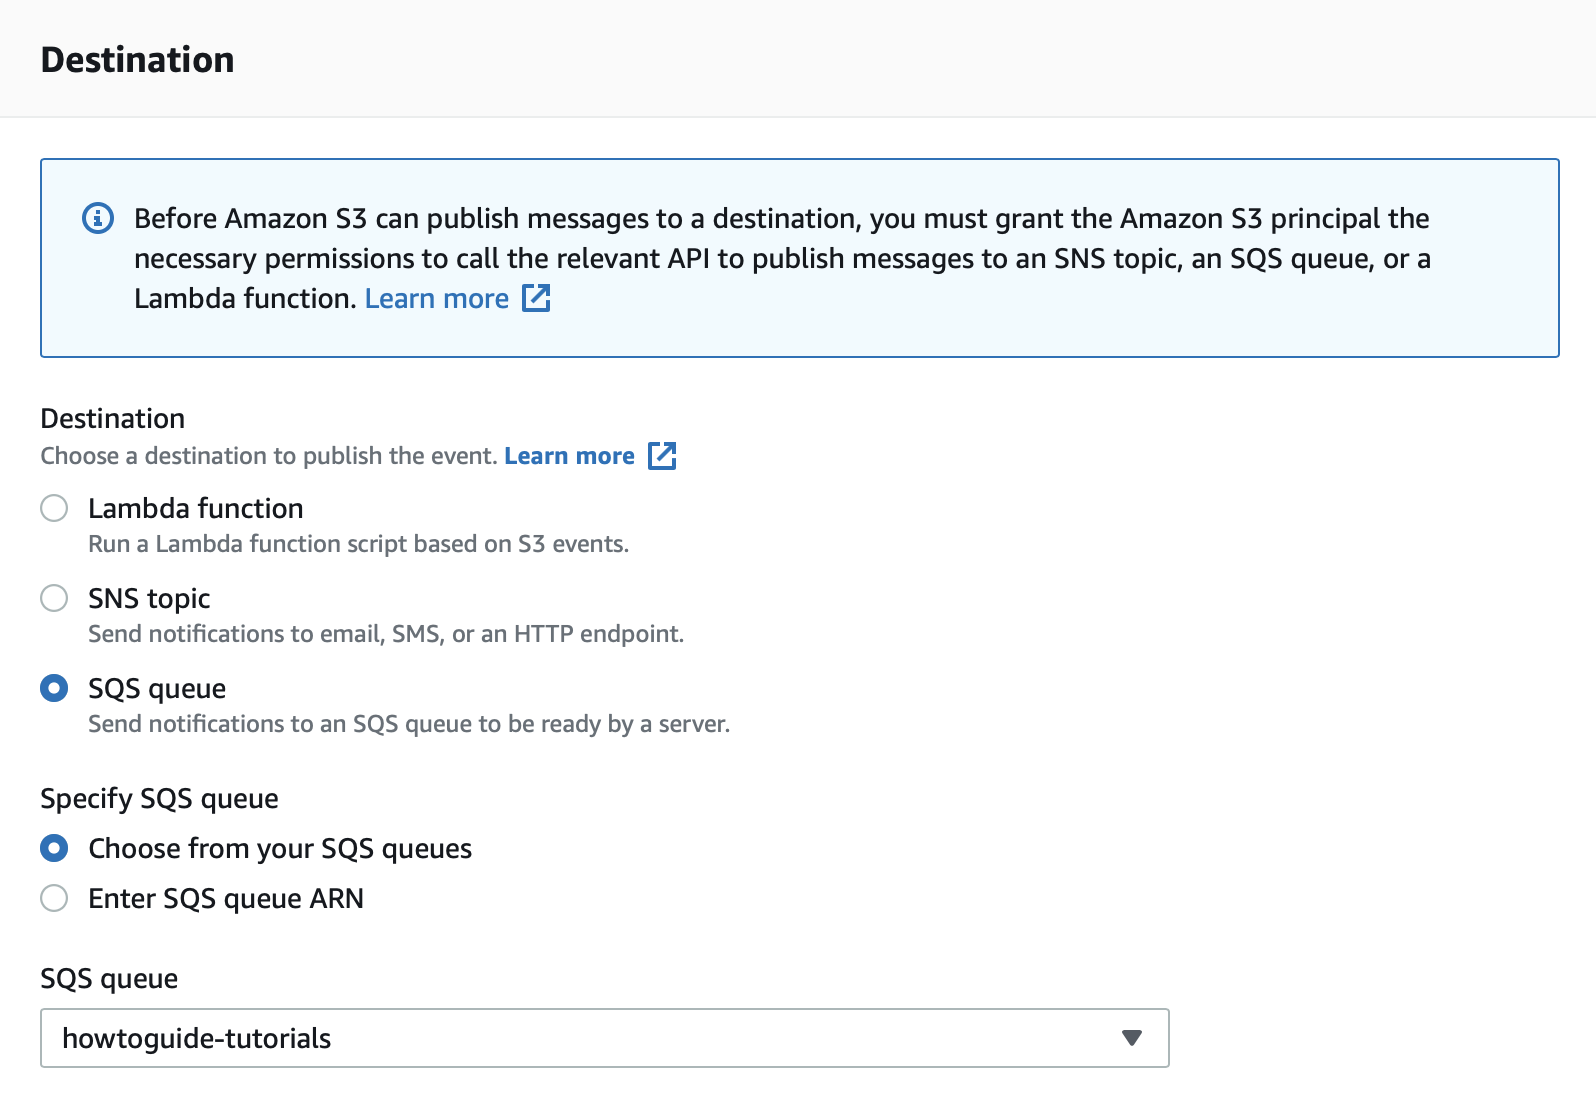
Step 3: Enable Event Notification
editNow that your queue is created, go to the properties of the S3 bucket you created and click Create event notification.
Specify that you want to send a notification on every object creation event.
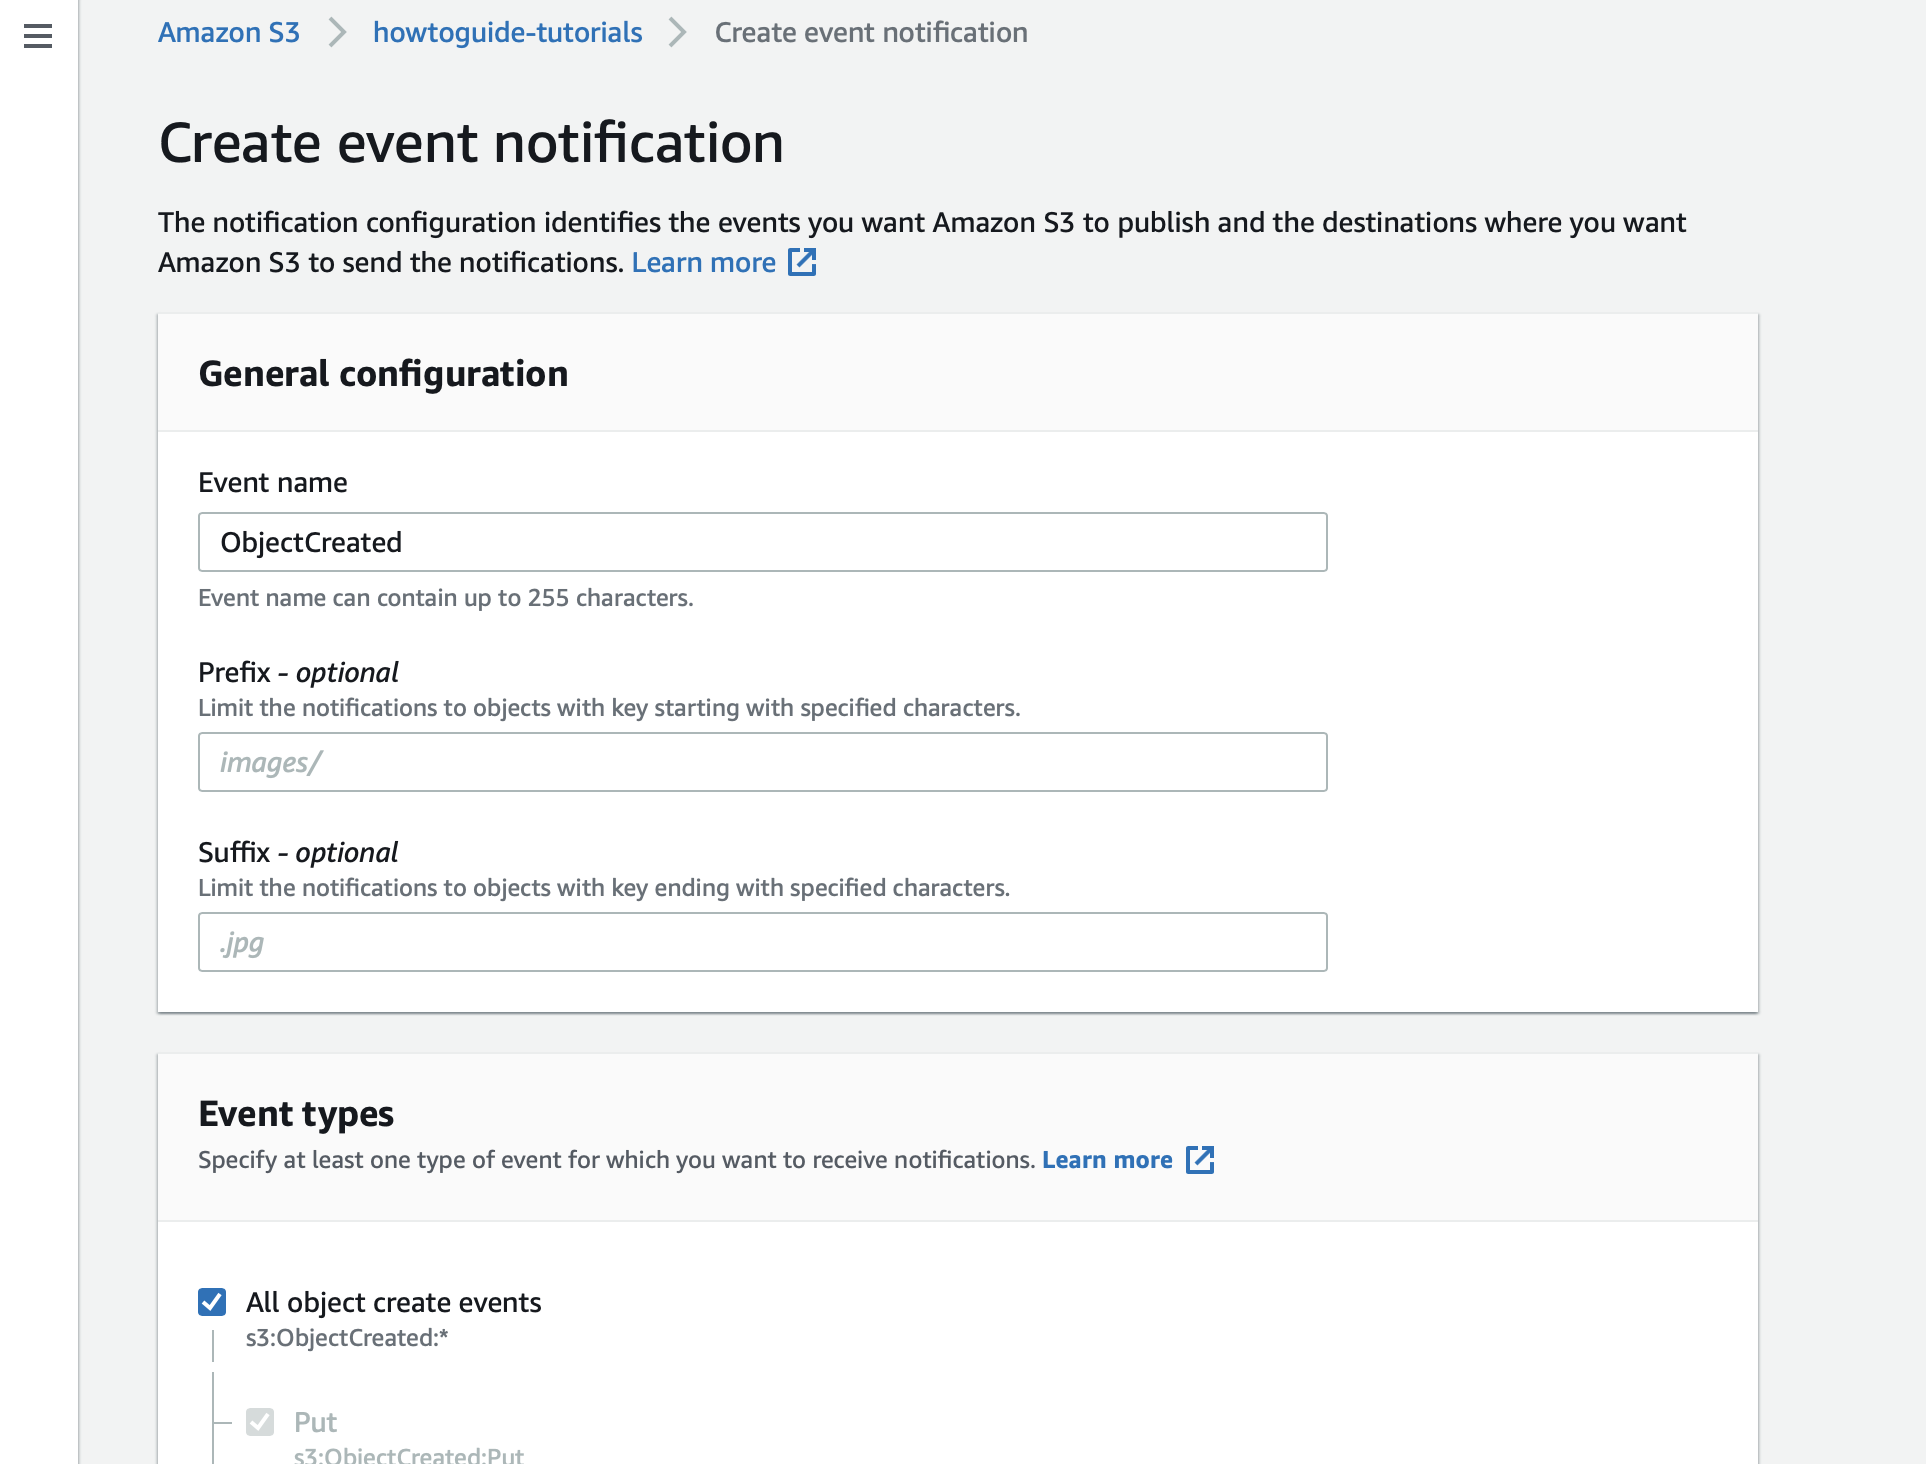
Set the destination as the SQS queue you just created.
Step 4: Install and configure Filebeat
editTo monitor AWS using the Elastic Stack, you need two main components: an Elastic deployment to store and analyze the data and an agent to collect and ship the data.
Install Filebeat
editDownload and install Filebeat.
curl -L -O https://artifacts.elastic.co/downloads/beats/filebeat/filebeat-8.2.3-amd64.deb
sudo dpkg -i filebeat-8.2.3-amd64.deb
curl -L -O https://artifacts.elastic.co/downloads/beats/filebeat/filebeat-8.2.3-x86_64.rpm
sudo rpm -vi filebeat-8.2.3-x86_64.rpm
curl -L -O https://artifacts.elastic.co/downloads/beats/filebeat/filebeat-8.2.3-darwin-x86_64.tar.gz
tar xzvf filebeat-8.2.3-darwin-x86_64.tar.gz
curl -L -O https://artifacts.elastic.co/downloads/beats/filebeat/filebeat-8.2.3-linux-x86_64.tar.gz
tar xzvf filebeat-8.2.3-linux-x86_64.tar.gz
- Download the Filebeat Windows zip file from the downloads page.
-
Extract the contents of the zip file into
C:\Program Files. -
Rename the
filebeat-<version>-windowsdirectory toFilebeat. - Open a PowerShell prompt as an Administrator (right-click the PowerShell icon and select Run As Administrator).
-
From the PowerShell prompt, run the following commands to install Filebeat as a Windows service:
PS > cd 'C:\Program Files\Filebeat'
PS C:\Program Files\Filebeat> .\install-service-filebeat.ps1
If script execution is disabled on your system, you need to set the
execution policy for the current session to allow the script to run. For
example:
PowerShell.exe -ExecutionPolicy UnRestricted -File .\install-service-filebeat.ps1.
Set up assets
editFilebeat comes with predefined assets for parsing, indexing, and visualizing your data. Run the following command to load these assets. It may take a few minutes.
./filebeat setup -e -E 'cloud.id=YOUR_DEPLOYMENT_CLOUD_ID' -E 'cloud.auth=elastic:YOUR_SUPER_SECRET_PASS'
|
Substitute your Cloud ID and an administrator’s |
Setting up Filebeat is an admin-level task that requires extra privileges. As a best practice, use an administrator role to set up and a more restrictive role for event publishing (which you will do next).
Configure Filebeat output
editNext, you are going to configure Filebeat output to Elasticsearch Service.
-
Use the Filebeat keystore to store secure settings. Store the Cloud ID in the keystore.
./filebeat keystore create
echo -n "<Your Deployment Cloud ID>" | ./filebeat keystore add CLOUD_ID --stdin
-
To store logs in Elasticsearch with minimal permissions, create an API key to send data from Filebeat to Elasticsearch Service. Log into Kibana (you can do so from the Cloud Console without typing in any permissions) and select Management → Dev Tools. Send the following request:
POST /_security/api_key
{
  "name": "filebeat-monitor-gcp",
  "role_descriptors": {
    "filebeat_writer": {
      "cluster": [
        "monitor",
        "read_ilm",
        "cluster:admin/ingest/pipeline/get",
        "cluster:admin/ingest/pipeline/put"
      ],
      "index": [
        {
          "names": ["filebeat-*"],
          "privileges": ["view_index_metadata", "create_doc"]
        }
      ]
    }
  }
}
Filebeat needs extra cluster permissions to publish logs, which differs from the Metricbeat configuration. You can find more details here.
-
The response contains an
api_keyand anidfield, which can be stored in the Filebeat keystore in the following format:id:api_key.echo -n "IhrJJHMB4JmIUAPLuM35:1GbfxhkMT8COBB4JWY3pvQ" | ./filebeat keystore add ES_API_KEY --stdin
Make sure you specify the
-nparameter; otherwise, you will have painful debugging sessions due to adding a newline at the end of your API key. -
To see if both settings have been stored, run the following command:
./filebeat keystore list
-
To configure Filebeat to output to Elasticsearch Service, edit the
filebeat.ymlconfiguration file. Add the following lines to the end of the file.cloud.id: ${CLOUD_ID} output.elasticsearch: api_key: ${ES_API_KEY} -
Finally, test if the configuration is working. If it is not working, verify that you used the right credentials and, if necessary, add them again.
./filebeat test output
Step 5: Configure the AWS Module
editNow that the output is working, you can set up the Filebeat AWS module which will automatically create the AWS input. This module checks SQS for new messages regarding the new object created in the S3 bucket and uses the information in these messages to retrieve logs from S3 buckets. With this setup, periodic polling from each S3 bucket is not needed.
There are many different filesets available: cloudtrail, vpcflow, ec2,
cloudwatch, elb and s3access. In this tutorial, we are going to show you a
few examples using the ec2 and the s3access filesets.
The ec2 fileset is
used to ship and process logs stored in CloudWatch, and export them to an S3
bucket. The s3access fileset is used when S3 access logs need to be collected.
It provides detailed records for the requests that are made to a bucket. Server
access logs are useful for many applications. For example, access log
information can be useful in security and access audits. It can also help you
learn about your customer base and understand your Amazon S3 bill.
Let’s enable the AWS module in Filebeat.
./filebeat modules enable aws
Edit the modules.d/aws.yml file with the following configurations.
- module: aws
  cloudtrail:
    enabled: false
  cloudwatch:
    enabled: false
  ec2:
    enabled: true
    var.credential_profile_name: fb-aws
    var.queue_url: https://sqs.eu-central-1.amazonaws.com/836370109380/howtoguide-tutorial
  elb:
    enabled: false
  s3access:
    enabled: false
  vpcflow:
    enabled: false
|
Enables the |
|
|
This is the AWS profile defined following the AWS standard. |
|
|
Add the URL to the queue containing notifications around the bucket containing the EC2 logs |
Make sure that the AWS user used to collect the logs from S3 has at least the following permissions attached to it:
{
    "Version": "2012-10-17",
    "Statement": [
        {
            "Action": [
              "s3:GetObject",
              "sqs:ReceiveMessage",
              "sqs:ChangeMessageVisibility",
              "sqs:DeleteMessage"
            ],
            "Effect": "Allow",
            "Resource": "*"
        }
    ]
}
You can now upload your logs to the S3 bucket. If you are using CloudWatch, make sure to edit the policy of your bucket as shown in step 3 of the AWS user guide. This will help you avoid permissions issues.
Start Filebeat to collect the logs.
./filebeat -e
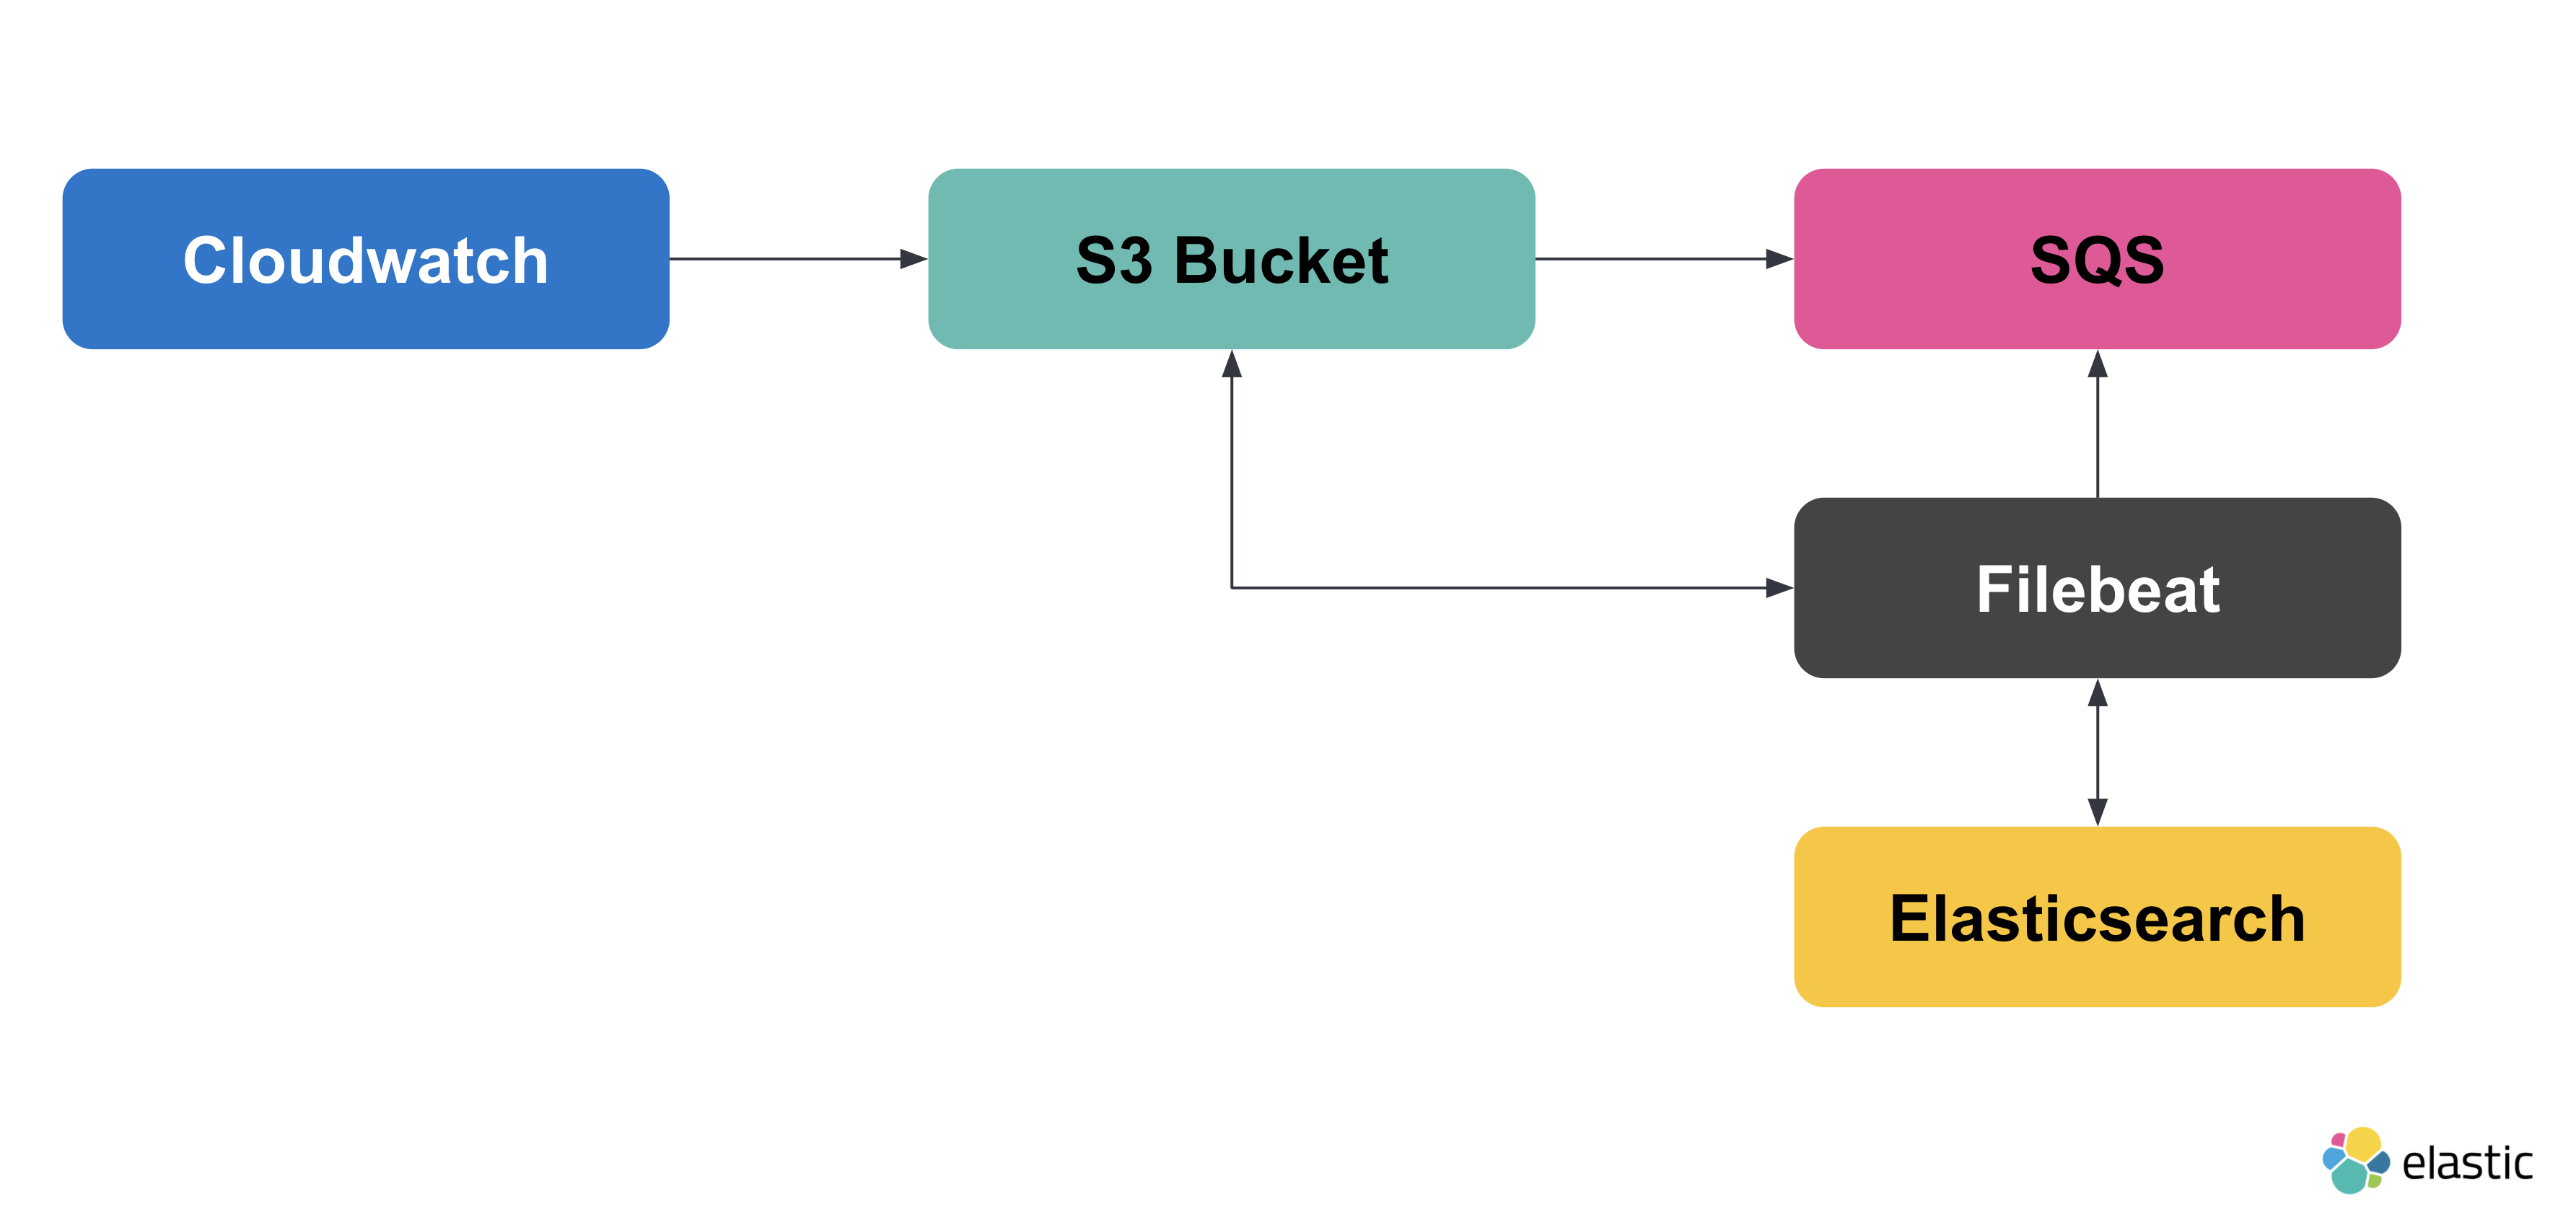
Here’s what we’ve achieved so far:
Now, let’s configure the s3access fileset.
The goal here is to be able to monitor how people access the bucket we
created. To do this, we’ll create another bucket and another queue.
The new architecture will look like this:
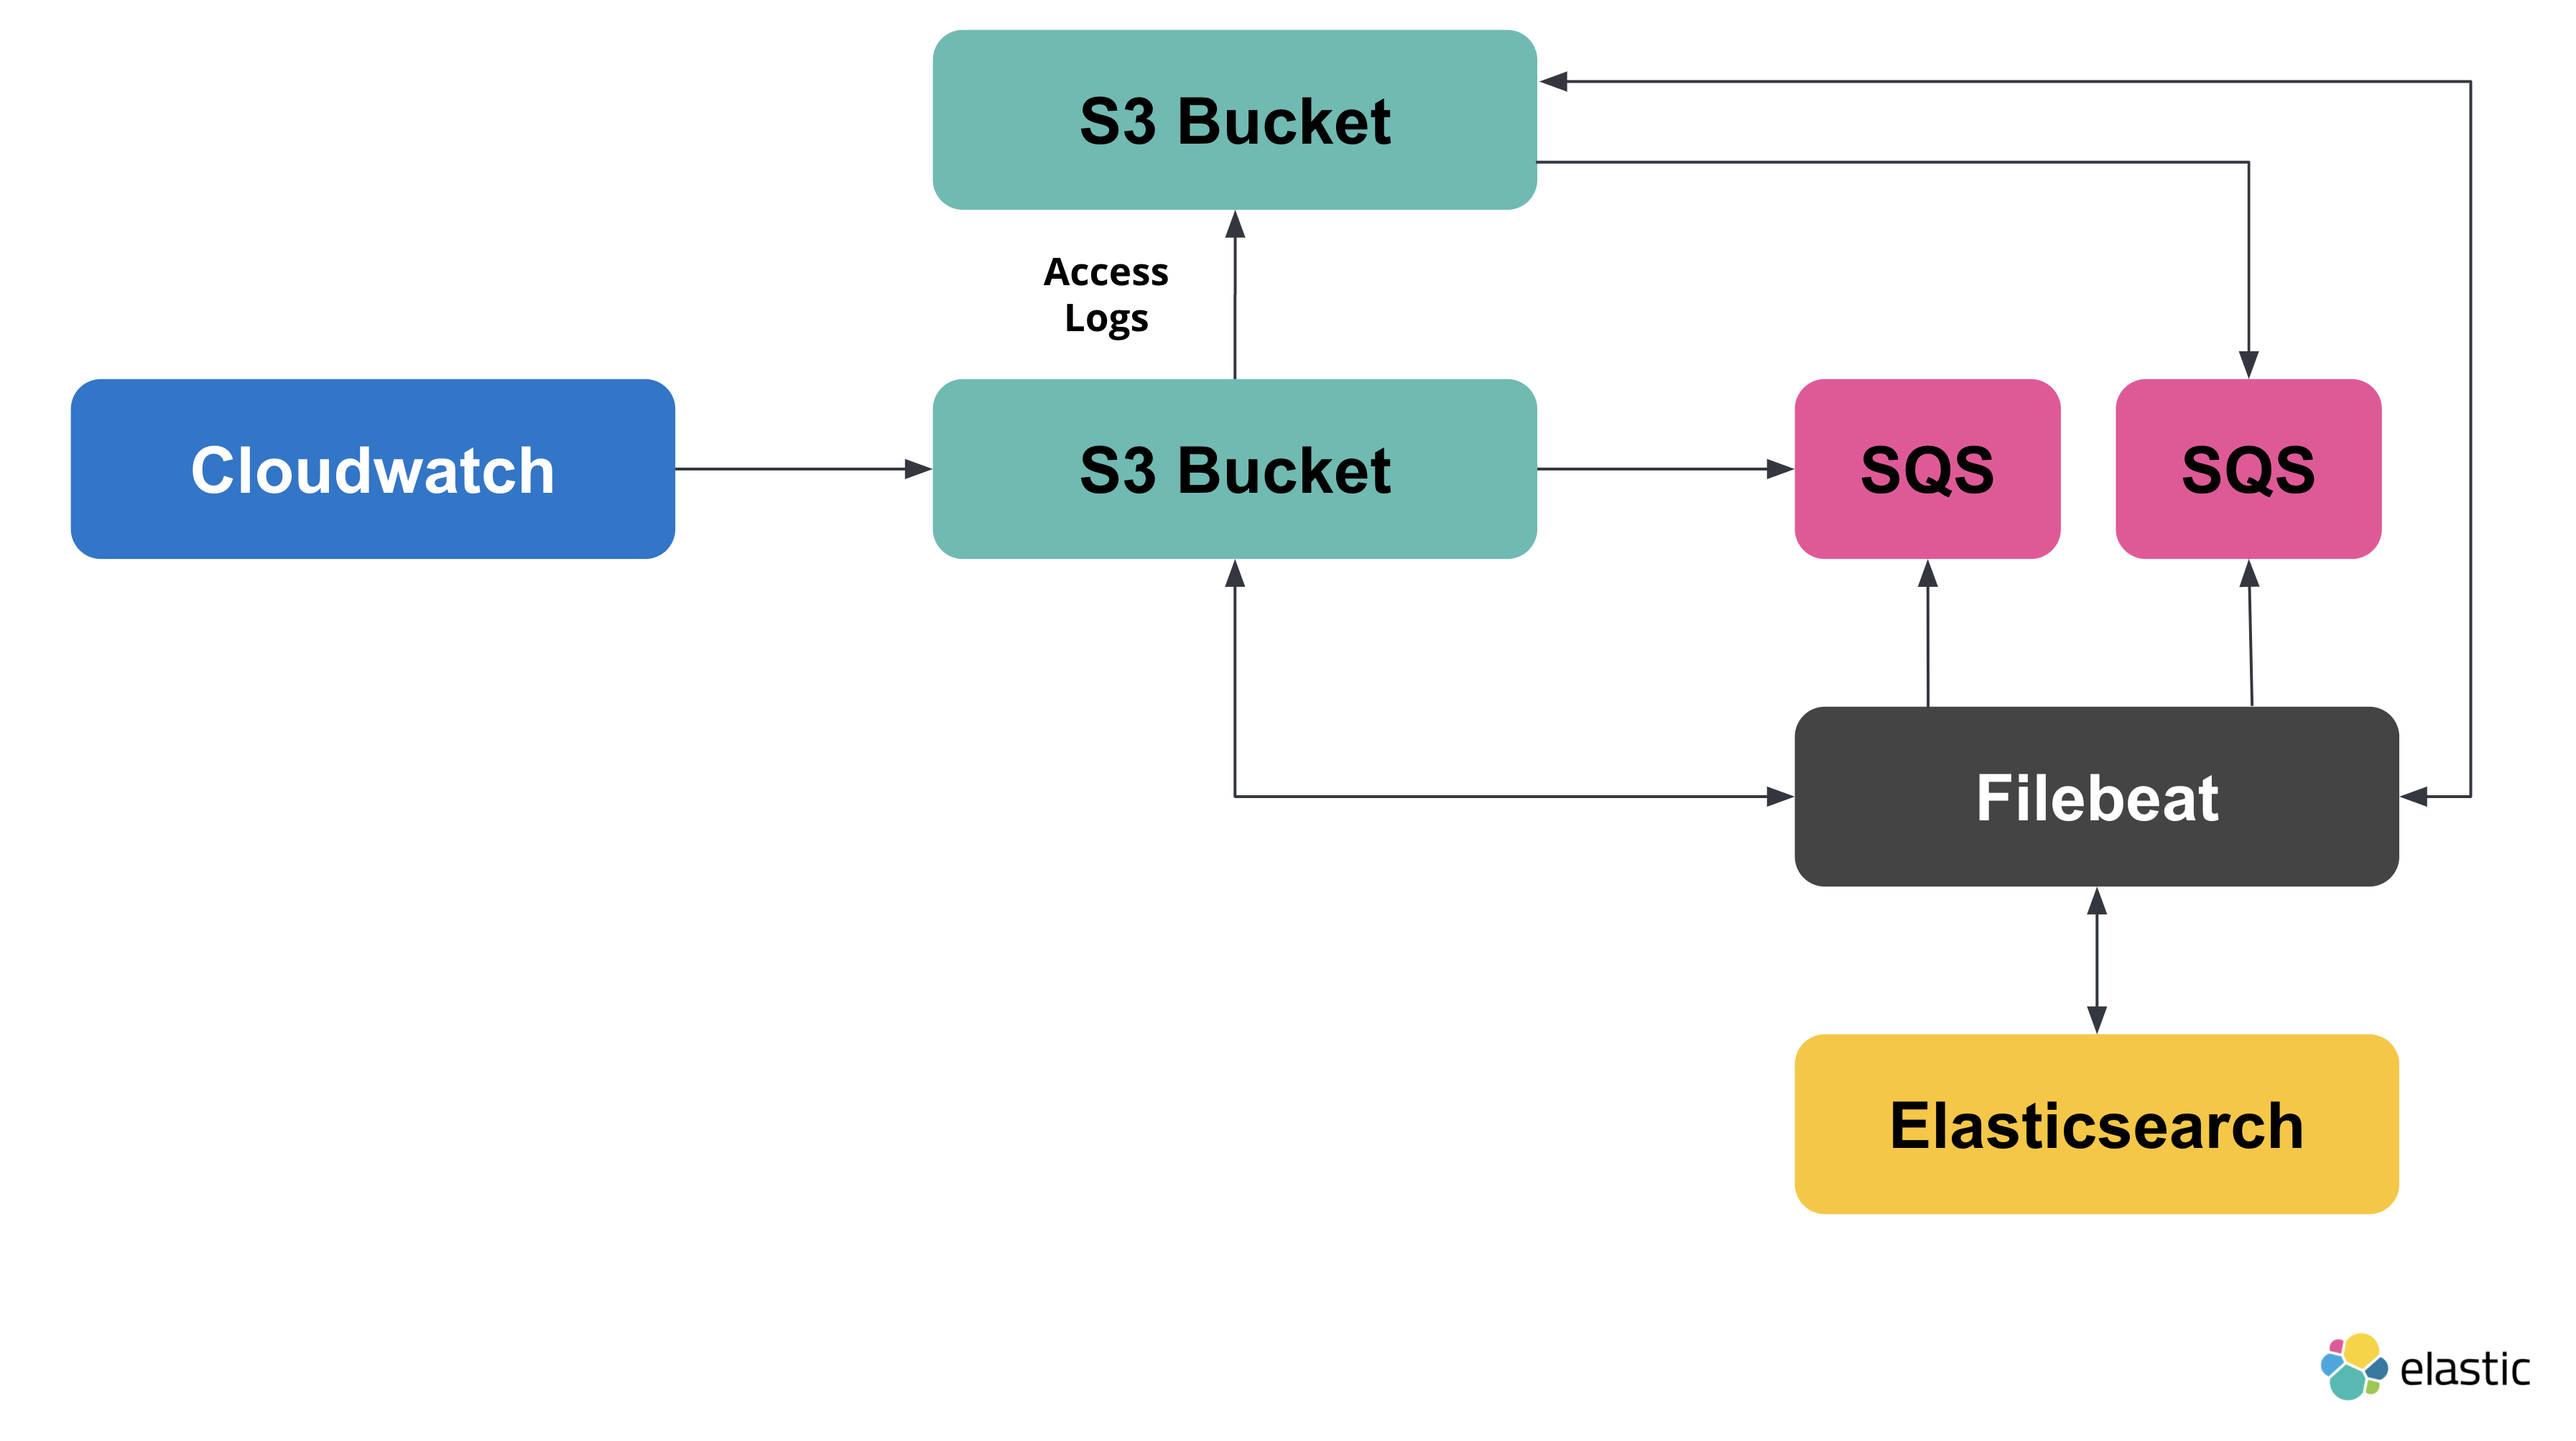
Create a new S3 bucket and SQS queue. Ensure that the event notifications on the new bucket are enabled, and that it’s sending notifications to the new queue.
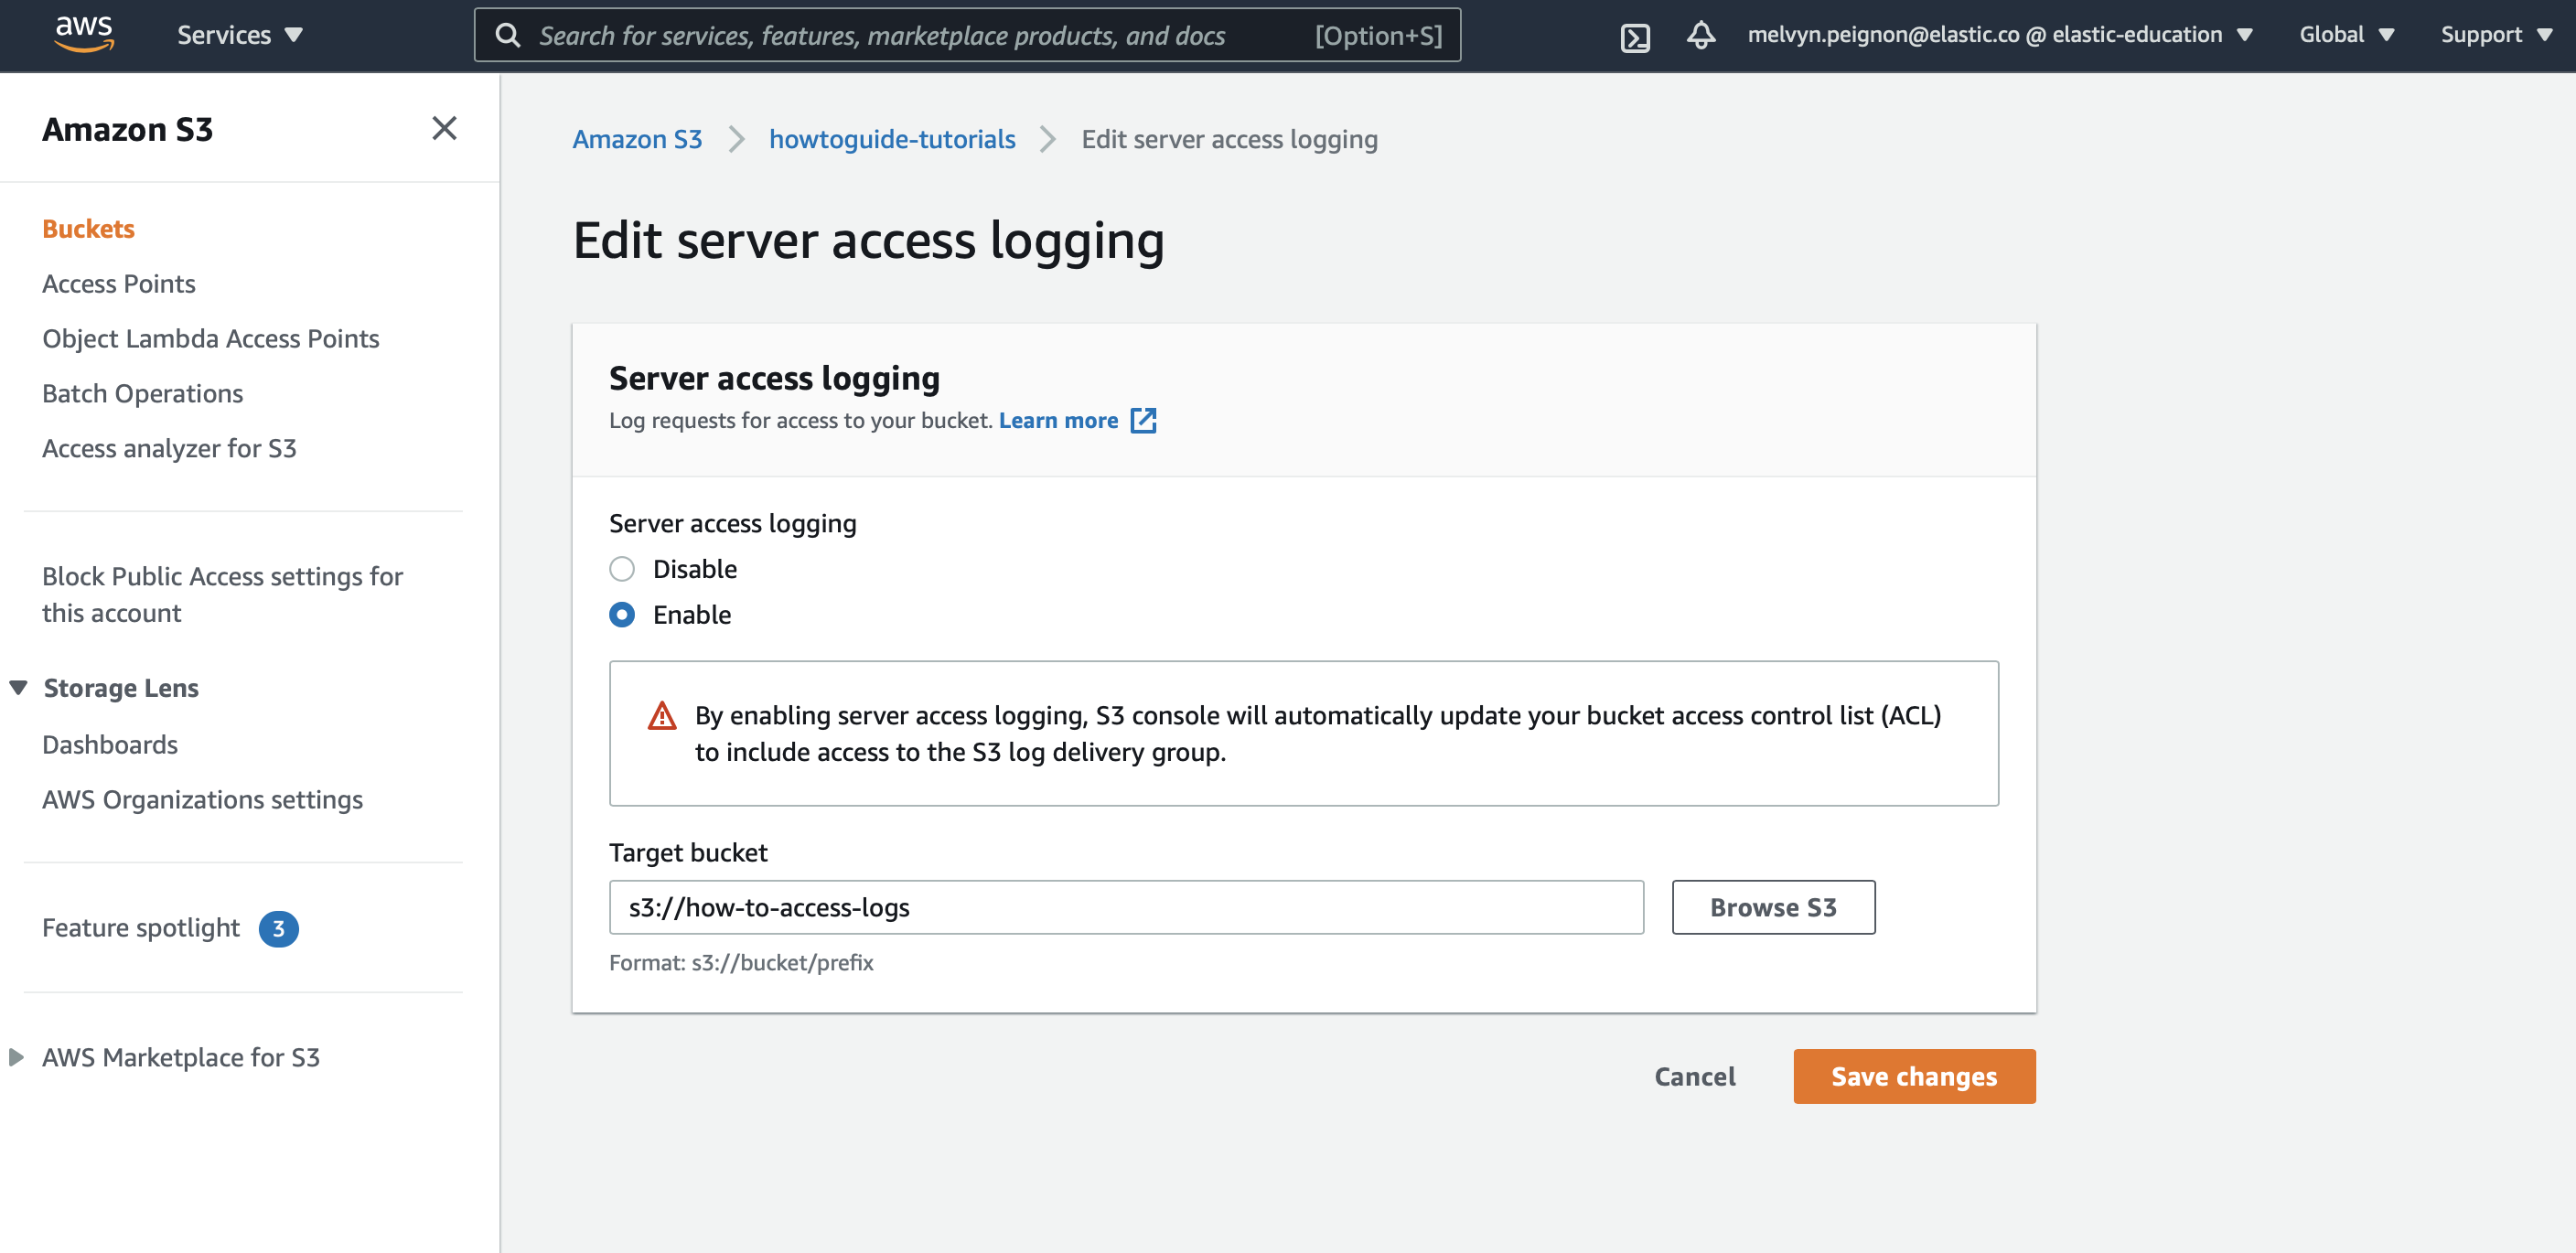
Now go back to the first bucket, and go to Properties > Server access logging. Specify that you want to ship the access logs to the bucket you most recently created.
Copy the URL of the queue you created. Edit the `modules.d/aws.yml`file with the following configurations.
- module: aws
  cloudtrail:
    enabled: false
  cloudwatch:
    enabled: false
  ec2:
    enabled: true
    var.credential_profile_name: fb-aws
    var.queue_url: https://sqs.eu-central-1.amazonaws.com/836370109380/howtoguide-tutorial
  elb:
    enabled: false
  s3access:
    enabled: true
    var.credential_profile_name: fb-aws
    var.queue_url: https://sqs.eu-central-1.amazonaws.com/836370109380/access-log
  vpcflow:
    enabled: false
|
Enables the |
|
|
This is the AWS profile defined following the AWS standard. |
|
|
Add the URL to the queue containing notifications around the bucket containing the EC2 logs |
|
|
Add the URL to the queue containing notifications around the bucket containing the S3 access logs |
Once you have edited the config file, you need to restart Filebeat. To stop Filebeat, you can press CTRL + C in the terminal. Now let’s restart Filebeat by running the following command:
./filebeat -e
Step 6: Visualize Logs
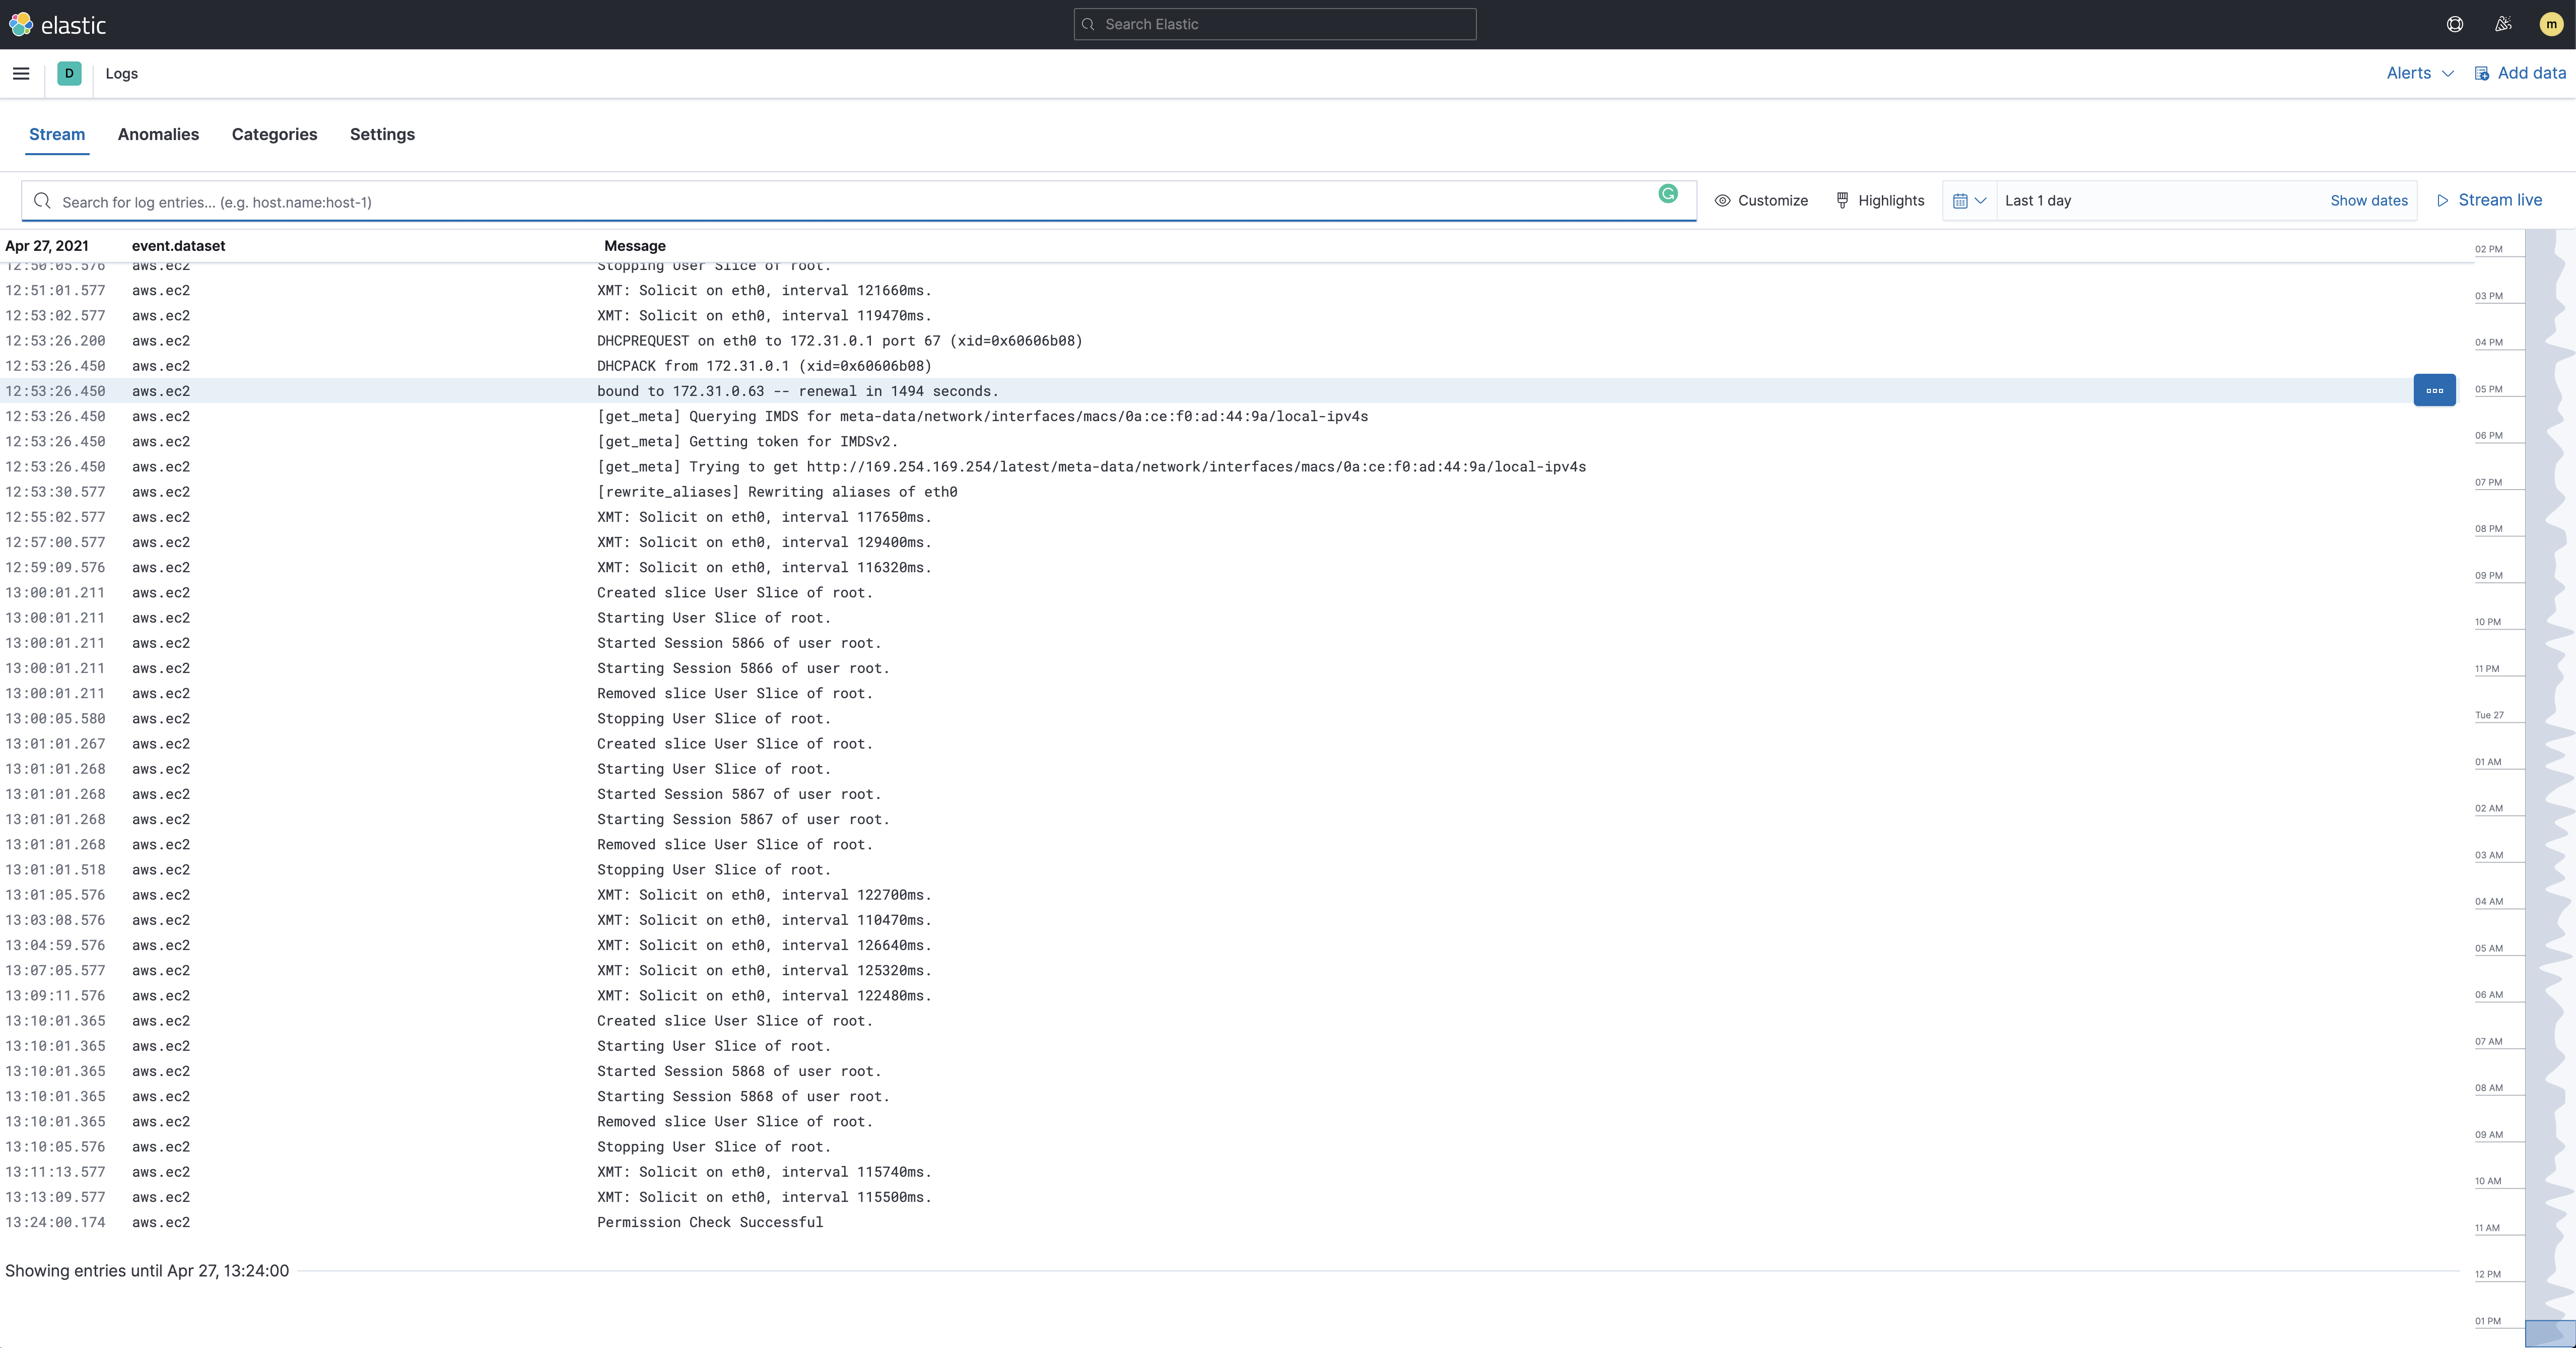
editNow that the logs are being shipped to Elasticsearch we can visualize them in Kibana. To see the raw logs, open the main menu in Kibana, then click Logs:
The filesets we used in the previous steps also come with pre-built dashboards that you can use to visualize the data. In Kibana, open the main menu and click Dashboard. Search for S3 and select the dashboard called: [Filebeat AWS] S3 Server Access Log Overview:
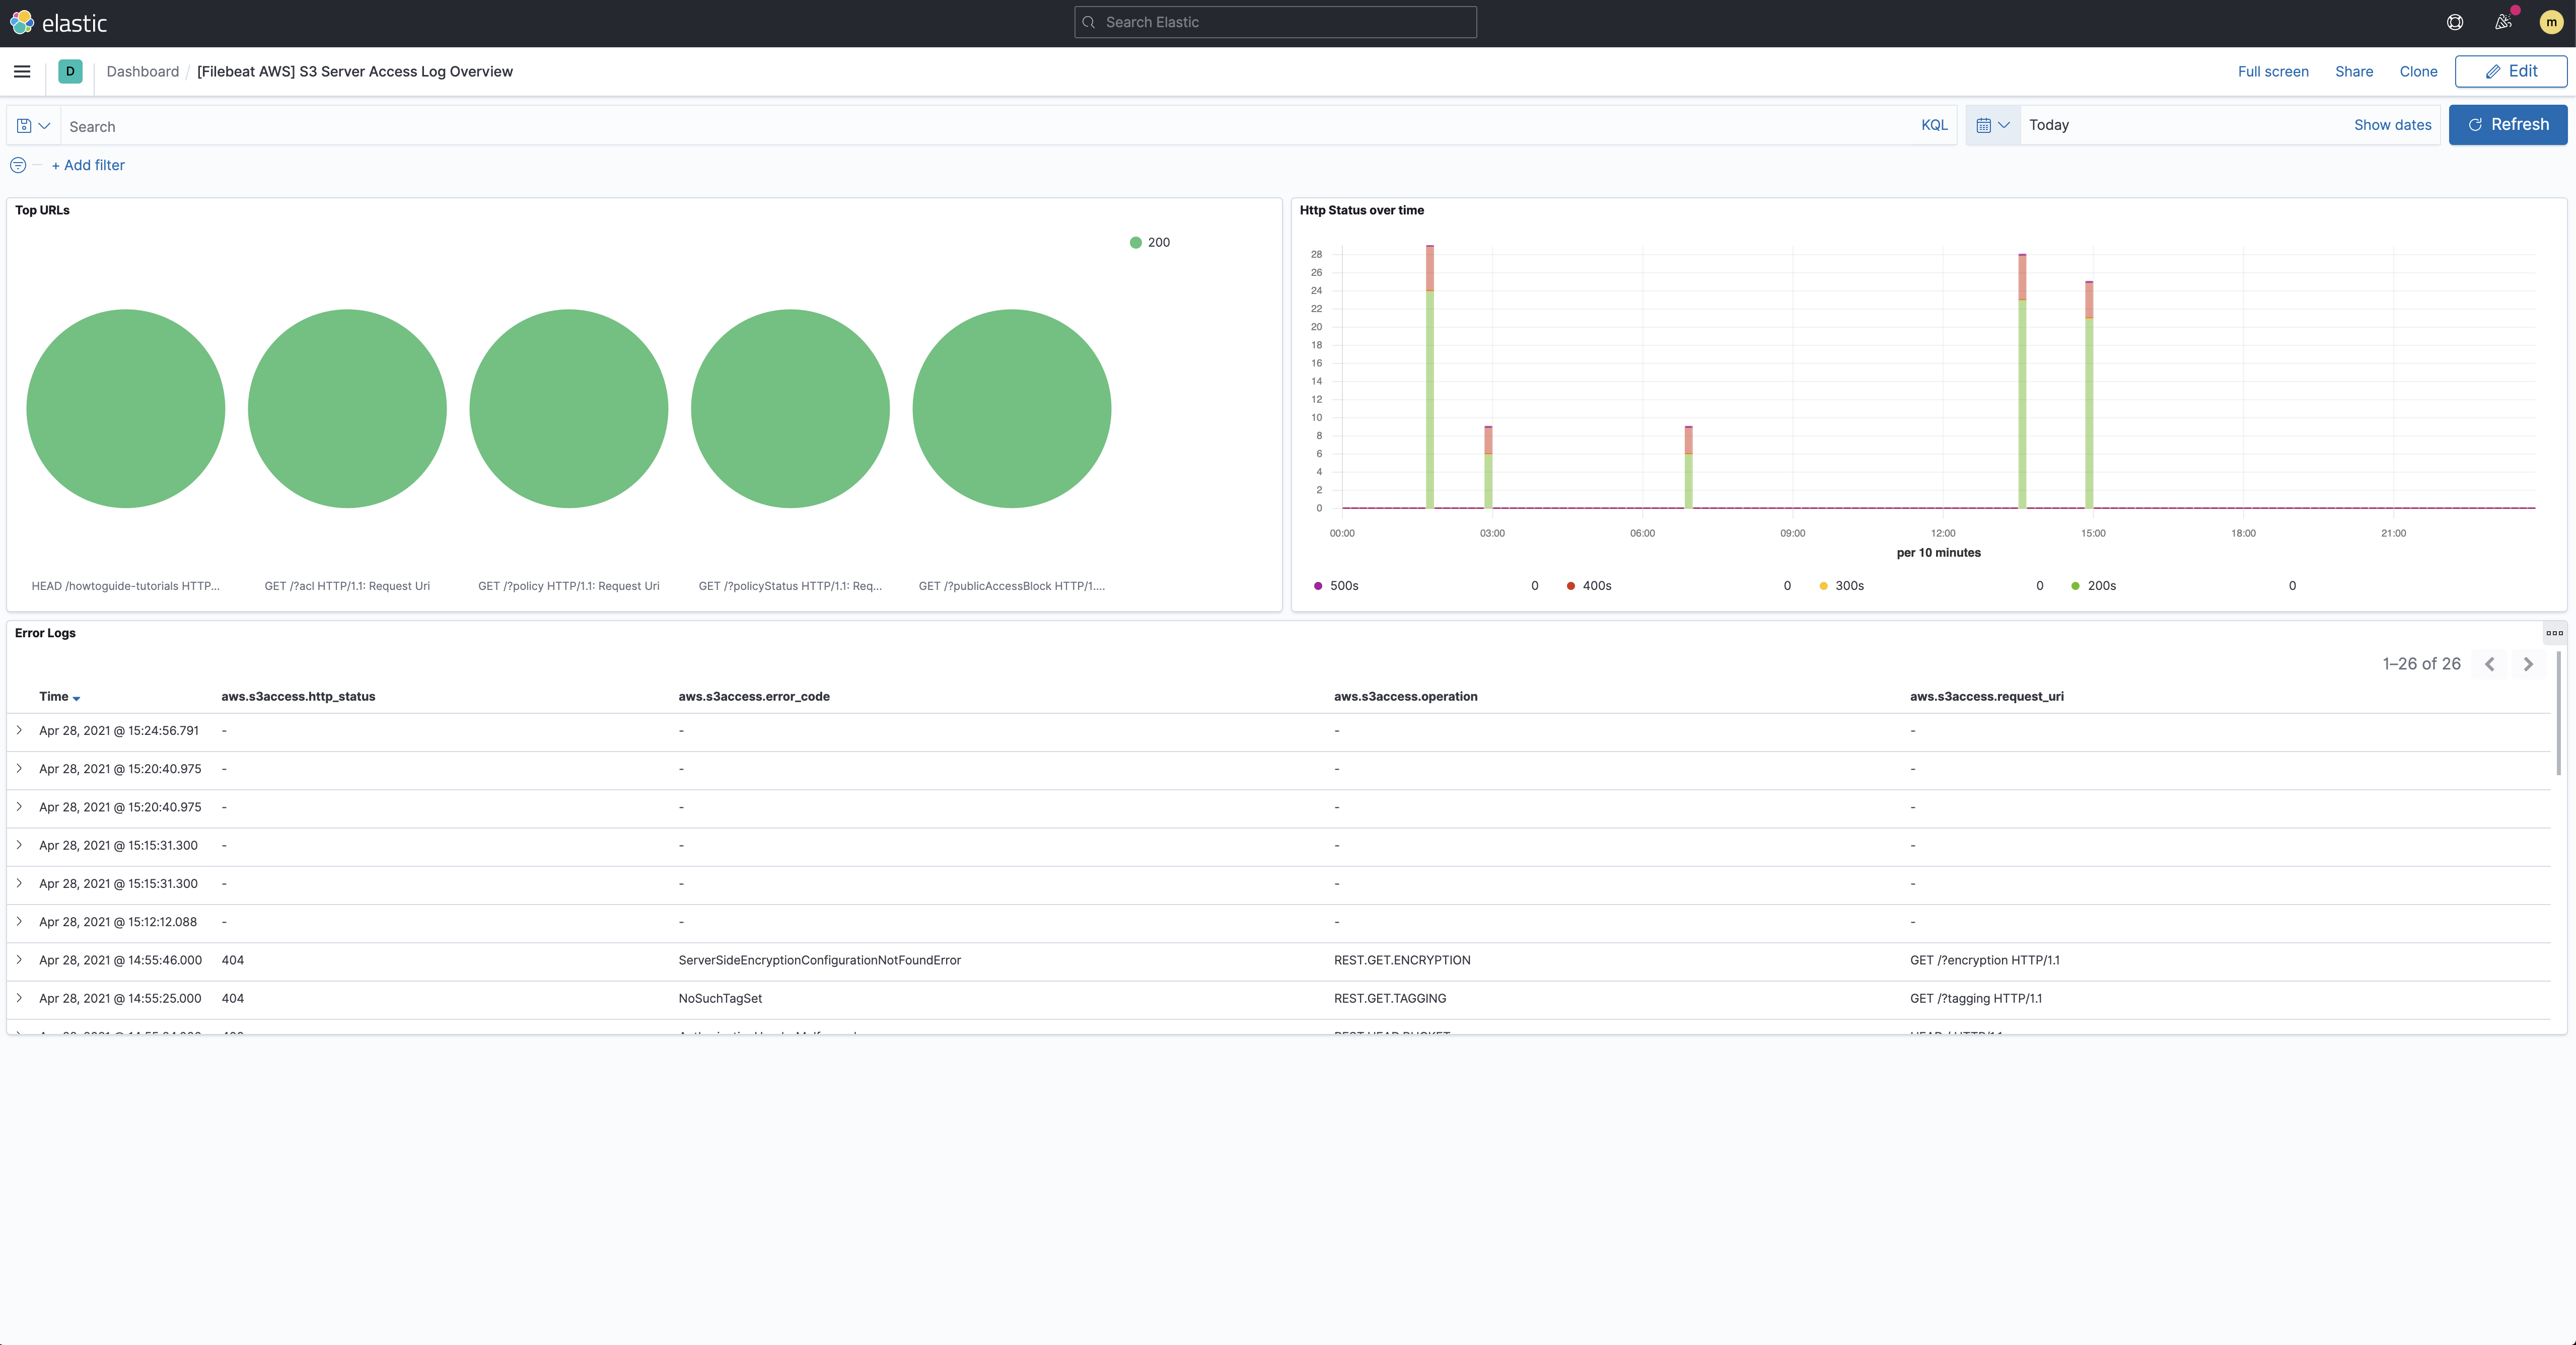
This gives you an overview of how your S3 buckets are being accessed.
Step 7: Collect Metrics
editTo monitor your AWS infrastructure you will need to first make sure your infrastructure data are being shipped to CloudWatch. To ship the data to Elasticsearch we are going to use the AWS module from Metricbeat. This module periodically fetches monitoring metrics from AWS CloudWatch using GetMetricData API for AWS services.
Extra AWS charges on CloudWatch API requests will be generated by this module. Please see AWS API requests for more details.
Step 8: Install and configure Metricbeat
editIn a new terminal window, run the following commands.
Install Metricbeat
editDownload and install Metricbeat.
curl -L -O https://artifacts.elastic.co/downloads/beats/metricbeat/metricbeat-8.2.3-amd64.deb
sudo dpkg -i metricbeat-8.2.3-amd64.deb
curl -L -O https://artifacts.elastic.co/downloads/beats/metricbeat/metricbeat-8.2.3-x86_64.rpm
sudo rpm -vi metricbeat-8.2.3-x86_64.rpm
curl -L -O https://artifacts.elastic.co/downloads/beats/metricbeat/metricbeat-8.2.3-darwin-x86_64.tar.gz
tar xzvf metricbeat-8.2.3-darwin-x86_64.tar.gz
curl -L -O https://artifacts.elastic.co/downloads/beats/metricbeat/metricbeat-8.2.3-linux-x86_64.tar.gz
tar xzvf metricbeat-8.2.3-linux-x86_64.tar.gz
- Download the Metricbeat Windows zip file from the downloads page.
-
Extract the contents of the zip file into
C:\Program Files. -
Rename the
metricbeat-<version>-windowsdirectory toMetricbeat. - Open a PowerShell prompt as an Administrator (right-click the PowerShell icon and select Run As Administrator).
-
From the PowerShell prompt, run the following commands to install Metricbeat as a Windows service:
PS > cd 'C:\Program Files\Metricbeat'
PS C:\Program Files\Metricbeat> .\install-service-metricbeat.ps1
If script execution is disabled on your system, you need to set the
execution policy for the current session to allow the script to run. For
example:
PowerShell.exe -ExecutionPolicy UnRestricted -File .\install-service-metricbeat.ps1.
Set up assets
editMetricbeat comes with predefined assets for parsing, indexing, and visualizing your data. Run the following command to load these assets. It may take a few minutes.
./metricbeat setup -e -E 'cloud.id=YOUR_DEPLOYMENT_CLOUD_ID' -E 'cloud.auth=elastic:YOUR_SUPER_SECRET_PASS'
|
Substitute your Cloud ID and an administrator’s |
Setting up Metricbeat is an admin-level task that requires extra privileges. As a best practice, use an administrator role to set up, and a more restrictive role for event publishing (which you will do next).
Configure Metricbeat output
editNext, you are going to configure Metricbeat output to Elasticsearch Service.
-
Use the Metricbeat keystore to store secure settings. Store the Cloud ID in the keystore.
./metricbeat keystore create
echo -n "<Your Deployment Cloud ID>" | ./metricbeat keystore add CLOUD_ID --stdin
-
To store metrics in Elasticsearch with minimal permissions, create an API key to send data from Metricbeat to Elasticsearch Service. Log into Kibana (you can do so from the Cloud Console without typing in any permissions) and select Management → Dev Tools. Send the following request:
POST /_security/api_key { "name": "metricbeat-monitor", "role_descriptors": { "metricbeat_writer": { "cluster": ["monitor", "read_ilm"], "index": [ { "names": ["metricbeat-*"], "privileges": ["view_index_metadata", "create_doc"] } ] } } } -
The response contains an
api_keyand anidfield, which can be stored in the Metricbeat keystore in the following format:id:api_key.echo -n "IhrJJHMB4JmIUAPLuM35:1GbfxhkMT8COBB4JWY3pvQ" | ./metricbeat keystore add ES_API_KEY --stdin
Make sure you specify the
-nparameter; otherwise, you will have painful debugging sessions due to adding a newline at the end of your API key. -
To see if both settings have been stored, run the following command:
./metricbeat keystore list
-
To configure Metricbeat to output to Elasticsearch Service, edit the
metricbeat.ymlconfiguration file. Add the following lines to the end of the file.cloud.id: ${CLOUD_ID} output.elasticsearch: api_key: ${ES_API_KEY} -
Finally, test if the configuration is working. If it is not working, verify if you used the right credentials and add them again.
./metricbeat test output
Now that the output is working, you are going to set up the AWS module.
Step 9: Configure the AWS module
editTo collect metrics from your AWS infrastructure, we’ll use the
Metricbeat AWS module. This module
contains many metricsets: billing, cloudwatch, dynamodb, ebs,
ec2, elb, lambda, and many more. Each metricset is created to help you
stream and process your data. In this tutorial, we’re going to show you a
few examples using the ec2 and the billing metricsets.
-
Let’s enable the AWS module in Metricbeat.
./metricbeat modules enable aws
-
Edit the
modules.d/aws.ymlfile with the following configurations.- module: aws period: 24h metricsets: - billing credential_profile_name: mb-aws cost_explorer_config: group_by_dimension_keys: - "AZ" - "INSTANCE_TYPE" - "SERVICE" group_by_tag_keys: - "aws:createdBy" - module: aws period: 300s metricsets: - ec2 credential_profile_name: mb-aws
Defines the module that is going to be used.
Defines the period at which the metrics are going to be collected
Defines the metricset that is going to be used.
This is the AWS profile defined following the AWS standard.
Make sure that the AWS user used to collect the metrics from CloudWatch has at least the following permissions attached to it:
{
    "Version": "2012-10-17",
    "Statement": [
        {
            "Action": [
                "ec2:DescribeInstances",
                "ec2:DescribeRegions",
                "cloudwatch:GetMetricData",
                "cloudwatch:ListMetrics",
                "sts:GetCallerIdentity",
                "iam:ListAccountAliases",
                "tag:getResources",
                "ce:GetCostAndUsage"
            ],
            "Effect": "Allow",
            "Resource": "*"
        }
    ]
}
You can now start Metricbeat:
./metricbeat -e
Step 10: Visualize metrics
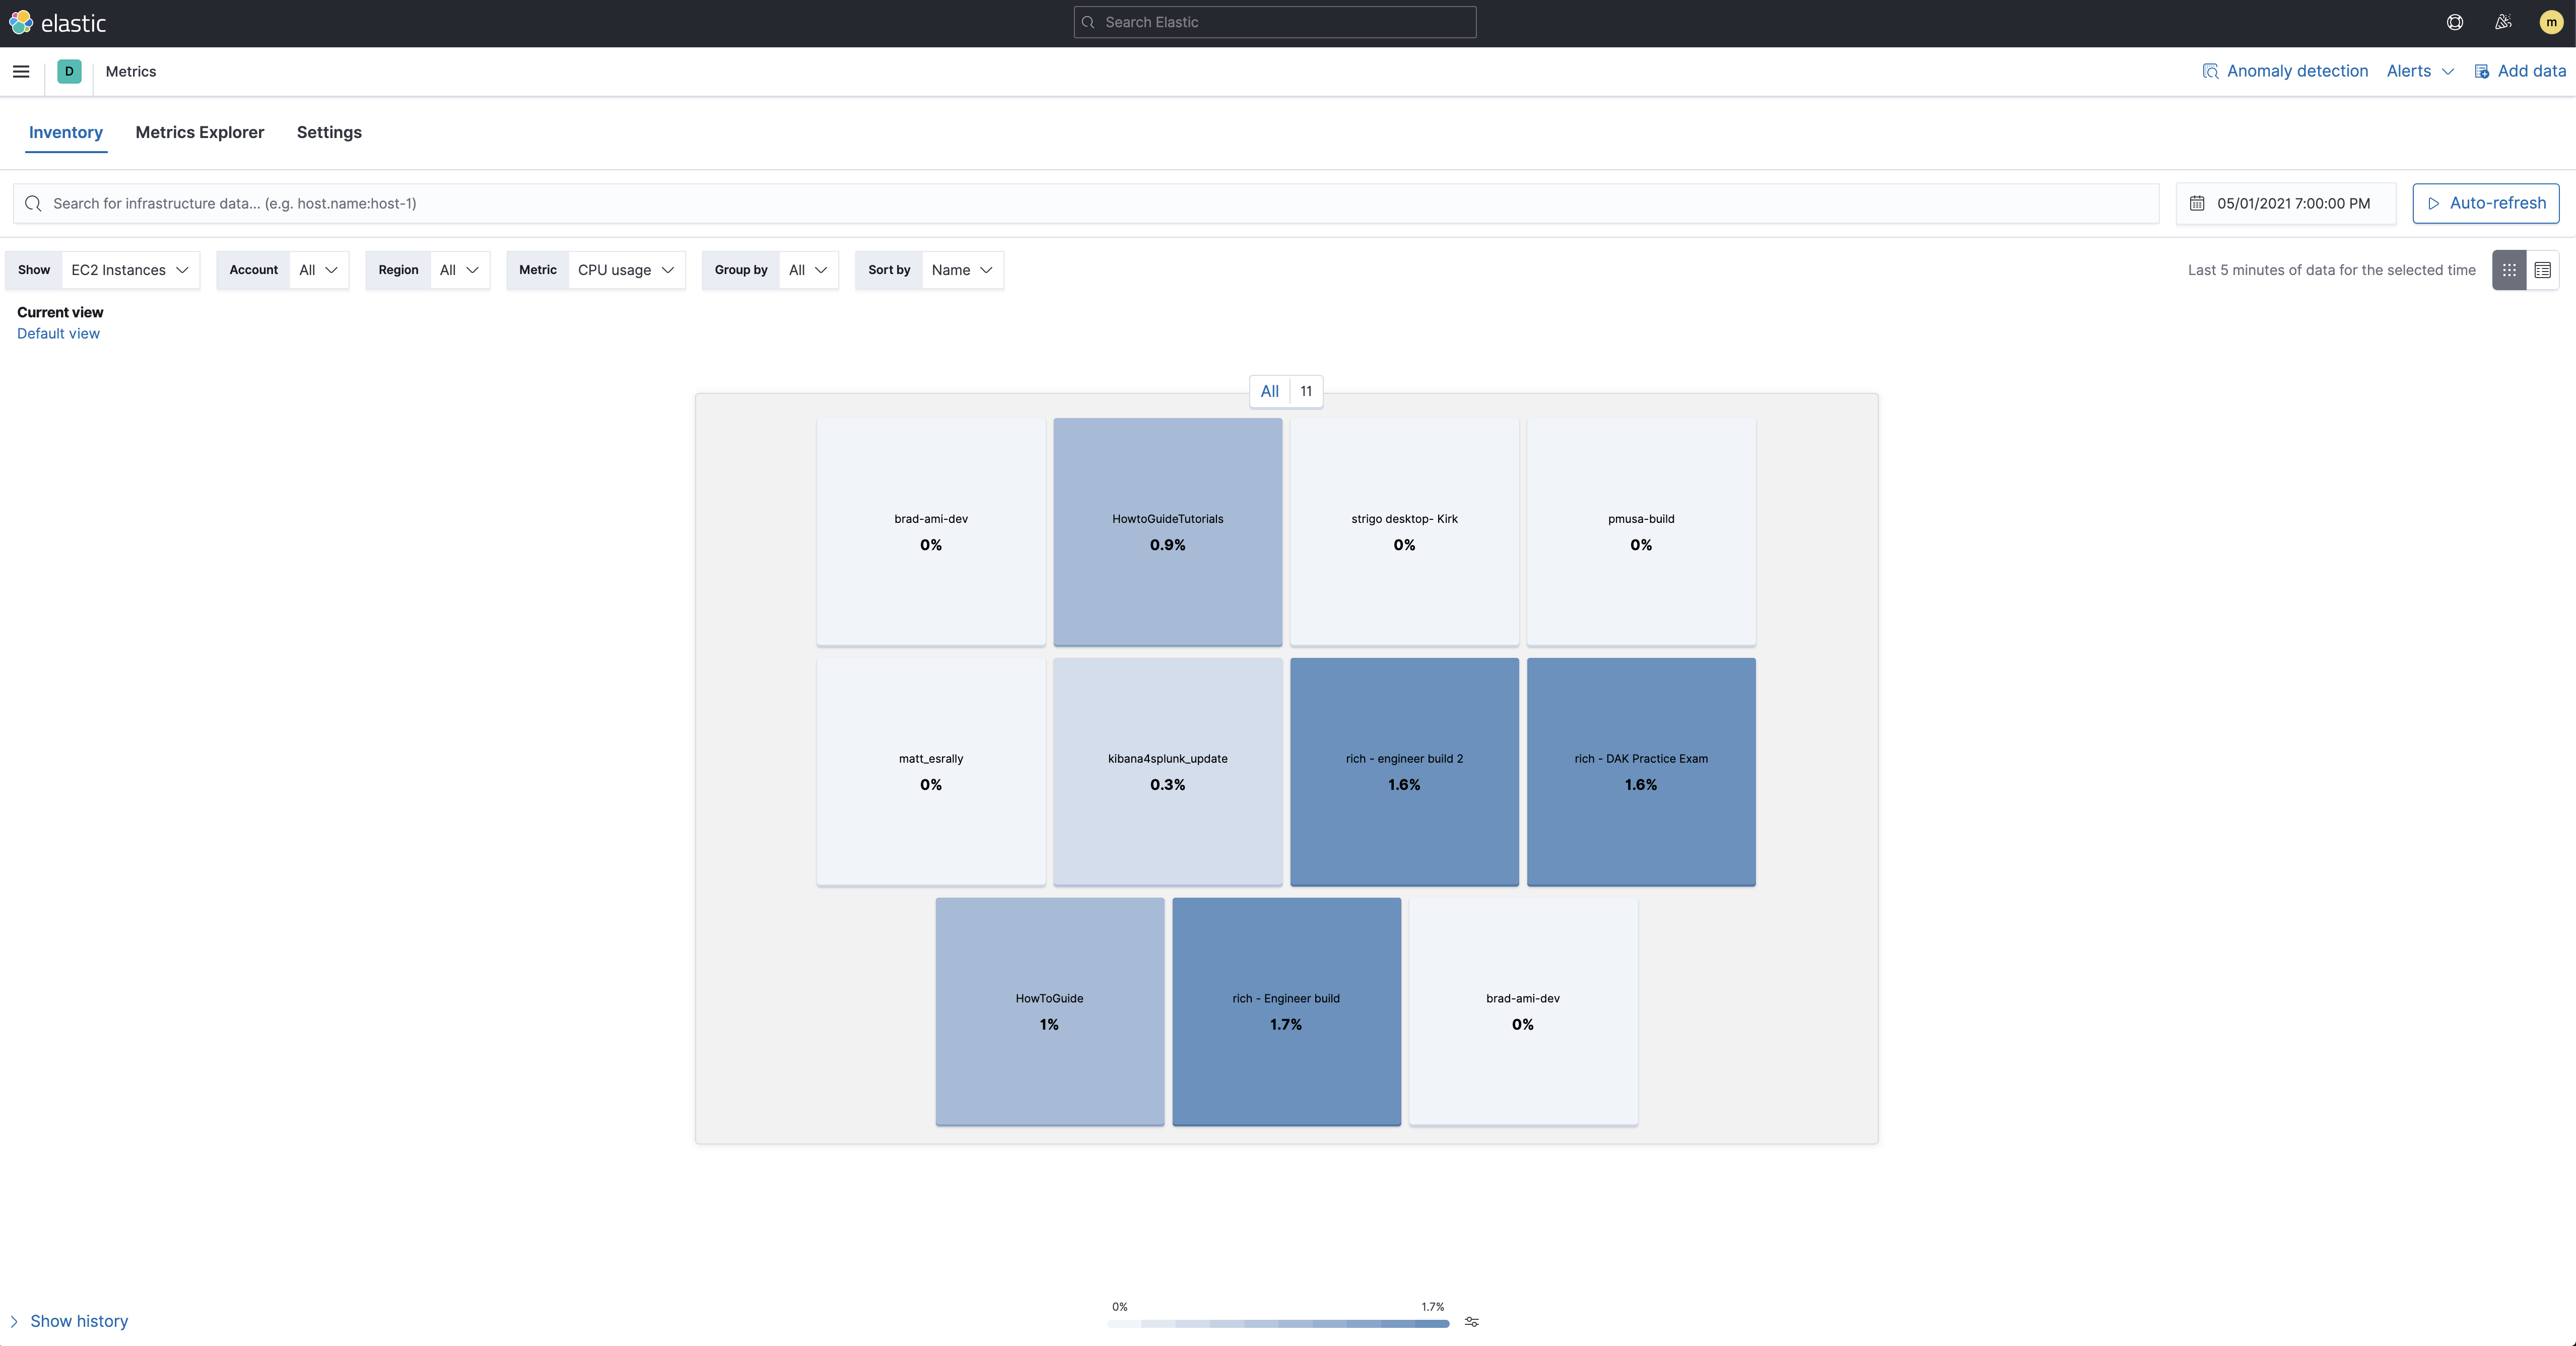
editNow that the metrics are being streamed to Elasticsearch we can visualize them in Kibana. In Kibana, open the main menu and click Metrics. Make sure to show the AWS source and the EC2 Instances:
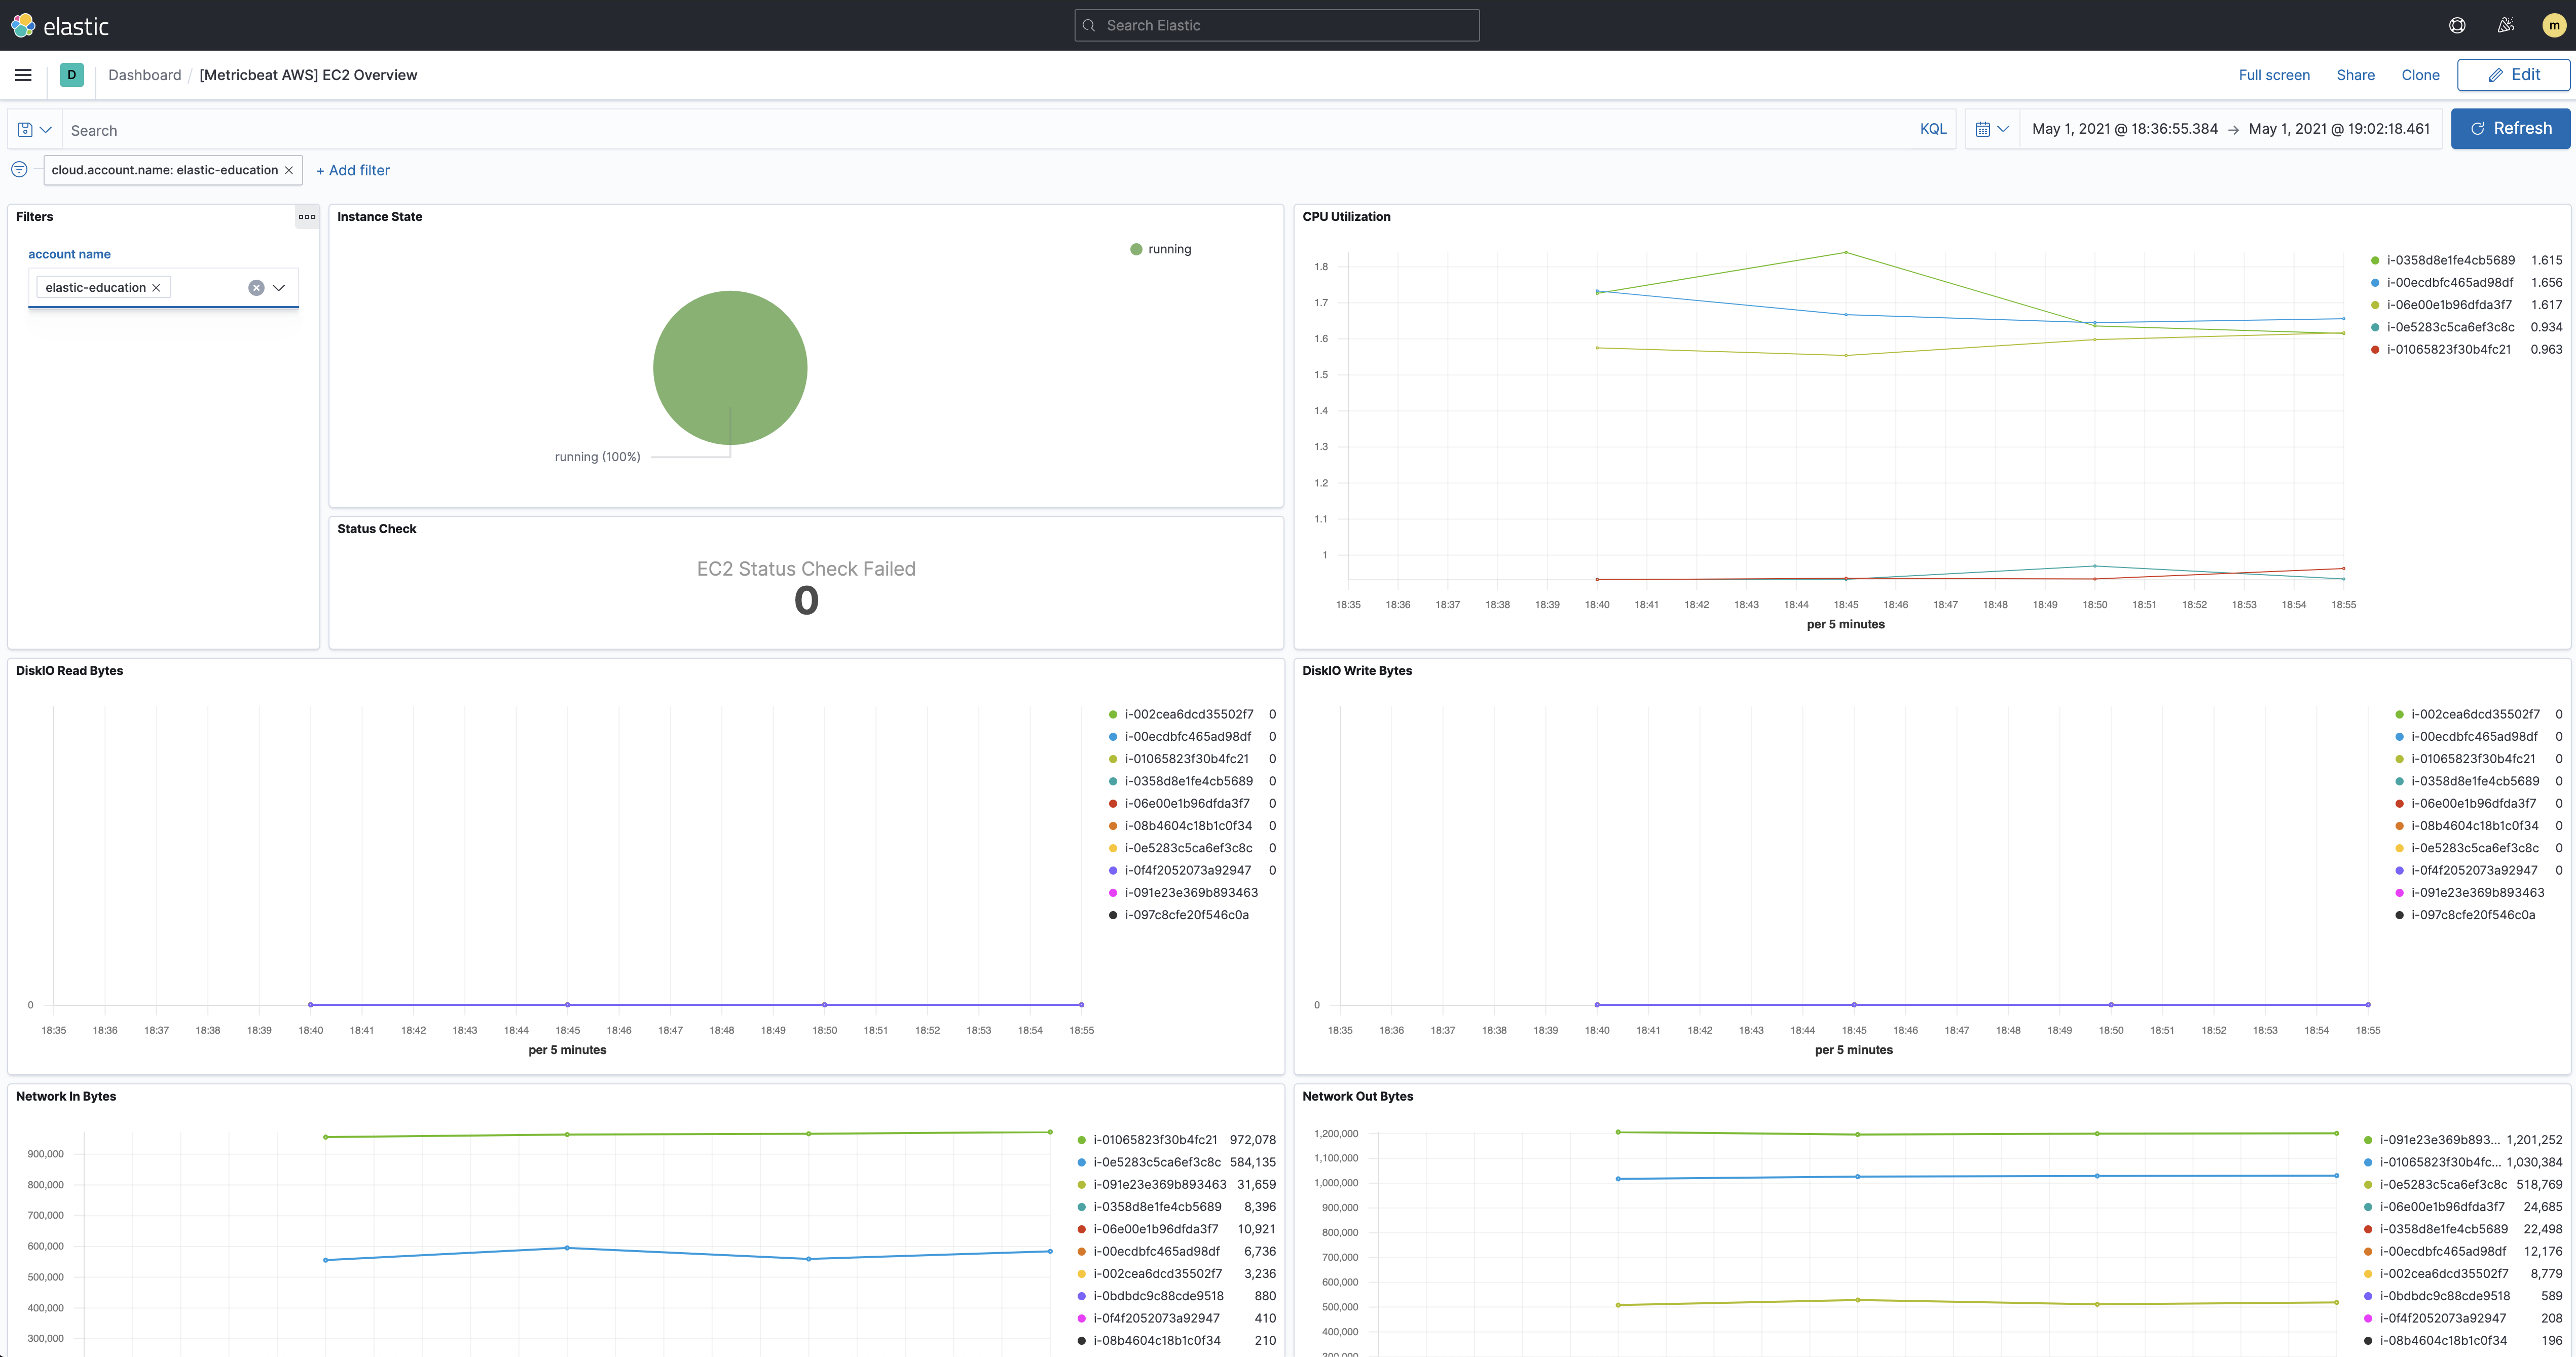
The metricsets we used in the previous steps also comes with pre-built dashboard that you can use to visualize the data. In Kibana, open the main menu and click Dashboard. Search for EC2 and select the dashboard called: [Metricbeat AWS] EC2 Overview:
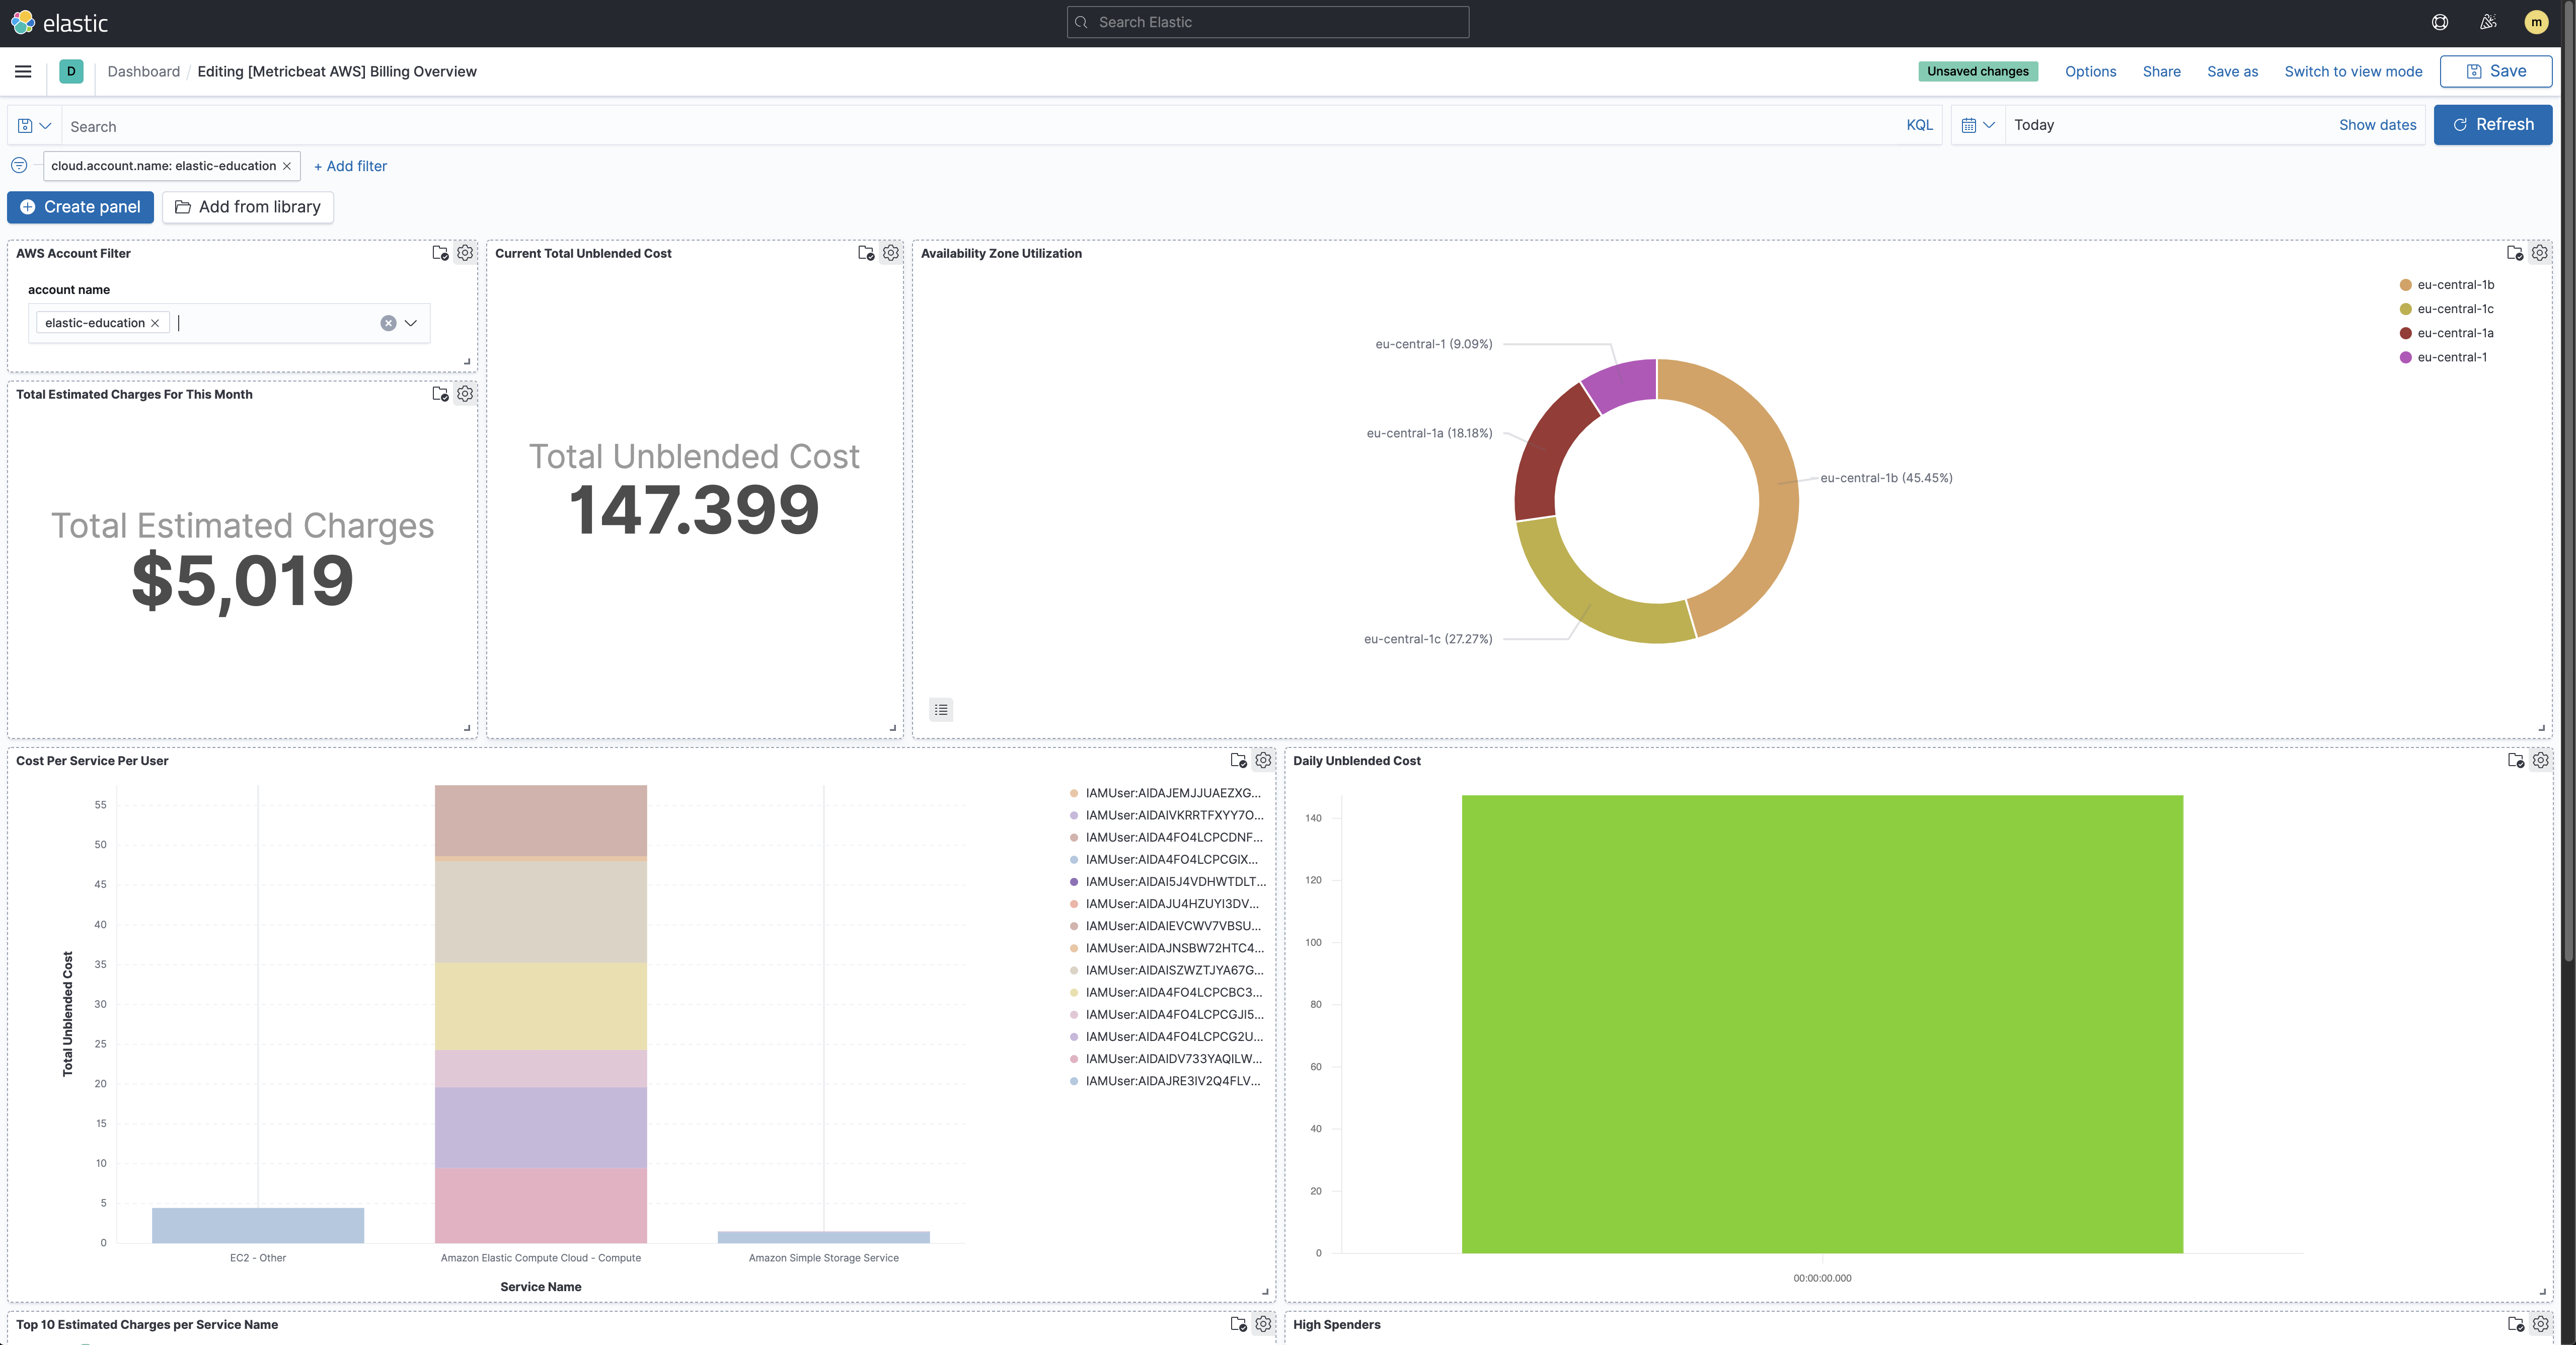
If you want to track your billings on AWS, you can also check the [Metricbeat AWS] Billing Overview dashboard: