Create a logs threshold rule
editCreate a logs threshold rule
edit- To access this page, go to Observability > Logs.
- Click Alerts > Create alert.
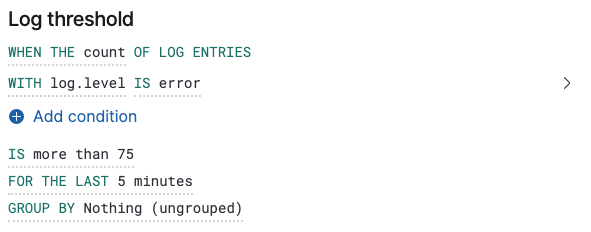
Fields and comparators
editThe comparators available for conditions depend on the chosen field. The combinations available are:
- Numeric fields: more than, more than or equals, less than, or less than or equals.
- Aggregatable fields: is and is not.
- Non-aggregatable fields: matches, does not match, matches phrase, does not match phrase.
There are several key supported use cases. You can create rules based on fields containing or matching a text pattern, rules based on a numeric field and arithmetic operator, or a single rule with multiple conditions.
A different Elasticsearch query type backs each of these comparators, and in some scenarios, it is important to know what these are so that you can configure your rule correctly. The comparators listed above map to the following Elasticsearch query types:
- more than: range using gt
- more than or equals: range using gte
- less than: range using lt
- less than or equals: range using lte
- is and is not: term
- matches and does not match: match
- matches phrase and does not match phrase: match_phrase
Group by
editIt is possible to set a group by for log threshold rules. You may set one or multiple groupings.
When group by is set, a composite aggregation is performed against the selected fields. When any of these groups match the selected rule conditions, an alert fires per group.
In scenarios where there are multiple groupings selected, the group name is separated by commas.
For example, if host.name and host.architecture are selected as group by fields, and there are two hosts (Host A and Host B)
and two architectures (Architecture A and Architecture B), the composite aggregation forms multiple groups. We’ll focus on the
Host A, Architecture A and Host B, Architecture B groups.
If the group Host A, Architecture A matches the rule conditions, but Host B, Architecture B doesn’t, one alert is triggered.
Similarly, if there was a single group by selected, for example, host.name, and Host A matches the conditions, but Host B doesn’t,
one alert is triggered for Host A. If both groups matches the conditions, then two alerts are triggered.
When group by fields are selected, but no documents contain the selected field(s) within the given time range of when the alert is triggered,
then you can’t determine the group(s). This is relevant when the rule condition is sensitive to a certain number of documents, and
that number might be 0. For example, when querying if a host has less than five documents matching a condition, an alert is not triggered
due to the host not reporting logs for the duration of the query.
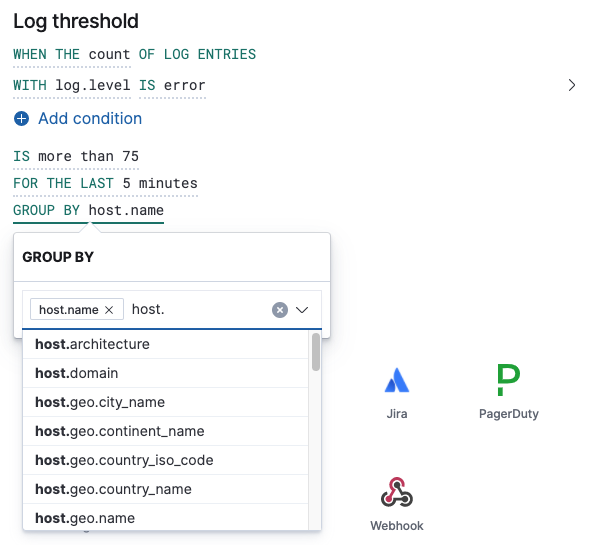
Chart previews
editTo determine how many log entries would match each part of your configuration, you can view a chart preview for each condition. This is useful for determining how many log entries would match each part of your configuration. When a group by is set, the chart displays a bar per group. To view the preview, select the arrow next to the condition.
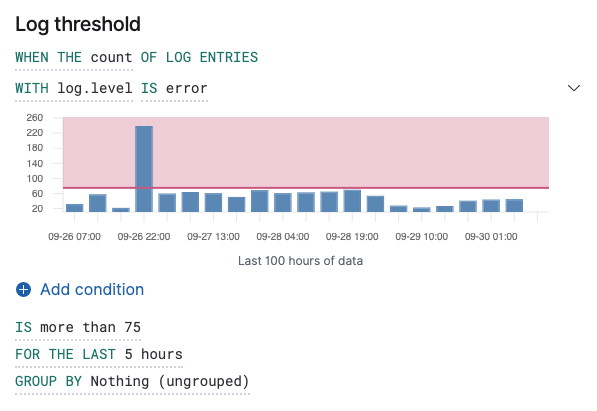
The shaded area denotes the threshold that has been selected.
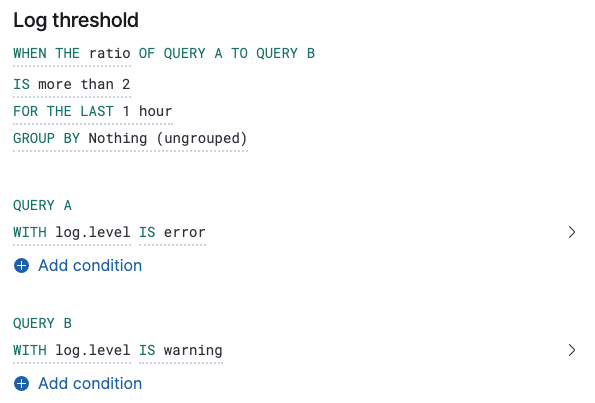
Ratio rules
editTo understand how one query compares to another query, create a ratio rule. This type of rule is triggered when a ratio value meets a specific threshold. The ratio threshold value is the document count of the first query (query A), divided by the document count of the second query (query B).
The following example triggers an alert when there are twice as many error logs to warning logs.
As it is not possible to divide by 0, when the document count of query A or query B is 0, it results in an undefined/indeterminate ratio. In this scenario, no alert is triggered.
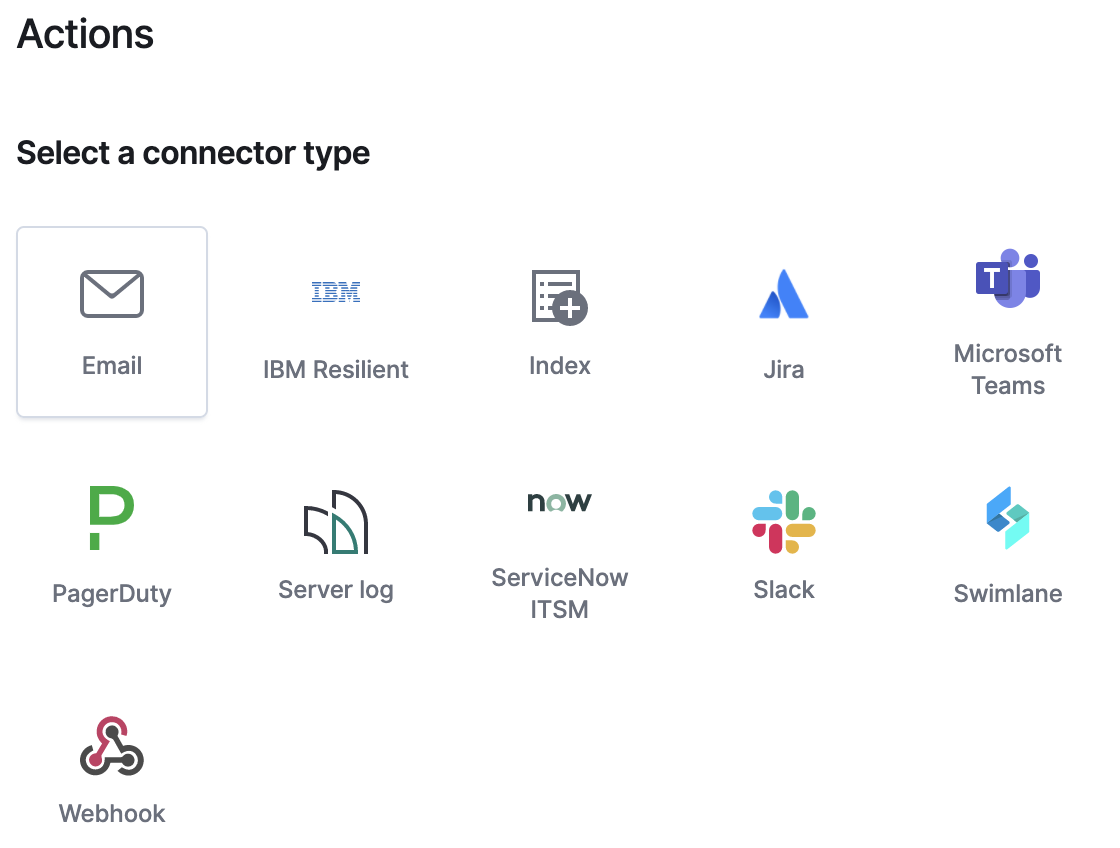
Action types
editExtend your rules by connecting them to actions that use the following supported built-in integrations.
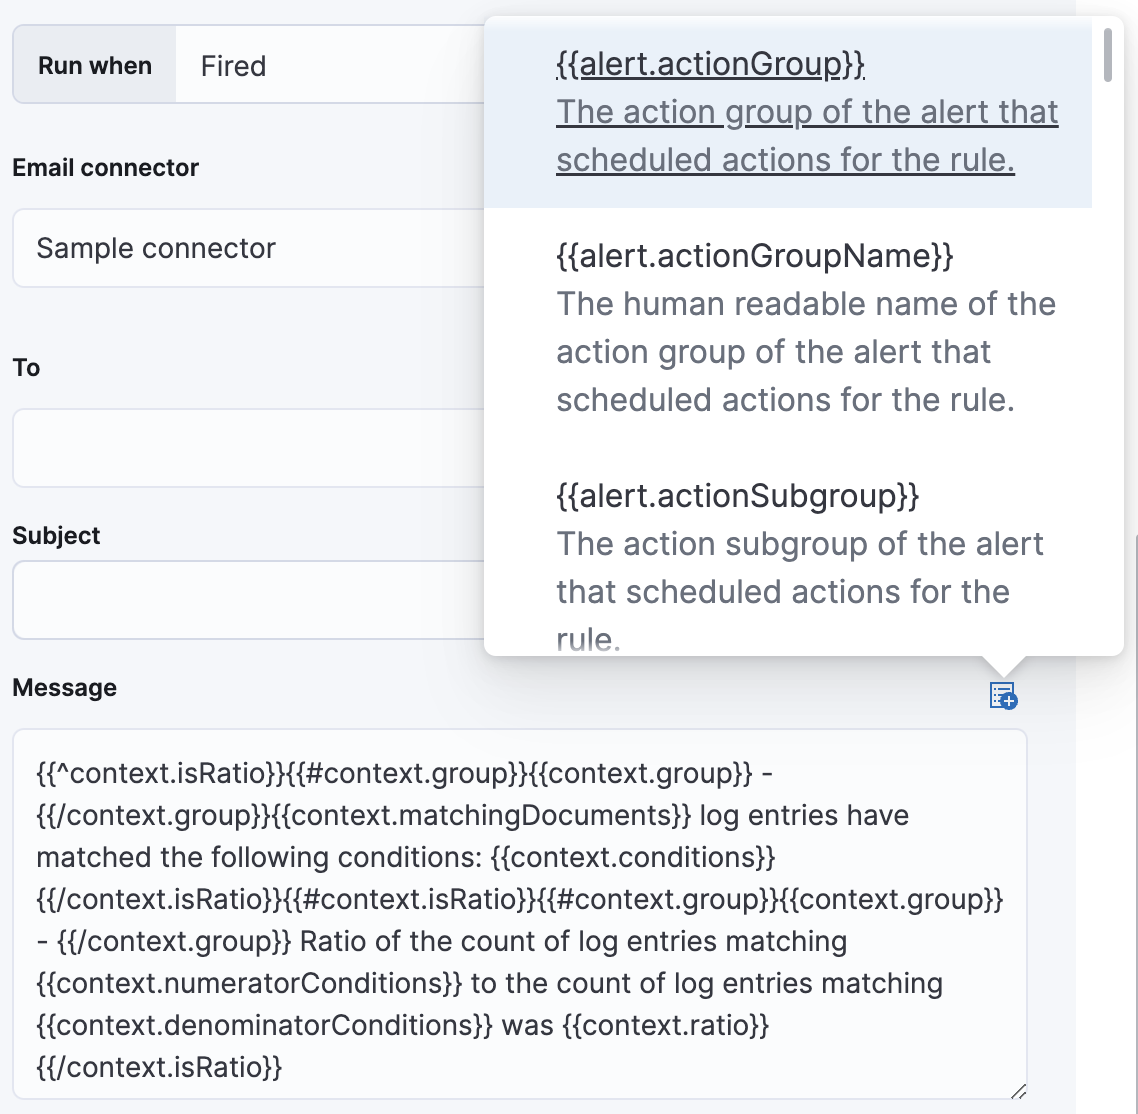
Action variables
editUse the default notification message or customize it. You can add more context to the message by clicking the icon above the message text box and selecting from a list of available variables.
Performance considerations
editWhen setting a group by, we recommend using the more than comparator for your threshold—this allows our queries to apply eager filtering, leading to significant performance improvements. Otherwise, we suggest using a group by field with the lowest cardinality (number of possibilities).
Elasticsearch queries (advanced)
editWhen a rule check is performed, a query is built based on the configuration of the rule. For the vast majority of cases it shouldn’t be necessary to know what these queries are. However, to determine an optimal configuration or to aid with debugging, it might be useful to see the structure of these queries. Below is an example Elasticsearch query for the following configuration:
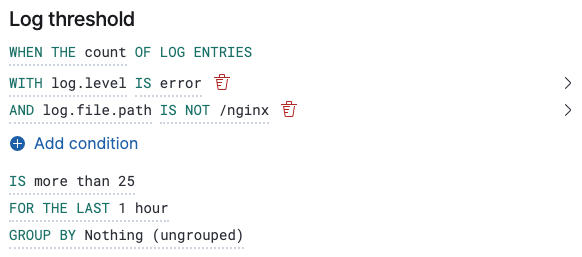
Without group by.
{
   "index":"filebeat-*",
   "allowNoIndices":true,
   "ignoreUnavailable":true,
   "body":{
      "track_total_hits":true,
      "query":{
         "bool":{
            "filter":[
               {
                  "range":{
                     "@timestamp":{
                        "gte":1600771280862,
                        "lte":1600774880862,
                        "format":"epoch_millis"
                     }
                  }
               },
               {
                  "term":{
                     "log.level":{
                        "value":"error"
                     }
                  }
               }
            ],
            "must_not":[
               {
                  "term":{
                     "log.file.path":{
                        "value":"/nginx"
                     }
                  }
               }
            ]
         }
      },
      "size":0
   }
}
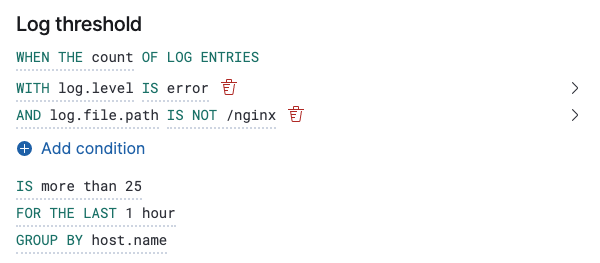
With group by.
{
   "index":"filebeat-*",
   "allowNoIndices":true,
   "ignoreUnavailable":true,
   "body":{
      "query":{
         "bool":{
            "filter":[
               {
                  "range":{
                     "@timestamp":{
                        "gte":1600768208910,
                        "lte":1600779008910,
                        "format":"epoch_millis"
                     }
                  }
               }
            ]
         }
      },
      "aggregations":{
         "groups":{
            "composite":{
               "size":40,
               "sources":[
                  {
                     "group-0-host.name":{
                        "terms":{
                           "field":"host.name"
                        }
                     }
                  }
               ]
            },
            "aggregations":{
               "filtered_results":{
                  "filter":{
                     "bool":{
                        "filter":[
                           {
                              "range":{
                                 "@timestamp":{
                                    "gte":1600771808910,
                                    "lte":1600775408910,
                                    "format":"epoch_millis"
                                 }
                              }
                           },
                           {
                              "term":{
                                 "log.level":{
                                    "value":"error"
                                 }
                              }
                           }
                        ],
                        "must_not":[
                           {
                              "term":{
                                 "log.file.path":{
                                    "value":"/nginx"
                                 }
                              }
                           }
                        ]
                     }
                  }
               }
            }
         }
      },
      "size":0
   }
}
Settings
editWith log threshold rules, it’s not possible to set an explicit index pattern as part of the configuration. The index pattern is instead inferred from Log indices on the Settings page of the Logs app.
With each execution of the rule check, the Log indices setting is checked, but it is not stored when the rule is created.
The Timestamp field that is set under Settings determines which field is used for timestamps in queries.