Analyze monitors
editAnalyze monitors
editTo access this page, go to Observability > Uptime > Monitors. Click on a listed monitor to view more details and analyze further.
The monitor detail screen displays several panels of information.
Status panel
editThe Status panel displays a summary of the latest information regarding your monitor. You can view its availability, monitor ID, type, and any assigned tags. You can click a link to visit the targeted URL, view when the TLS certificate expires, and determine the amount of time elapsed since the last check.
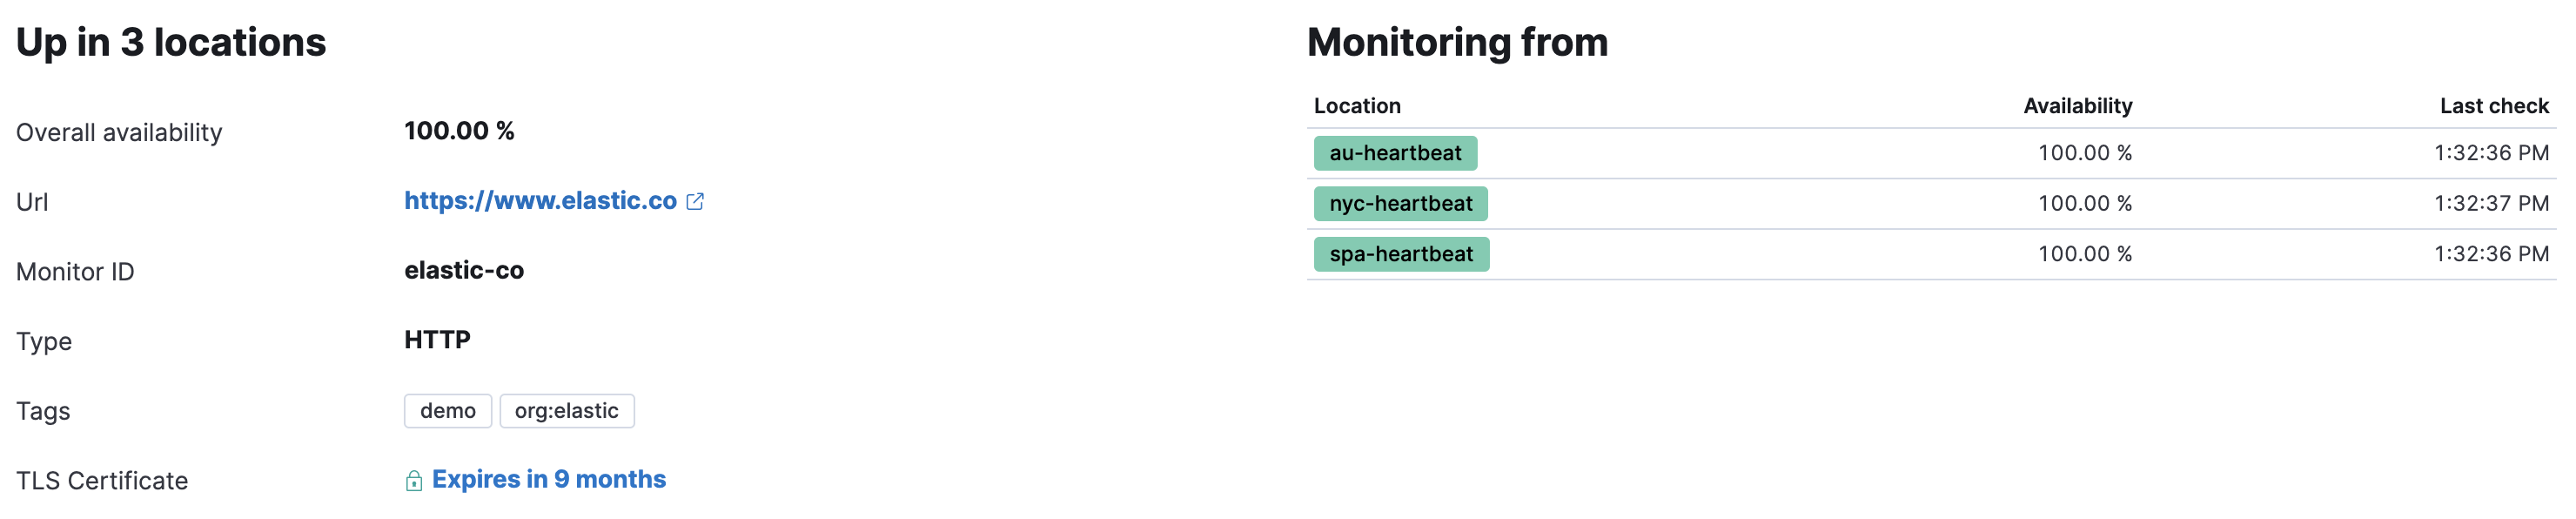
The Monitoring from list displays service availability per monitoring location, along with the amount of time elapsed since data was received from that location. The availability percentage is the percentage of successful checks made during the selected time period.
To display a map with each location as a pinpoint, you can toggle the availability view from list view to map view.
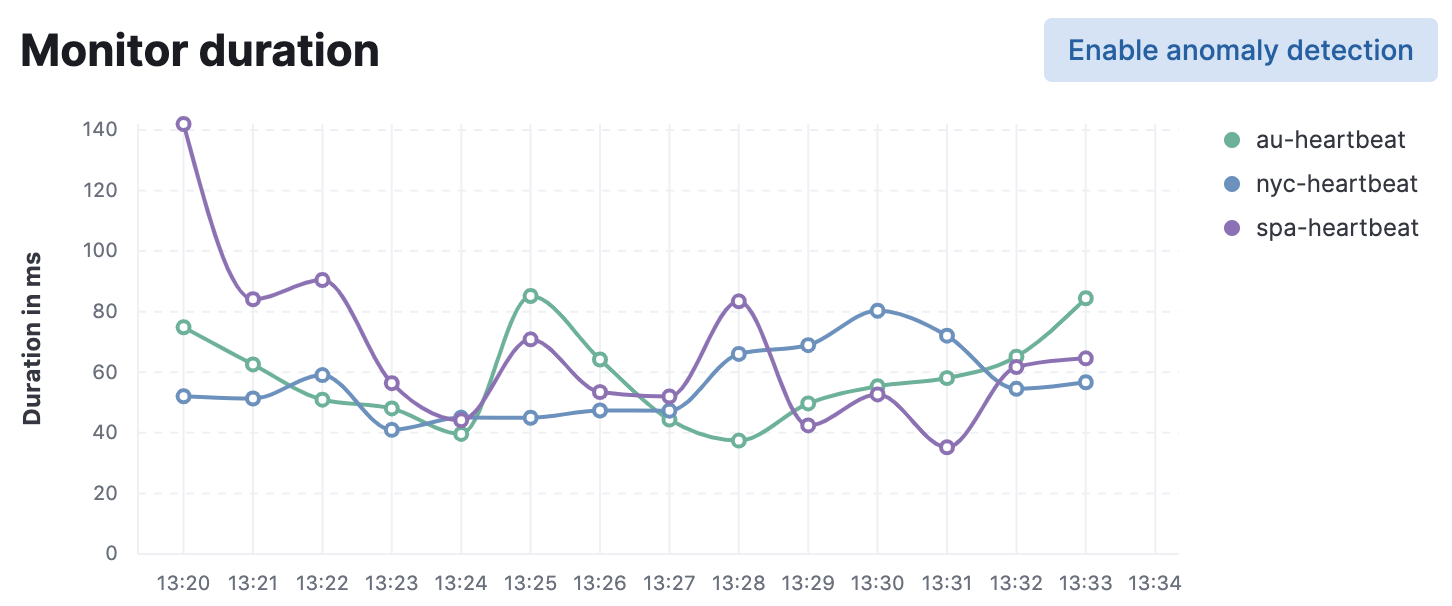
Monitor duration
editThe Monitor duration chart displays the timing for each check that was performed. The visualization helps you to gain insights into how quickly requests resolve by the targeted endpoint and give you a sense of how frequently a host or endpoint was down in your selected time span.
Included on this chart is the anomaly detection (machine learning) integration. For more information, see Inspect Uptime duration anomalies.
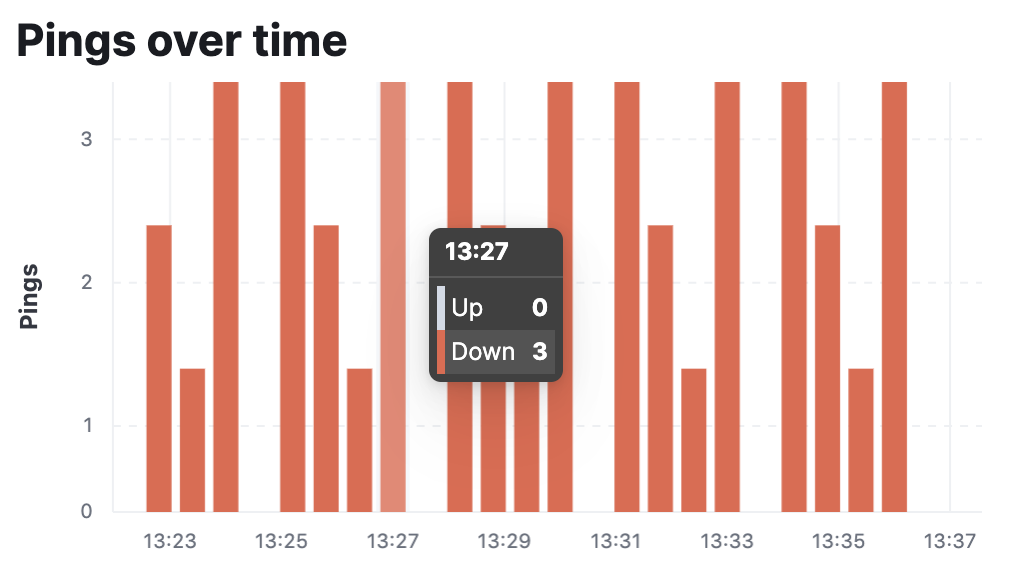
Pings over time
editThe Pings over time chart is a graphical representation of the check statuses over time. Hover over the charts to display crosshairs with specific numeric data.
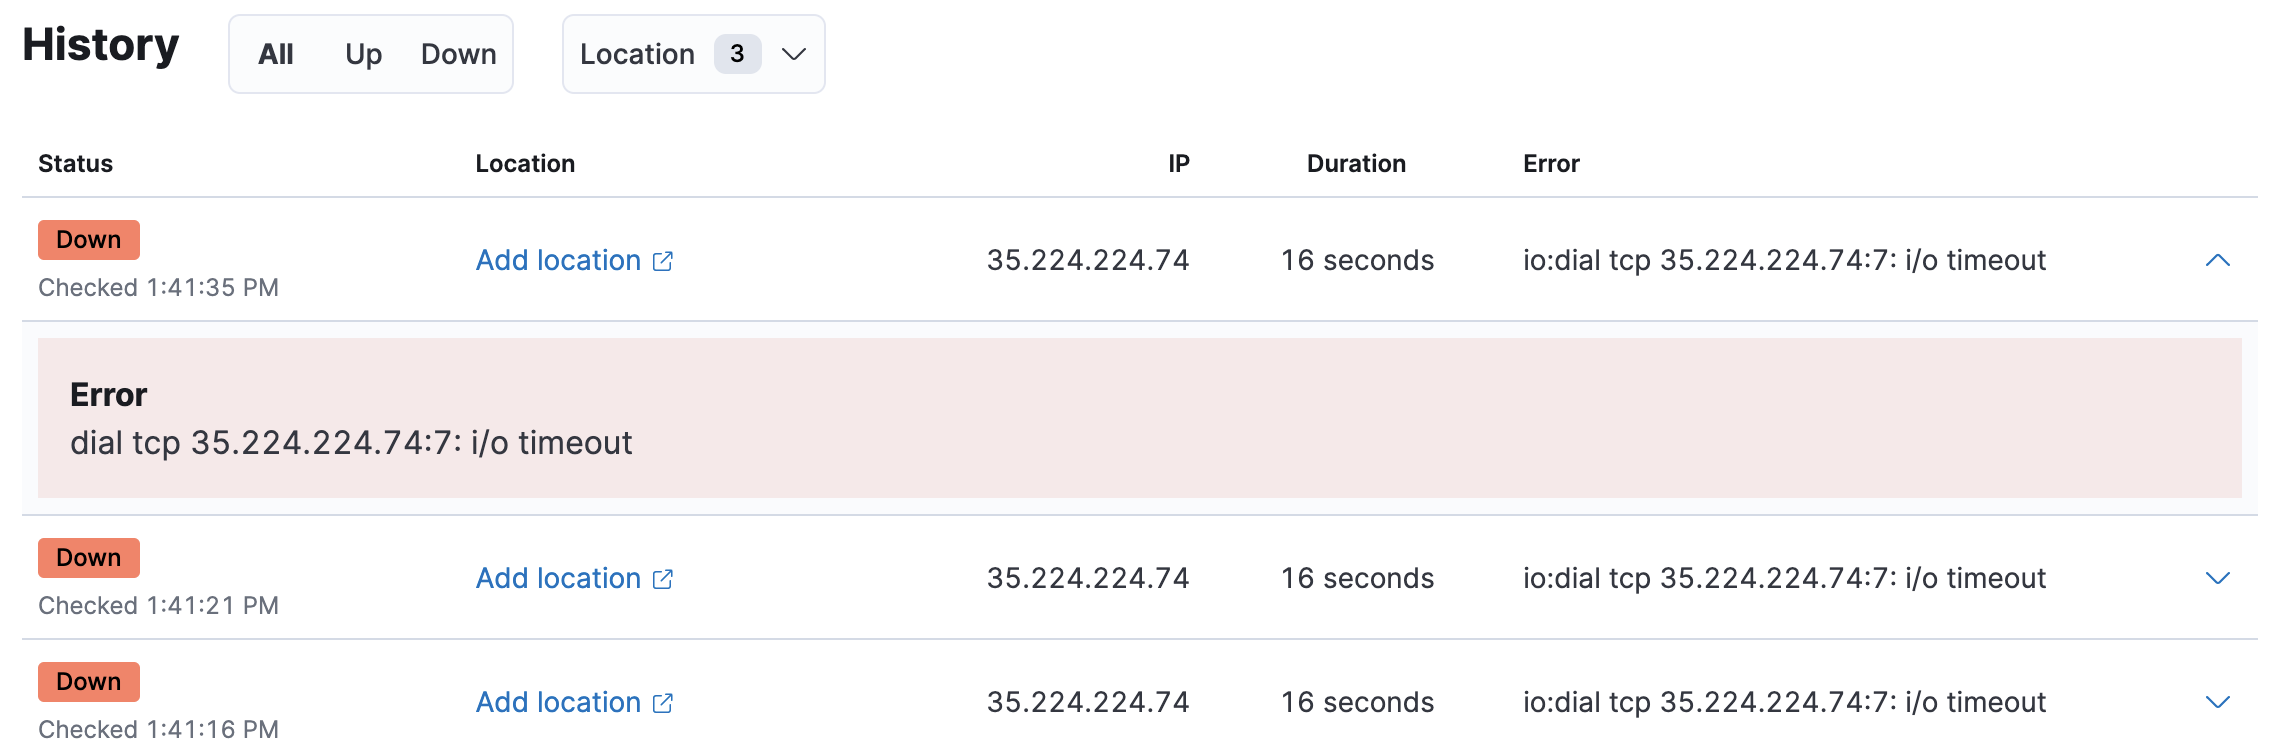
Check history
editThe History table lists the total count of this monitor’s checks for the selected date range.
To help find recent problems on a per-check basis, you can filter by status
and location.
This table can help you gain insights into more granular details about recent individual data points that Heartbeat is logging about your host or endpoint.