Create a metrics threshold rule
editCreate a metrics threshold rule
editBased on the metrics that are listed on the Metrics Explorer page within the Metrics app, you can create a threshold rule to notify you when a metric has reached or exceeded a value for a specific time period.
Additionally, each rule can be defined using multiple conditions that combine metrics and thresholds to create precise notifications.
- To access this page, go to Observability > Metrics.
- On the Inventory page or the Metrics Explorer page, click Alerts > Metrics.
- Select Create threshold alert.
When you select Create threshold alert, the rule is automatically populated with the same parameters you’ve configured on the Metrics Explorer page. If you’ve chosen a graph per value, your rule is pre-configured to monitor and notify about each individual graph displayed on the page.
You can also create a rule based on a single graph. On the Metrics Explorer page, click Actions > Create alert. The condition and filter sections of the threshold rule are automatically populated.
Metric conditions
editConditions for each rule can be applied to specific metrics that you select. You can select the aggregation type, the metric, and by including a warning threshold value, you can be alerted on multiple threshold values based on severity scores. To help you determine which thresholds are meaningful to you, the preview charts provide a visualization.
In this example, the conditions state that you will receive a critical alert for hosts with a CPU usage of 120% or above and a warning alert if CPU usage is 100% or above. Note that you will receive an alert only if memory usage is 20% or above, as per the second condition.
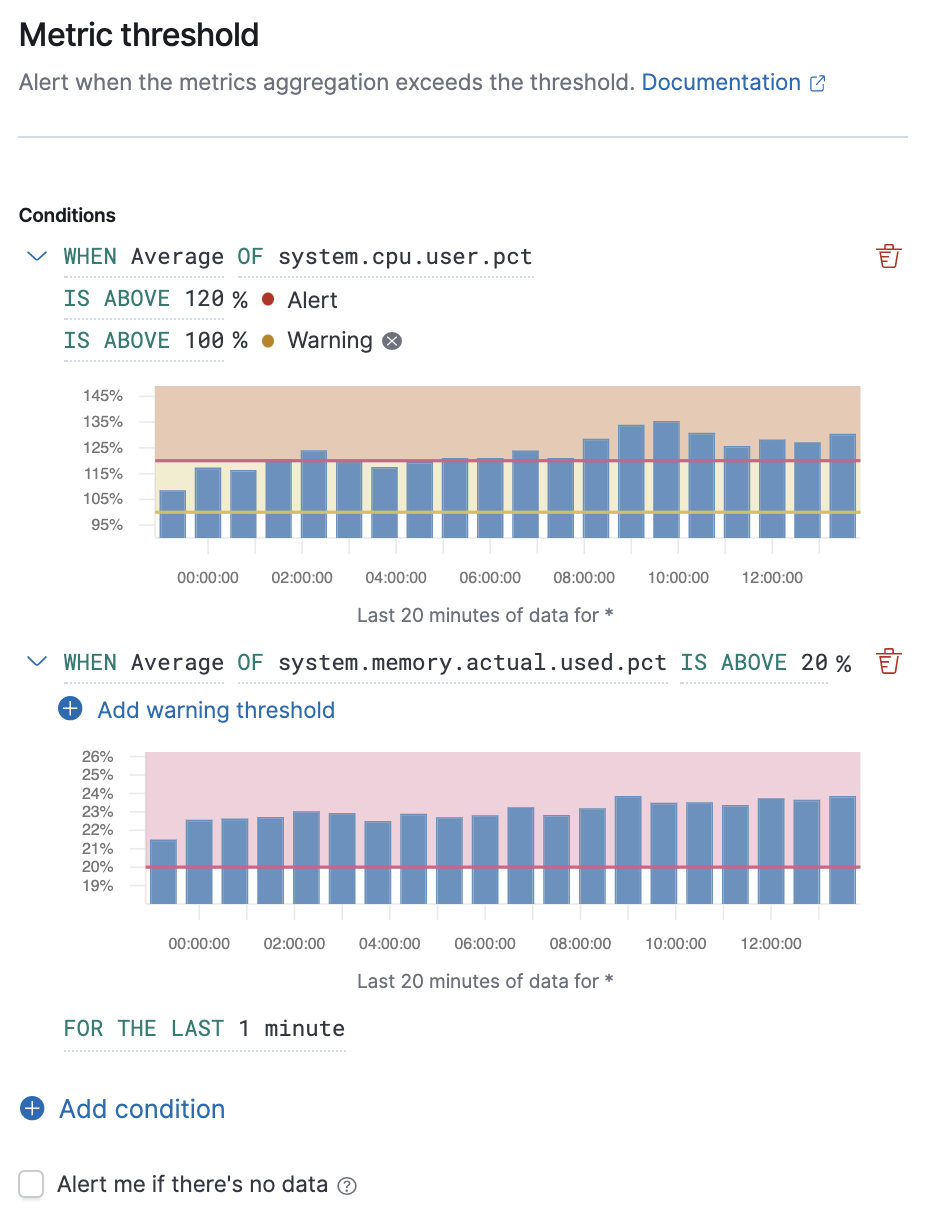
When you select Alert me if there’s no data, the rule is triggered if the metrics don’t report any data over the expected time period, or if the rule fails to query Elasticsearch.
Filtering and grouping
edit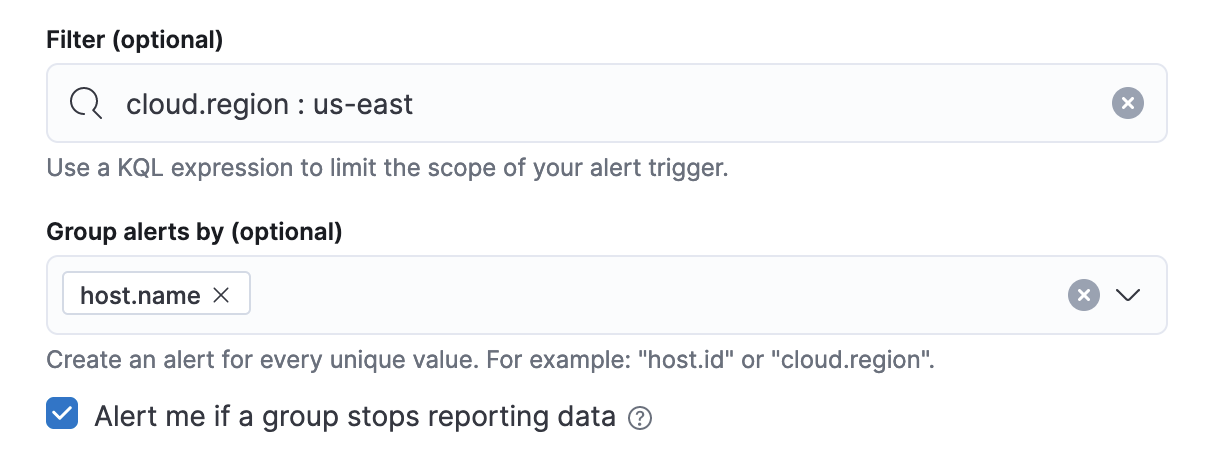
The Filters control the scope of the rule. If used, the rule will only evaluate metric data that matches the query in this field. In this example, the rule will only alert on metrics reported from a Cloud region called us-east.
The Group alerts by creates an instance of the alert for every unique value of the field added. For example, you can create a rule per host or every mount point of each host. You can also add multiple fields. In this example, the rule will individually track the status of each host.name in your infrastructure. You will only receive an alert about host-1, if `host.name: host-1 passes the threshold, but host-2 and host-3 do not.
When you select Alert me if a group stops reporting data, the rule is triggered if a group that previously reported metrics does not report them again over the expected time period.
If you include the same field in both your Filter and your Group by, you may receive fewer results than you’re expecting. For example, if you filter by cloud.region: us-east, then grouping by cloud.region will have no effect because the filter query can only match one region.
Action types
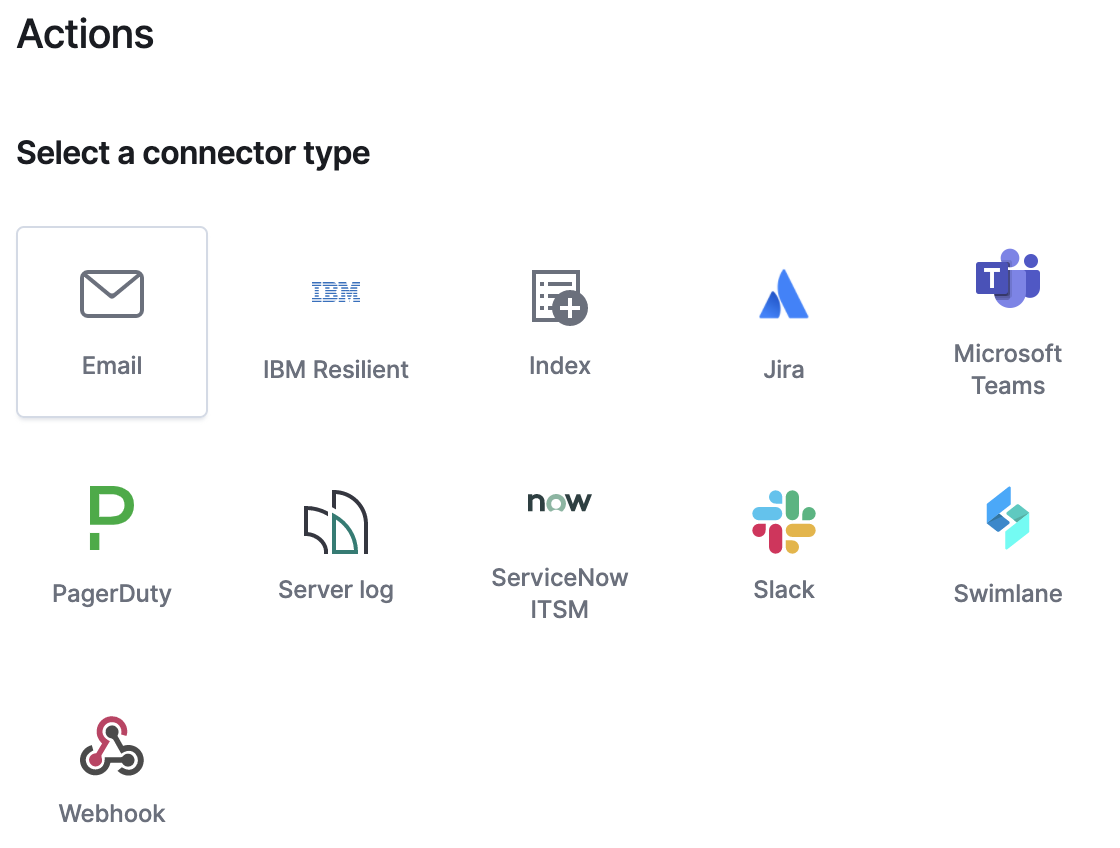
editYou can extend your rules by connecting them to actions that use the following supported built-in integrations.
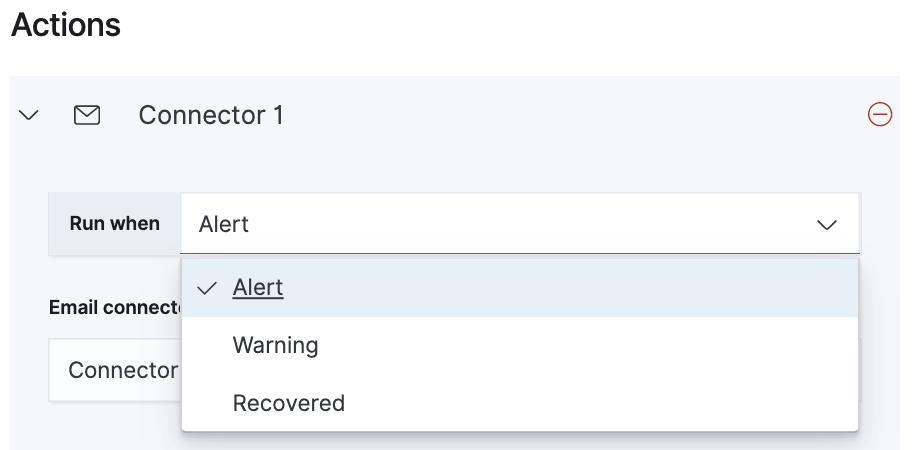
When configuring an action type, you can define precisely when the alert is triggered by selecting a specific
threshold condition: Alert, Warning, or Recovered (a value that was once above a threshold has now dropped below it).
Action variables
editThis section details the variables that metrics threshold rules will send to your actions.
Basic variables
edit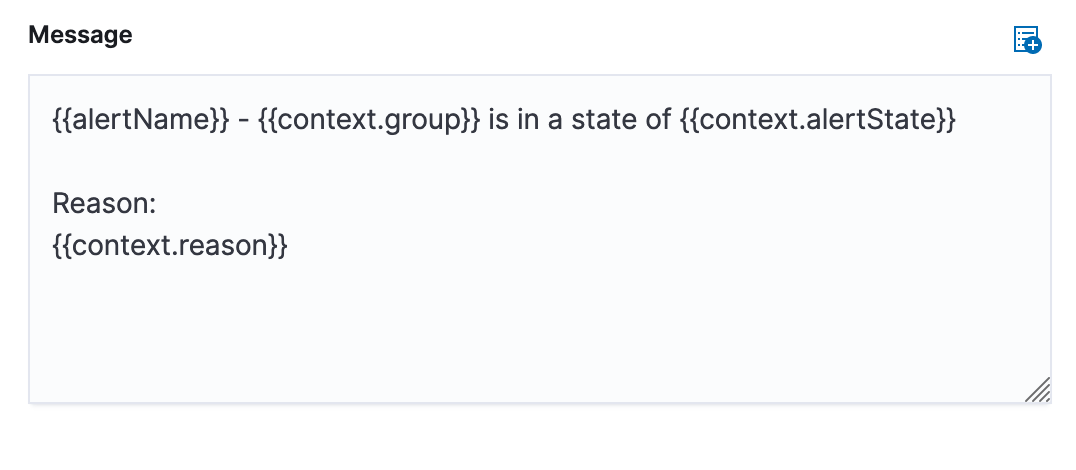
The default message for a metrics threshold rule displays the basic variables you can use.
-
context.group: This variable resolves to the group that the rule conditions detected. For Inventory rules, this is the name of a monitored host, pod, container, and so on. For metric threshold rules, this is the value of the field specified in the Create alert per field or*if the rule is configured to aggregate your entire infrastructure. -
context.alertState: Depending on why the action is triggered, this variable resolves toALERT,NO DATA, orERROR.ALERTmeans the rule condition is detected,NO DATAmeans that no data was returned for the time period that the rule queried, andERRORindicates an error when querying the data. -
context.reason: This variable describes why the rule is in its current state. For each of the rule conditions, it includes the detected value of the monitored metric, and a description of the threshold. -
context.timestamp: This variable resolves to the timestamp of when the rule was evaluated.
Advanced variables
edit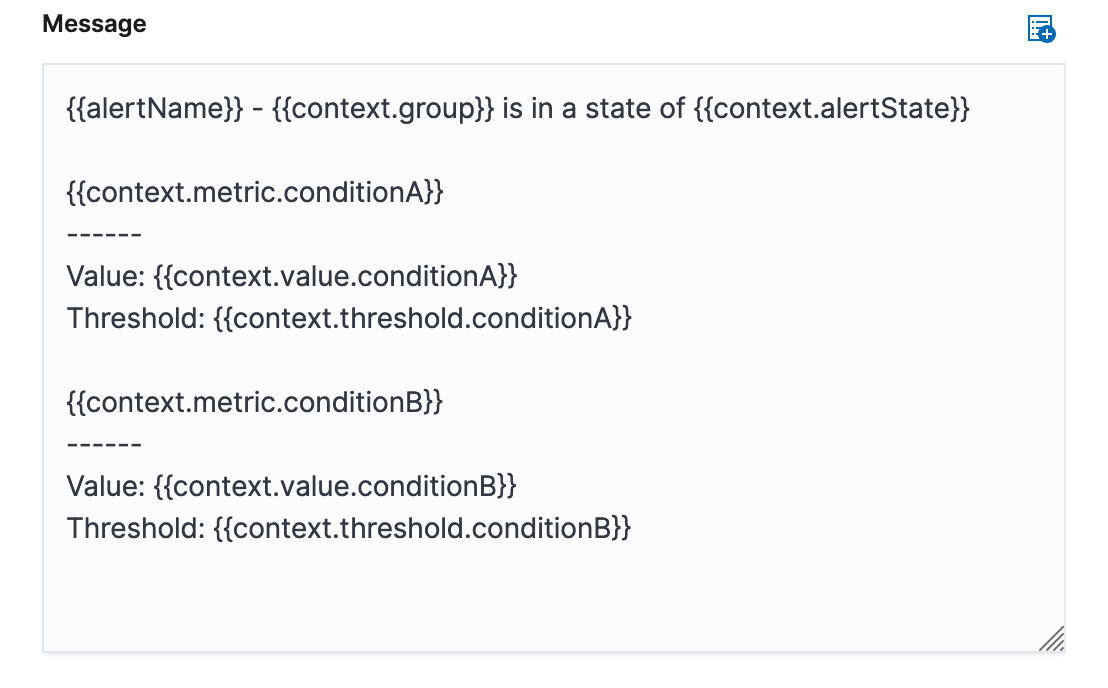
Instead of using context.reason to provide all the information you need, there may be cases when you’d like
to customize your action message. Metrics threshold rules provide advanced context variables that have a tree structure.
These variables must use the structure of {{context.[Variable Name].condition[Number]}}. For example,
{{context.value.condition0}}, {{context.value.condition1}}, and so on. This is required even if your
rule has only one condition (accessible with .condition0). Using just {{context.[Variable Name]}} evaluates
to a blank line or [object Object] depending on the action type.
-
context.value.condition[X]: This variable resolves to the detected value of conditions 0, 1, 2, and so on. -
context.value.threshold[X]: This variable resolves to the threshold values of conditions 0, 1, 2, and so on. -
context.value.metric[X]: This variable resolves to the monitored metric of conditions 0, 1, 2, and so on.
Settings
editWith metrics threshold rules, it’s not possible to set an explicit index pattern as part of the configuration. The index pattern is instead inferred from Metrics indices on the Settings page of the Metrics app.
With each execution of the rule check, the Metrics indices setting is checked, but it is not stored when the rule is created.
The Timestamp field that is set under Settings determines which field is used for timestamps in queries.