Synthetic monitoring using Docker
editSynthetic monitoring using Docker
editIn version 7.x, browser checks are in beta and will never be made generally available in 7.x.
If you want to use browser checks, we highly recommend using the latest version of browser checks available in 8.x. This functionality has changed significantly in version 8.x. We do not recommend using browser checks in 7.x anymore.
[beta] This functionality is in beta and is subject to change. The design and code is less mature than official GA features and is being provided as-is with no warranties. Beta features are not subject to the support SLA of official GA features. A customizable Docker project template is provided to get started with Elastic Synthetics quickly. This template provides two types of sample tests: a simple, two-step, inline test, and a packaged todo application with a custom suite of tests.
How does it work?
edit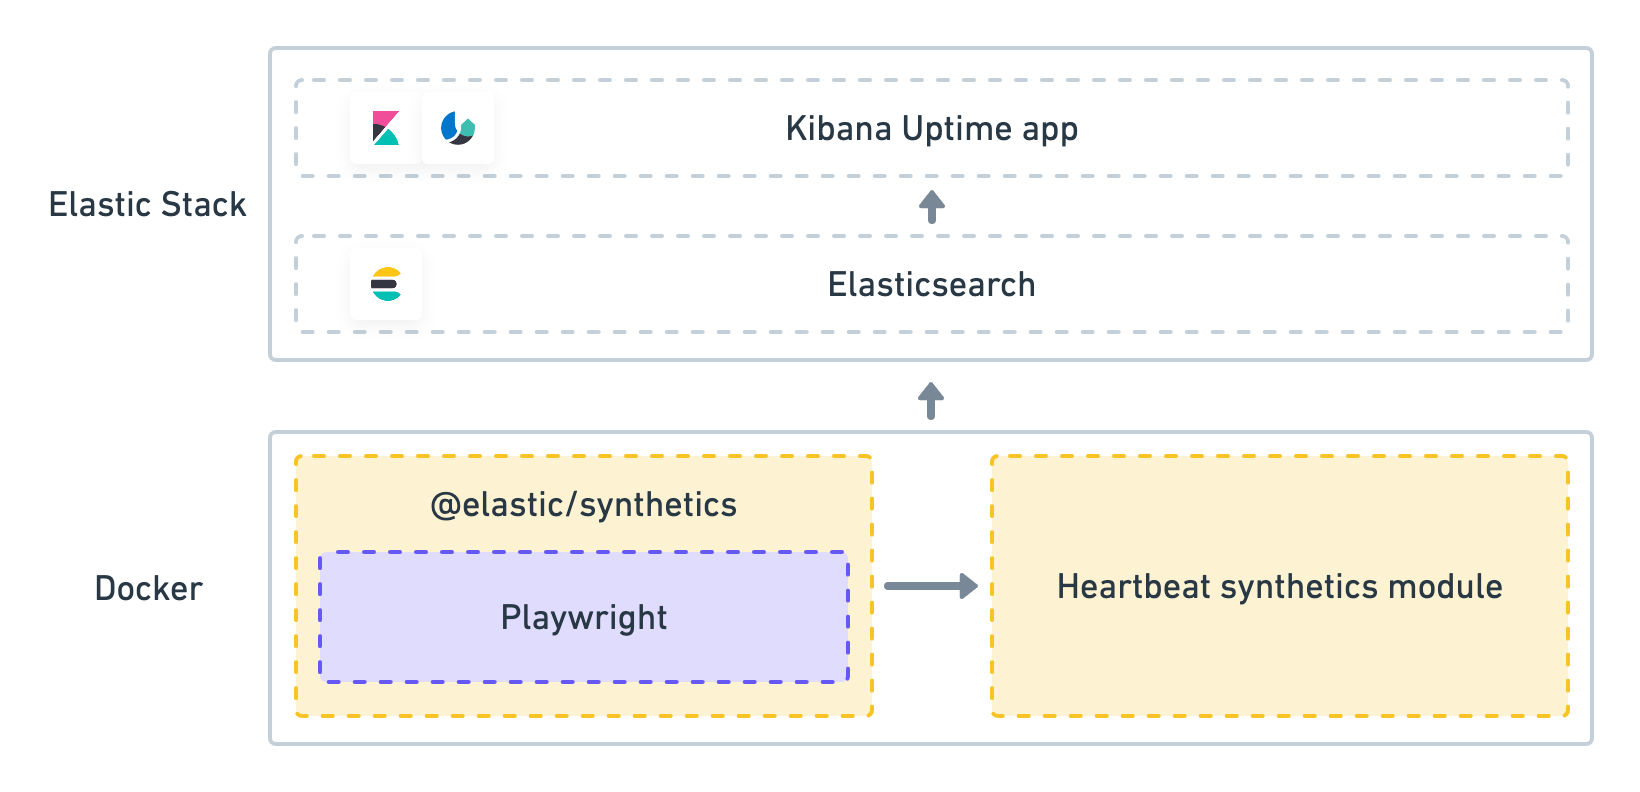
A provided Docker image spins up Heartbeat, which has the @elastic/synthetics package installed.
Heartbeat handles the scheduling of test runs and supervises the execution of the
@elastic/synthetics package.
@elastic/synthetics runs your tests by invoking the Playwright library and starting a new
browser process.
Performance data is then gathered and reported back to Heartbeat,
where it is formatted and sent to the Elastic Stack.
At this point, the data is available in the Uptime app to view, analyze, and alert on.
Step 1: Pull the latest synthetics docker image
editElastic Synthetics is regularly updated during this beta phase, even within the same version. You’ll want to ensure you’re running the latest docker image by running the command below .
docker pull docker.elastic.co/beats/heartbeat:7.17.29
Step 2: Create a heartbeat.yml configuration file
editThere are two ways to configure a synthetic test. The config file below demonstrates both.
The first entry in heartbeat.monitors uses the inline source type, where the entire synthetic journey is directly embedded in the yaml file.
The second method uses the zip_url source type, which points to a remote endpoint where synthetics tests can be downloaded with basic authentication.
For test suites Heartbeat will attempt to run all files in that directory with the extension .journey.ts or .journey.js.
See Syntax for more information.
To start, download or clone a local copy of our synthetics-demo repository
local machine, and navigate to the examples/todos folder. We’ll work inside that folder going forward.
heartbeat.monitors:
- type: browser
  id: elastic-website
  name: Elastic website
  schedule: "@every 1m"
  source:
    inline:
      script: |-
        step("load homepage", async () => {
            await page.goto('https://www.elastic.co');
        });
        step("hover over products menu", async () => {
            await page.hover('css=[data-nav-item=products]');
        });
- name: Todos
  id: todos
  type: browser
  schedule: "@every 1m"
  params:
    url: "https://elastic.github.io/synthetics-demo/"
  source:
    zip_url:
      url: "https://github.com/elastic/synthetics-demo/archive/refs/heads/main.zip"
      folder: ""todos/synthetics-tests"
      username: ""
      password: ""
|
Each |
|
|
In this example, a synthetic test is defined inline. This is a two-step script that first loads a homepage and then hovers over a product menu. See Syntax for more information. |
|
|
The params section lets you define custom parameters to use in your script. In this example the url parameter is used by the test suite to determine which site to test. |
|
|
In this example, our library of synthetic tests is downloaded from the remote zip endpoint for our todos example. |
|
|
Note that the url refers to the endpoint where the test project exists. |
|
|
Folder refers to the relative path where the synthetic journey files are located. Heartbeat will invoke the synthetics library on this folder. |
|
|
Username and password are blank here, but if provided, will be sent as HTTP Basic Authentication headers to the remote zip endpoint. |
Step 3: Run the container, connecting it to Elasticsearch
editBefore we proceed, you’ll need to retrieve your Elasticsearch credentials for either an Elastic Cloud ID or another Elasticsearch Cluster.
Elastic synthetics runs Chromium without the extra protection of its process sandbox for greater compatibility with Linux server distributions. Add the sandbox: true option to a given browser
monitor in Heartbeat to enable sandboxing. This may require using a custom seccomp policy with docker, which brings its own additional risks. This is generally safe when run against sites whose content you trust,
and with a recent version of Elastic synthetics and chromium.
The example below, run from the examples/todos directory shows how to run synthetics tests indexing data into Elasticsearch.
Run the script below to start running your synthetics tests. You’ll need to insert your actual cloud.id and cloud.auth values to successfully index data to your cluster.
docker run \
  --rm \
  --name=heartbeat \
  --user=heartbeat \
  --cap-add=NET_RAW \
  --volume="$PWD/heartbeat.yml:/usr/share/heartbeat/heartbeat.yml:ro" \
  docker.elastic.co/beats/heartbeat:7.17.29 heartbeat -e \
  -E cloud.id=cloud-id \
  -E cloud.auth=elastic:cloud-pass
If you aren’t using Elastic Cloud, replace -E cloud.id and -E cloud.auth with your Elasticsearch hosts,
username, and password:
docker run \
  --rm \
  --name=heartbeat \
  --user=heartbeat \
  --cap-add=NET_RAW \
  --volume="$PWD/heartbeat.yml:/usr/share/heartbeat/heartbeat.yml:ro" \
  docker.elastic.co/beats/heartbeat:7.17.29 heartbeat -e \
  -E output.elasticsearch.hosts=["localhost:9200"] \
  -E output.elasticsearch.username=elastic \
  -E output.elasticsearch.password=changeme
Under Docker, Heartbeat runs as a non-root user, but requires some privileged
network capabilities to operate correctly. Ensure that the NET_RAW
capability is available to the container.
Note the use of --volume option, which mount local directories into the
container. Here, we mount the heartbeat.yml from the working directory,
into Heartbeat’s expected location for heartbeat.yml.
Step 4: View in Kibana
editThat’s it! Elastic synthetics is now sending synthetic monitoring data to the Elastic Stack. Navigate to the Uptime app in Kibana, where you can see screenshots of each run, set up alerts in case of test failures, and more.
If a test does fail (shown as down in the app), you’ll be able to view the step script that failed,
any errors, and a stack trace.
See Visualize for more information.
Next steps
editNow you can customize the provided Docker example with your own tests! See Syntax to learn more.