Synthetic monitoring using Elastic Agent and Fleet
editSynthetic monitoring using Elastic Agent and Fleet
editIn version 7.x, browser checks are in beta and will never be made generally available in 7.x.
If you want to use browser checks, we highly recommend using the latest version of browser checks available in 8.x. This functionality has changed significantly in version 8.x. We do not recommend using browser checks in 7.x anymore.
Set up Fleet Server
editSynthetic monitoring via Elastic Agent and Fleet requires Fleet Server to be set up. If you are using Elastic Cloud fleet server will already be provided and you can skip this step. To learn more, see Fleet.
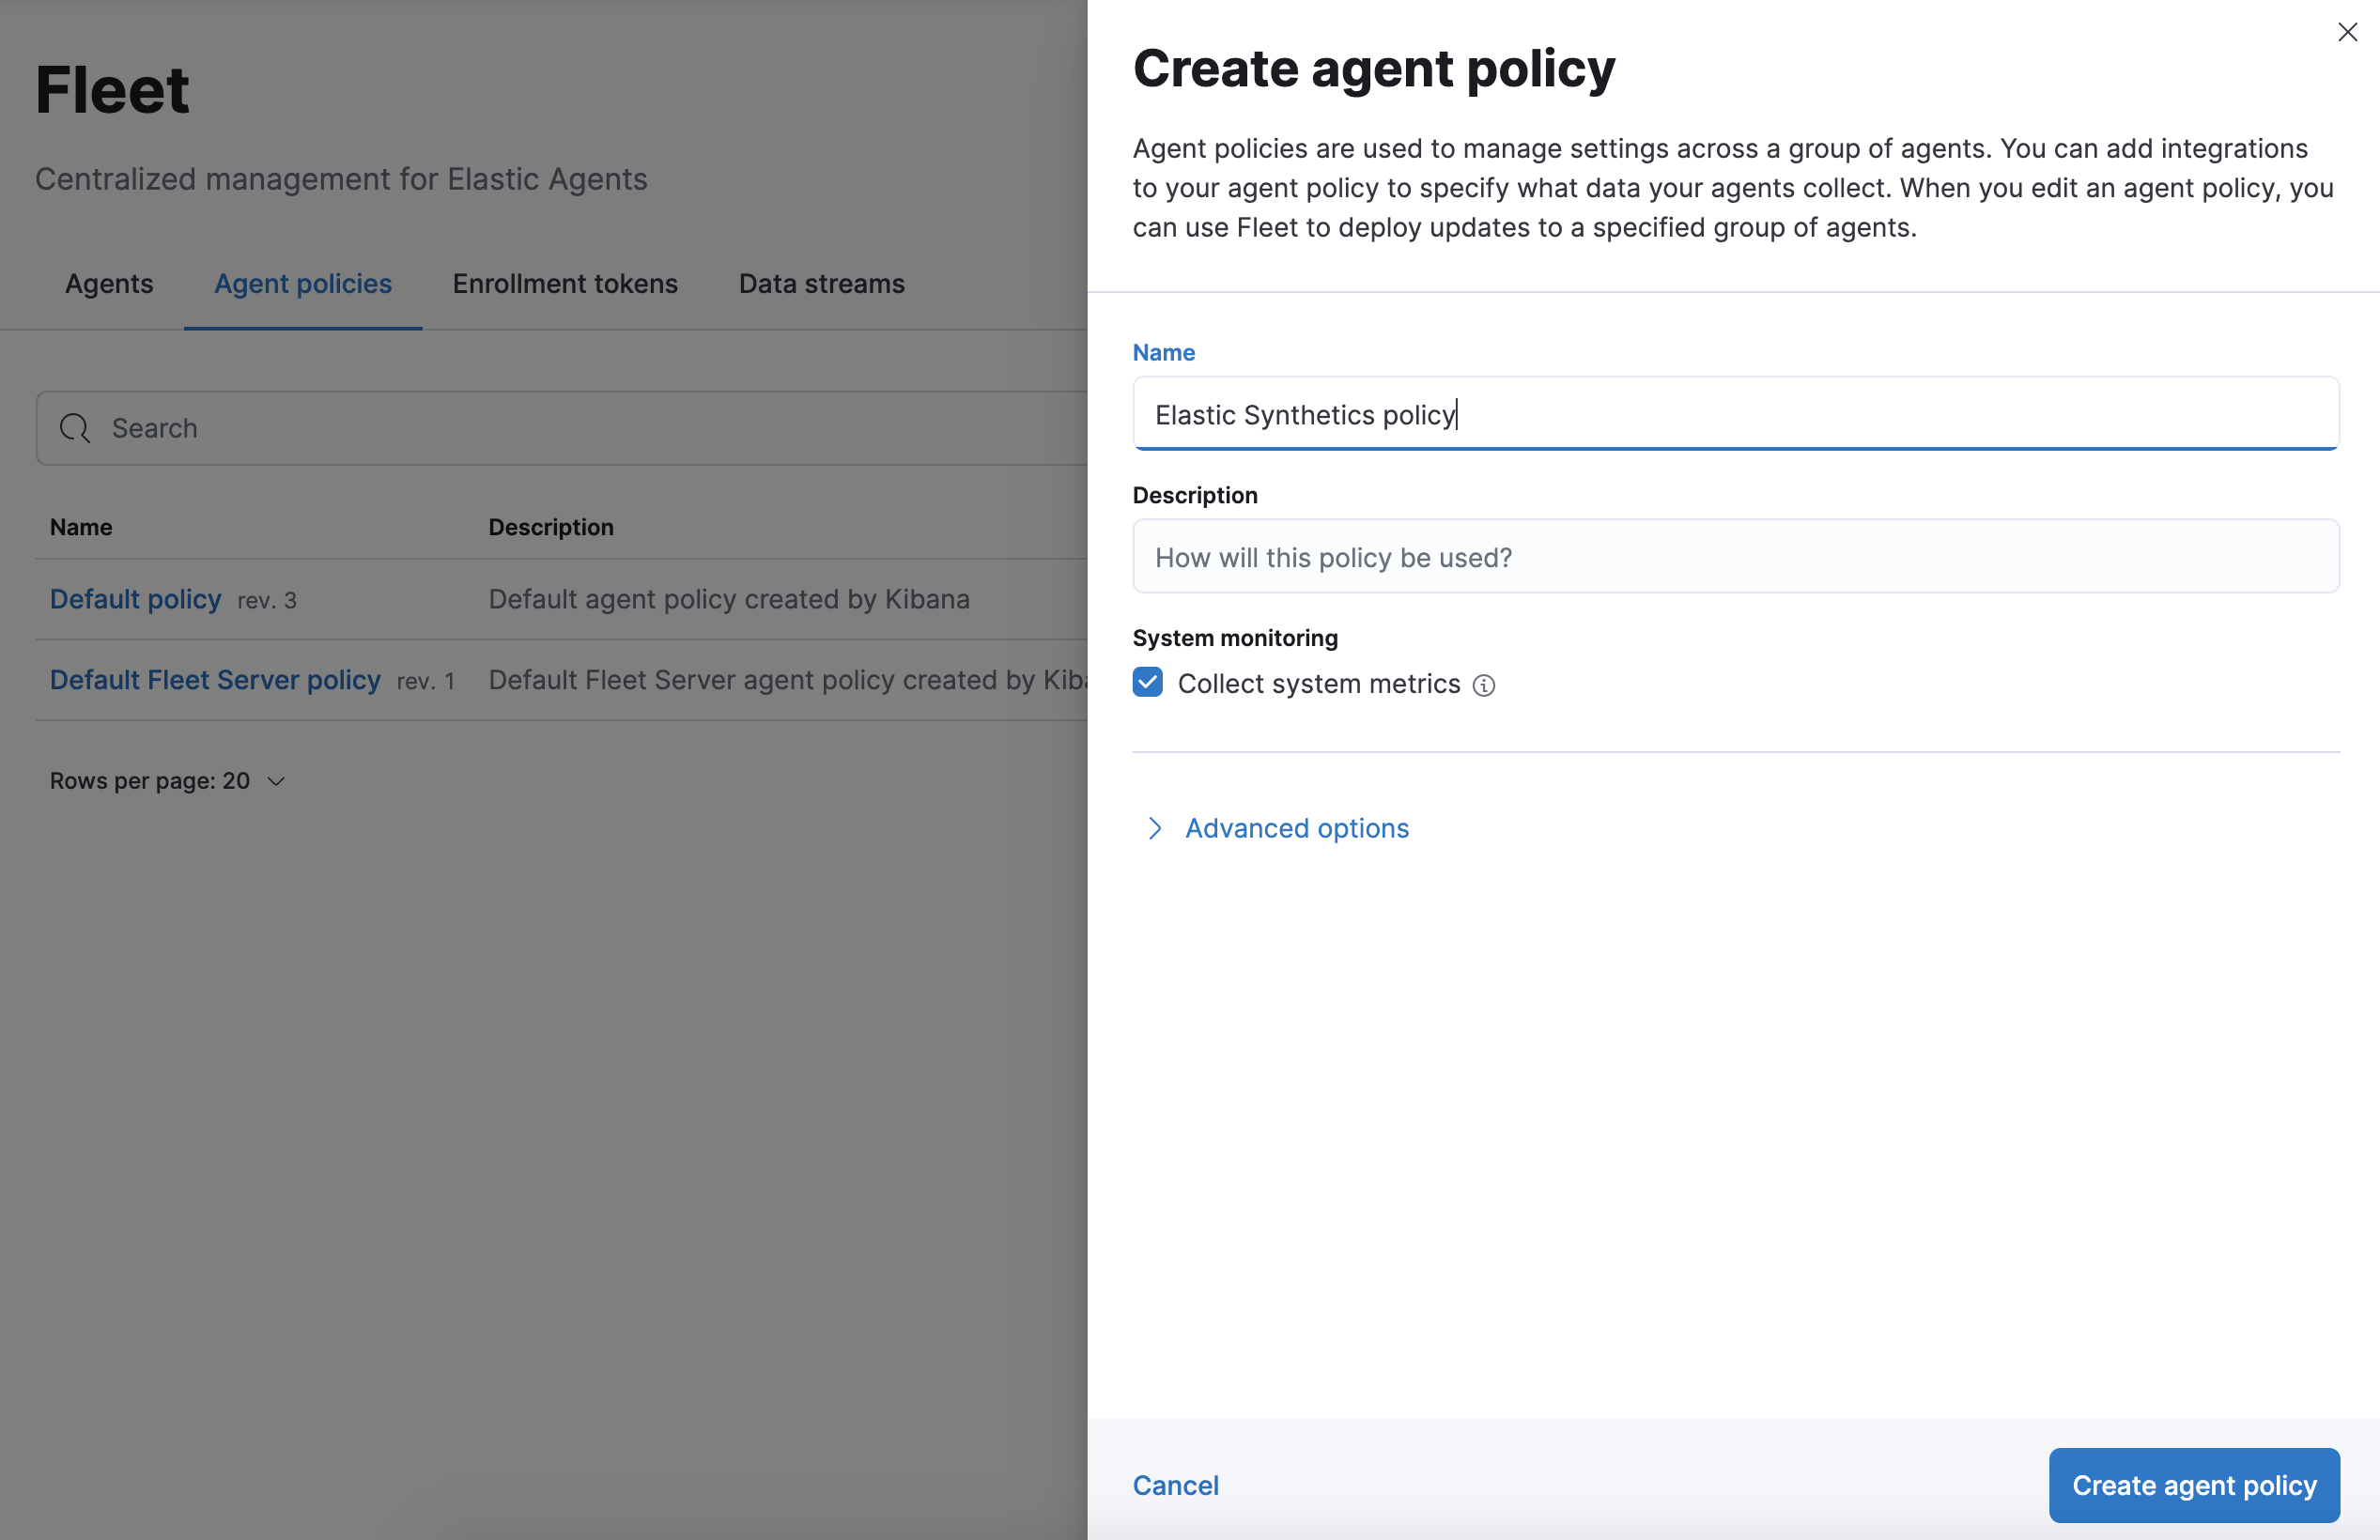
Create an agent policy for Elastic Synthetics
editUse a separate fleet policy for Synthetics monitors in most cases. It is generally the case that synthetics monitors should run on nodes dedicated to that purpose. See Elastic Agent policy for more information on Fleet policies and creating them.
Add an Elastic Agent to Fleet, using the special elastic-agent-complete container
editElastic Agent is a single, unified agent that you can deploy to hosts or containers to collect data and send it to the Elastic Stack. Behind the scenes, Elastic Agent runs Beats or Elastic Endpoint required for your configuration.
To run synthetics tests, you must use the elastic-agent-complete Docker image to create a self-hosted Elastic Agent node. This image contains the dependencies to run synthetic monitors. The standard Elastic Cloud or self-hosted Elastic Agent will not work.
To add an Elastic Agent to Fleet, you’ll need an enrollment token and the URL of your fleet server. You can use the default enrollment token for your policy or create new enrollment tokens as needed. To learn more, see Run Elastic Agent in a container and Fleet enrollment tokens for more information.
You may need to set additional environment variables. See the Elastic Agent environment variables guide for more information. See Run Elastic Agent in a container for more information on running Elastic Agent with Docker.
Configure an Elastic Synthetics integration policy
edit[beta] This functionality is in beta and is subject to change. The design and code is less mature than official GA features and is being provided as-is with no warranties. Beta features are not subject to the support SLA of official GA features. Elastic Synthetics tests can be configured through Fleet using the Elastic Synthetics integration. To learn more, see Elastic Synthetics.
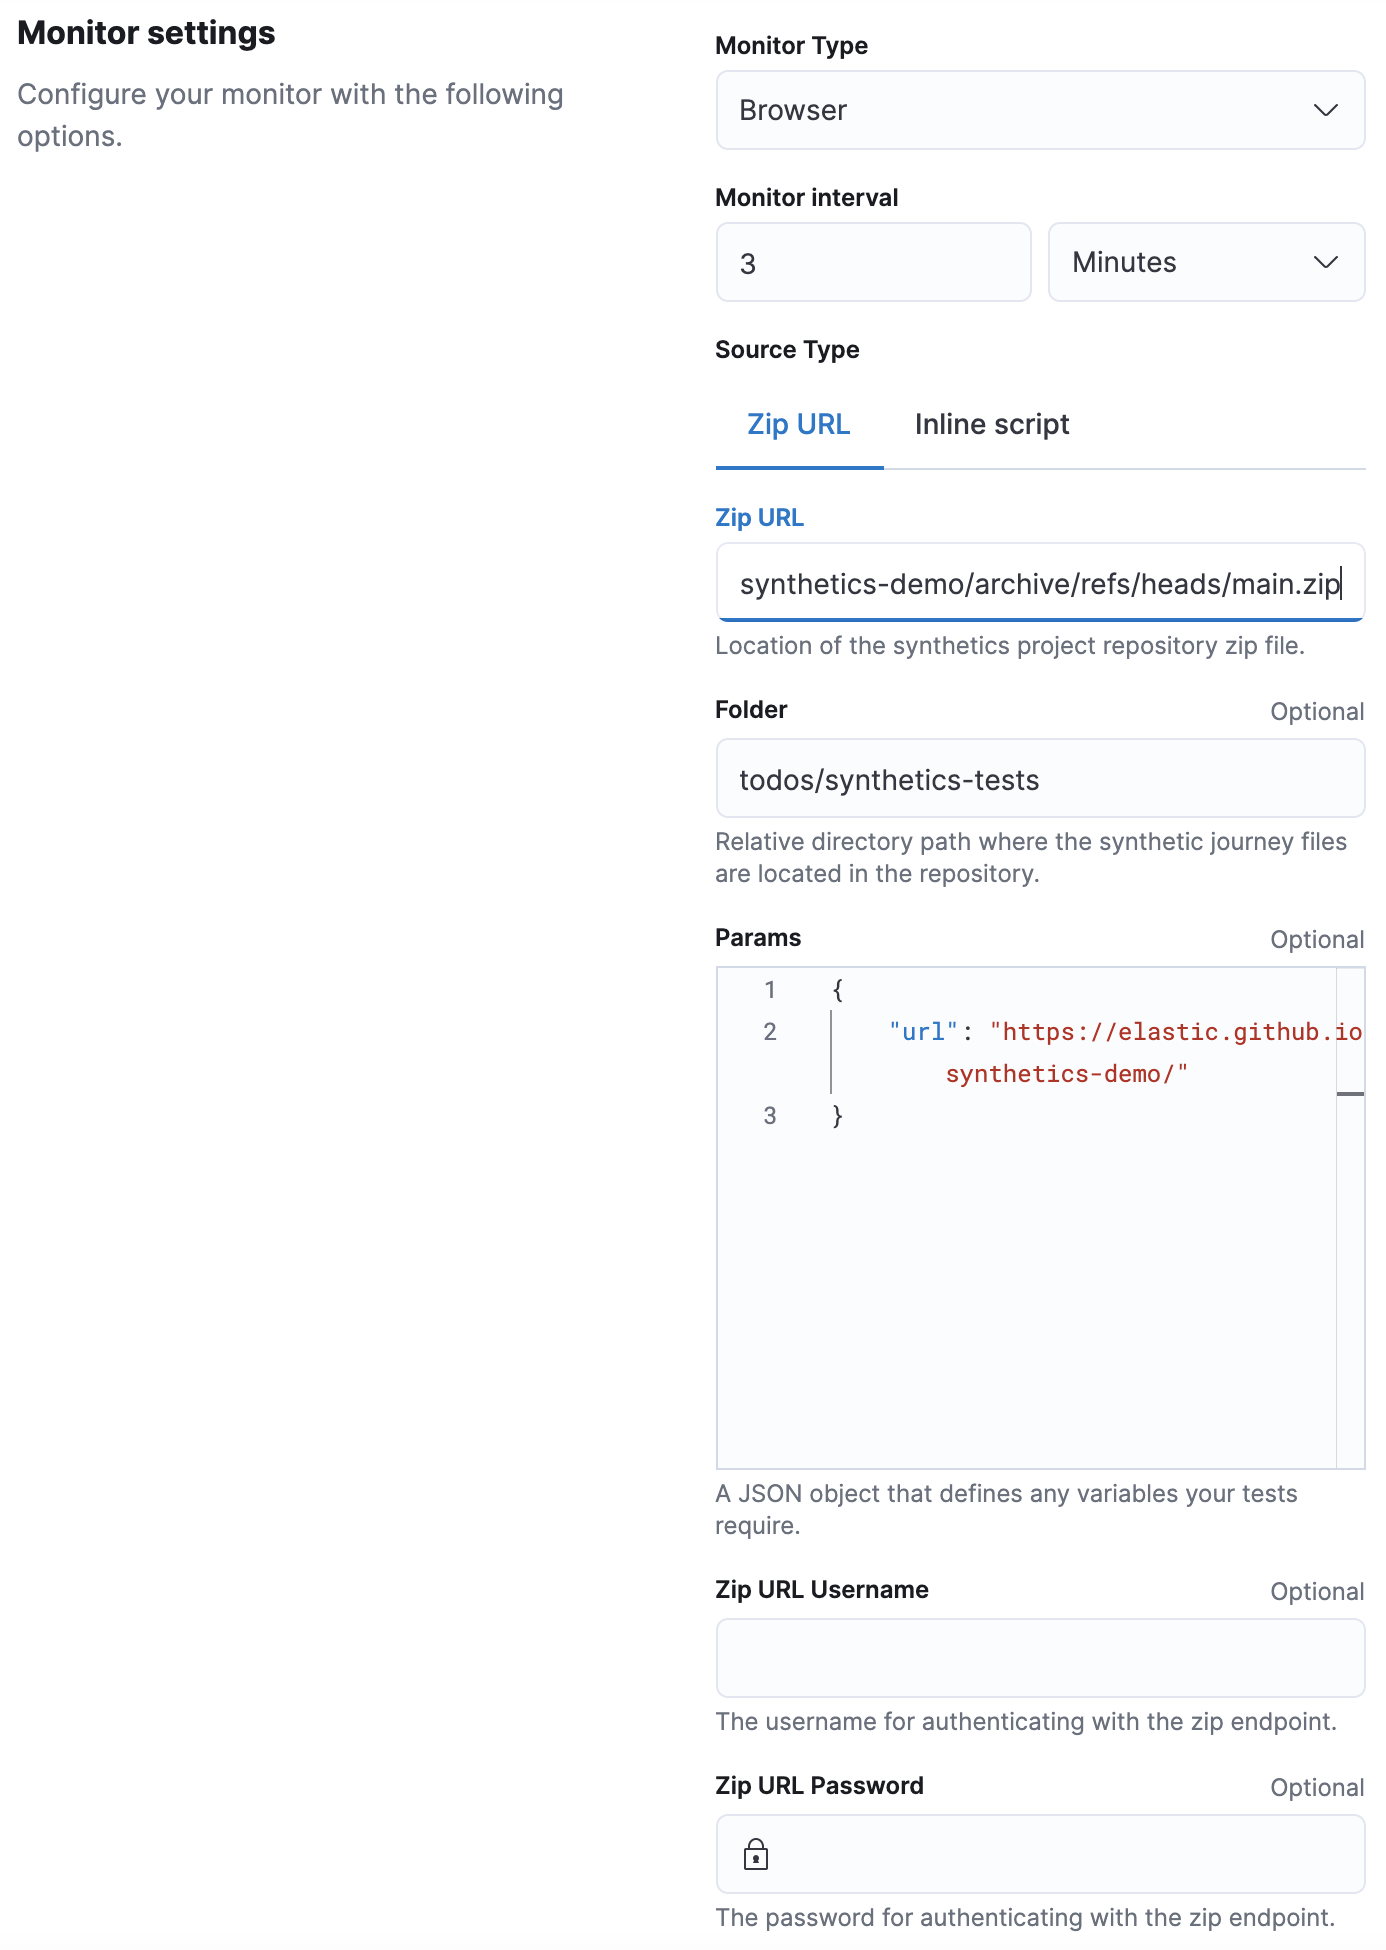
In the example above, our library of synthetic tests is downloaded from the remote zip endpoint for our todos example. The fields should be set as follows:
- Zip URL: URL pointing to a zip file containing the test project.
- Folder: The folder within the zip file containing synthetics tests, this will be the working directory in which the synthetics agent will be run. Heartbeat will invoke the synthetics library in this folder.
- Zip URL Username and Zip URL Password HTTP Basic Authentication headers for the remote zip endpoint.
- Params JSON formatted dynamic values that may be required by your specific tests. See Working with parameters and secrets for more information.
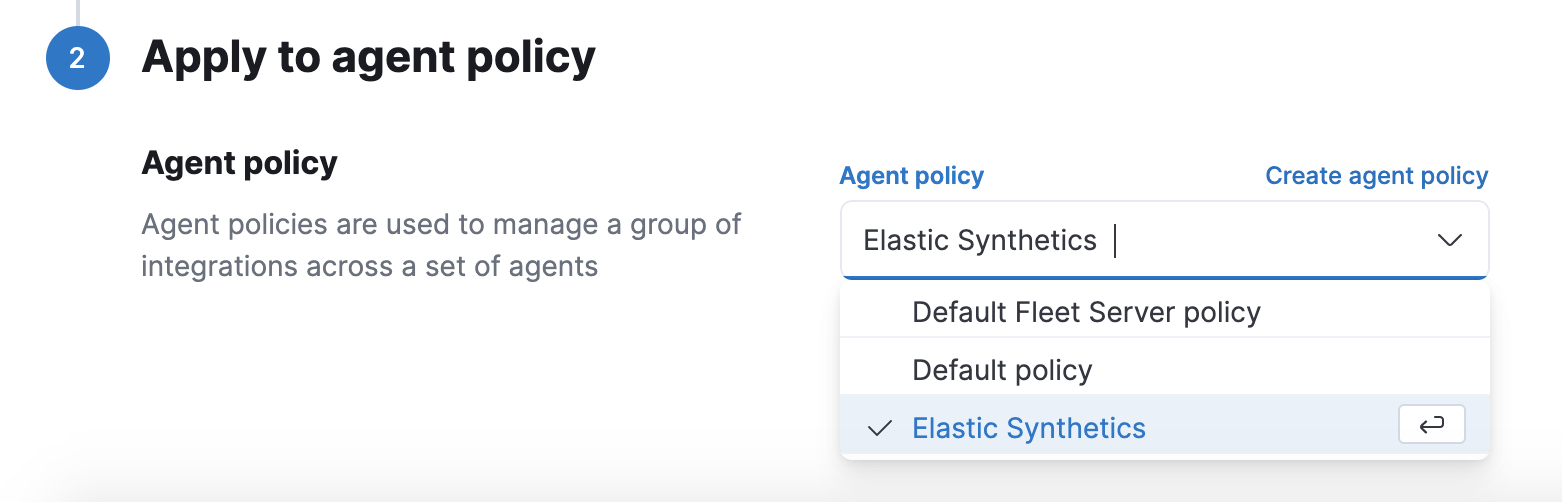
When applying the integration policy to an Elastic Agent policy, make sure to select your dedicated synthetics agent policy.
View in Kibana
editThat’s it! Elastic synthetics is now sending synthetic monitoring data to the Elastic Stack. Navigate to the Uptime app in Kibana, where you can see screenshots of each run, set up alerts in case of test failures, and more.
If a test does fail (shown as down in the app), you’ll be able to view the step script that failed,
any errors, and a stack trace.
See Visualize for more information.