Inspect metric anomalies
editInspect metric anomalies
editWhen the anomaly detection features of machine learning are enabled, you can create machine learning jobs to detect and inspect memory usage and network traffic anomalies for hosts and Kubernetes pods.
You can model system memory usage, along with inbound and outbound network traffic across hosts or pods. You can detect unusual increases in memory usage, and unusually high inbound or outbound traffic across hosts or pods.
Enable machine learning jobs for hosts or Kubernetes pods
editCreate a machine learning job to detect anomalous memory usage and network traffic automatically.
Once the machine learning jobs are created, these settings can not be changed. You can recreate these jobs later. However, any previously detected anomalies are removed.
- In the side navigation, click Observability > Metrics > Anomaly detection.
- You’ll be prompted to create a machine learning job for Hosts or Kubernetes Pods.
-
Choose a start date for the machine learning analysis.
Machine learning jobs analyze the last four weeks of data and continue to run indefinitely.
-
Select a partition field.
By default, the Kubernetes partition field
kubernetes.namespaceis selected.Partitions allow you to create independent models for different groups of data that share similar behavior. For example, you may want to build separate models for machine type, or cloud availability zone, so that anomalies are not weighted equally across groups.
- Click Enable Jobs.
- You’re now ready to explore your metric anomalies. Click View anomalies to view the Anomaly Explorer in Machine Learning.
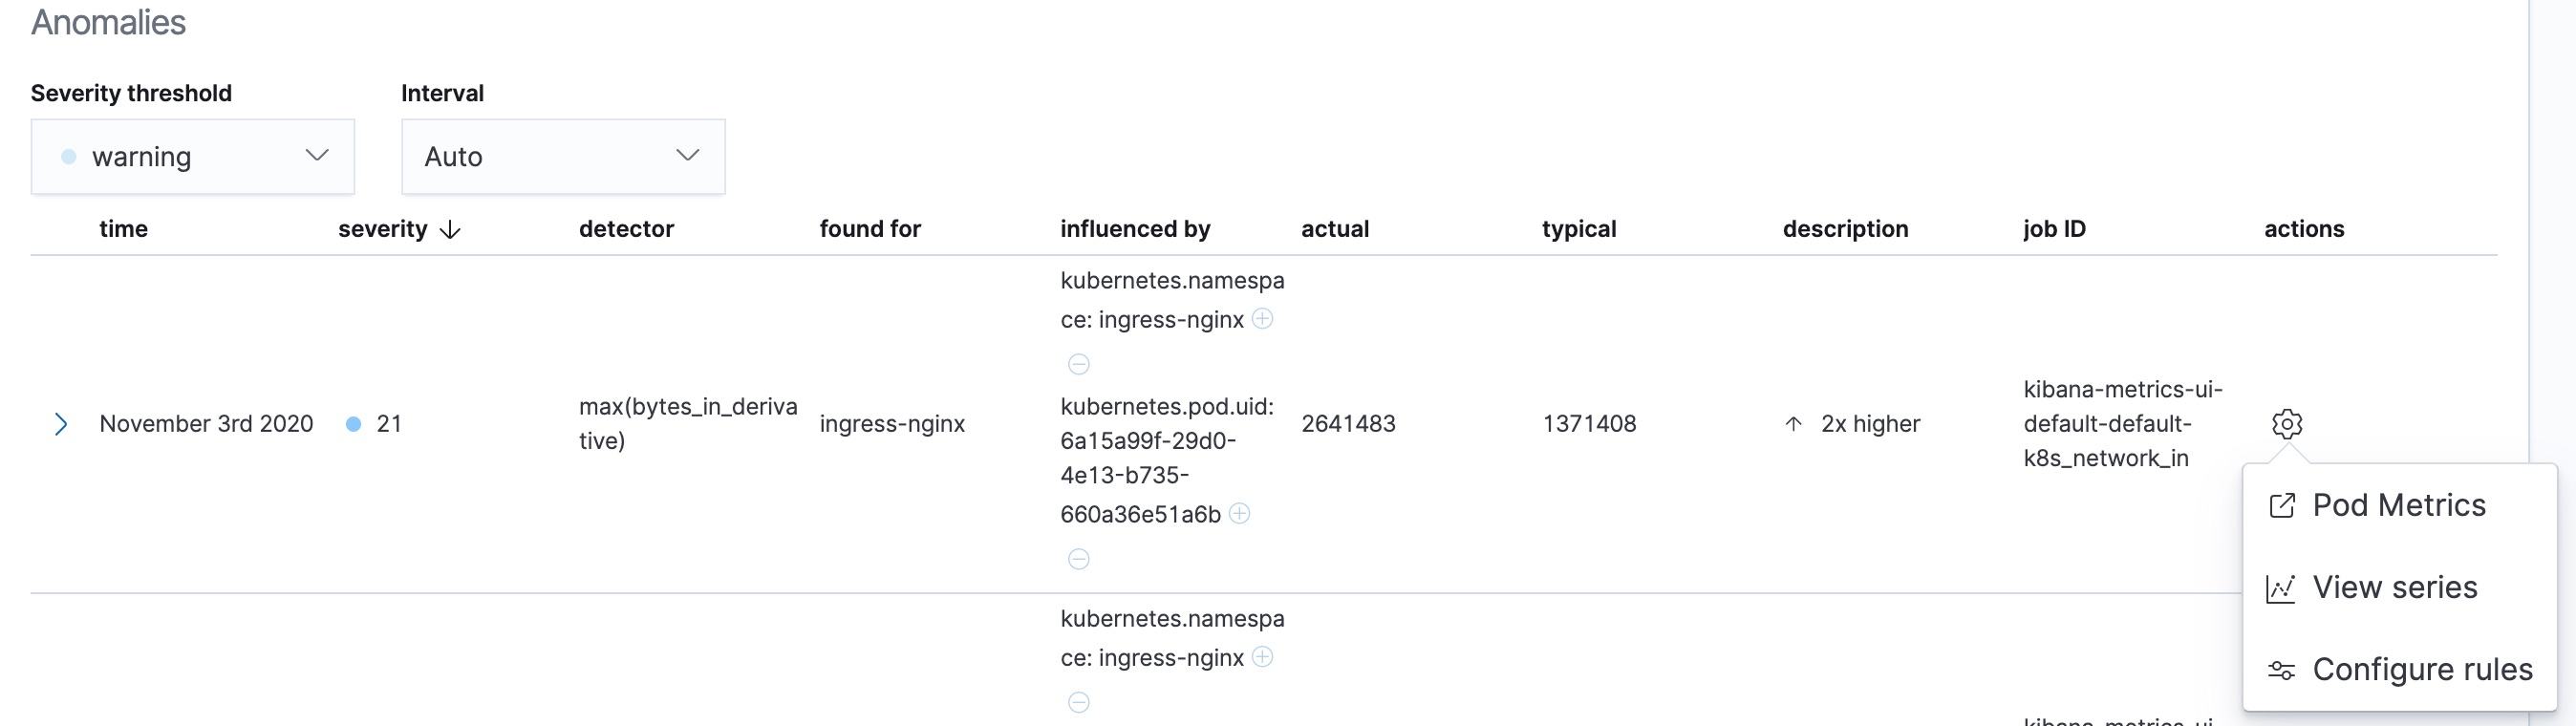
These pre-defined anomaly detection jobs use custom rules. To update the rules in the Anomaly Explorer, select actions > Configure rules. The changes only take effect for new results. If you want to apply the changes to existing results, clone and rerun the job.
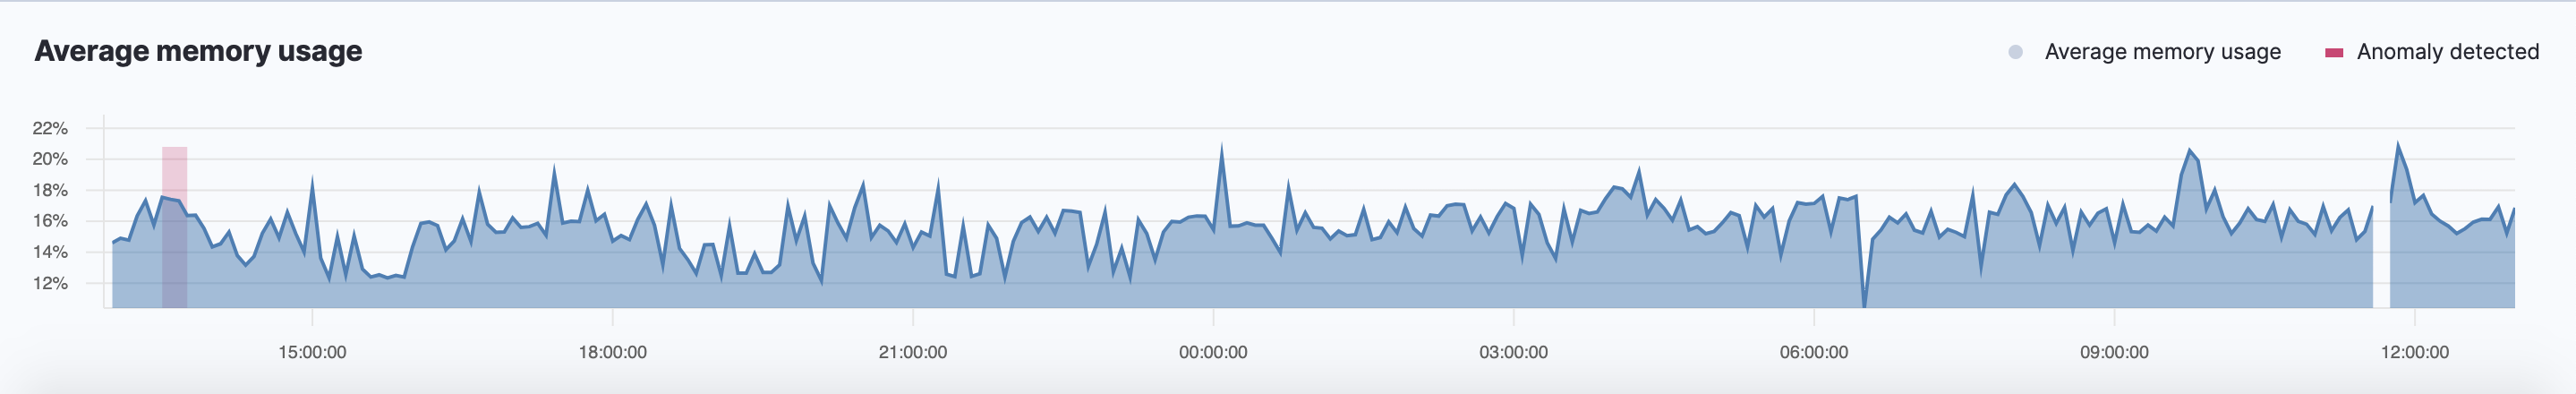
History chart
editOn the Inventory page, click Show history to view the metric values within the selected time frame. Detected anomalies with an anomaly score equal to 50, or higher, are highlighted in red. To examine the detected anomalies, use the Anomaly Explorer.