Categorize log entries
editCategorize log entries
editApplication log events are often unstructured and contain variable data. Many log messages are the same or very similar, so classifying them can reduce millions of log lines into just a few categories.
Within the Logs app, the Categories page enables you to identify patterns in your log events quickly. Instead of manually identifying similar logs, the logs categorization view lists log events that have been grouped based on their messages and formats so that you can take action quicker.
Create log categories
editCreate a machine learning job to categorize log messages automatically. Machine learning will observe the static parts of the message, cluster similar messages, and classify them into message categories.
Analyze log categories
editHere we see the Categories page, which lists various log categories from
elasticsearch.server logs, along with the maximum anomaly score on the right.
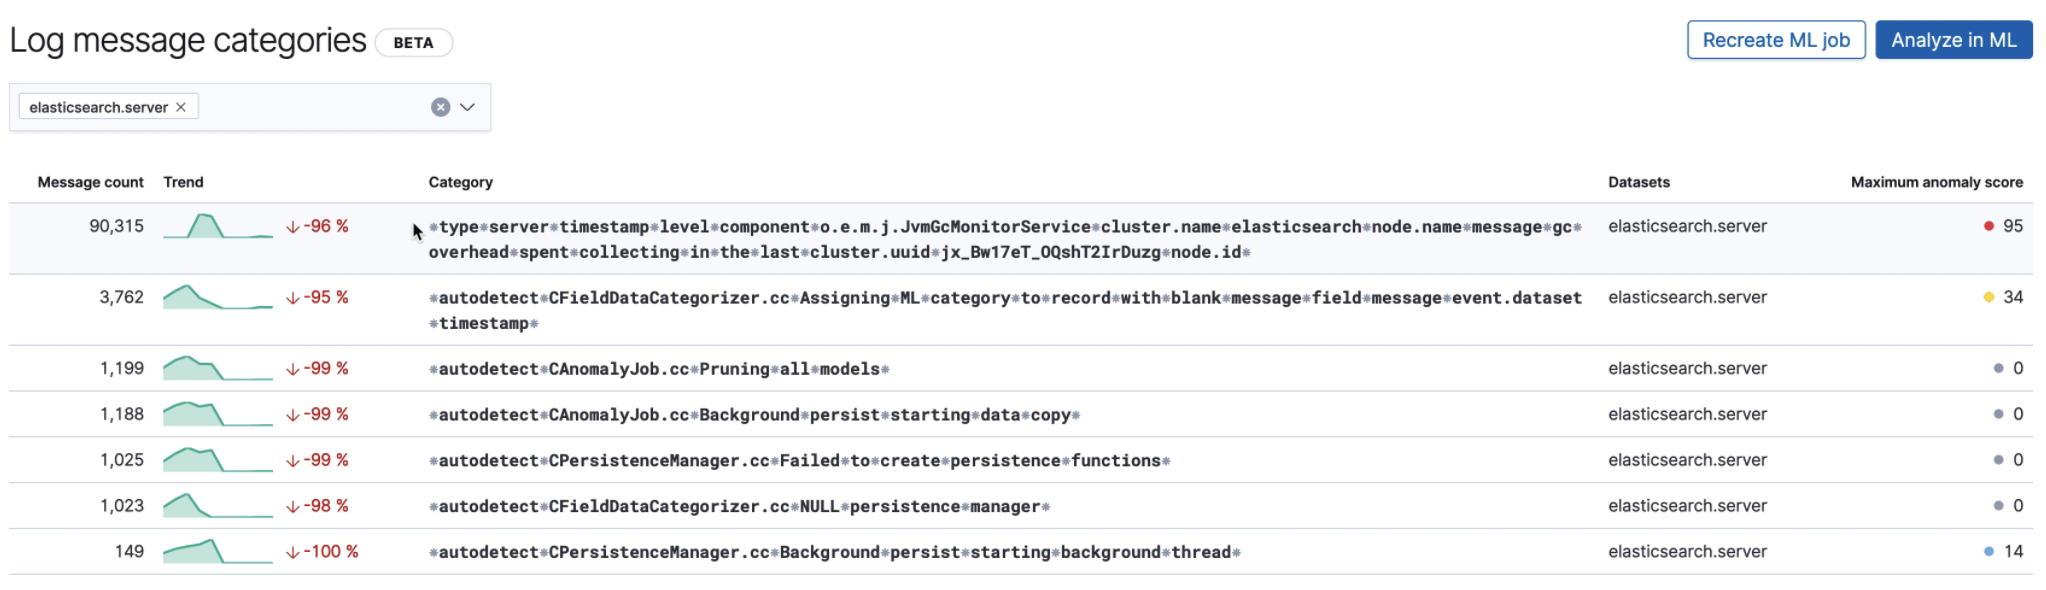
The highlighted log category has a very high anomaly score, and looks like this:
⁕type⁕server⁕timestamp⁕level⁕component⁕o.e.m.j.JvmGcMonitorService⁕cluster.name
⁕elasticsearch⁕node.name⁕message⁕gc⁕overhead⁕spent⁕collecting⁕in⁕the⁕last⁕cluster.uuid⁕
jx_Bw17eT_OQshT2IrDuzg⁕node.id⁕
Here is an example of a log line in this category:
[elasticsearch.server][INFO] {"type": "server", "timestamp": "2020-01-31T22:51:03,633Z",
"level": "INFO", "component": "o.e.m.j.JvmGcMonitorService", "cluster.name": "elasticsearch",
"node.name": "elasticsearch-master-0", "message": "[gc][411617] overhead, spent [316ms]
collecting in the last [1s]", "cluster.uuid": "jx_Bw17eT_OQshT2IrDuzg", "node.id": "JwIW6wI2T6WsgpoaUB3eaA" }
The anomaly indicates an unexpected slow down of garbage collection runs, which could indicate low JVM memory problems impacting Elasticsearch performance.
Suppose you were already alerted about low JVM memory through the monitoring setup. In that case,
logs categorization makes it easier to find the root cause by indicating the above category
of stopped garbage collection.