Create an infrastructure threshold alert
editCreate an infrastructure threshold alert
editBased on the resources that are listed on the Inventory page within the Metrics app, you can create a threshold alert to notify you when a metric has reached or exceeded a value for a specific resource or for a group of resources within your infrastructure.
Additionally, each alert can be defined using multiple conditions that combine metrics and thresholds to create precise notifications and reduce false positives.
- To access this page, go to Observability > Metrics.
- On the Inventory page, click Alerts > Create alert.
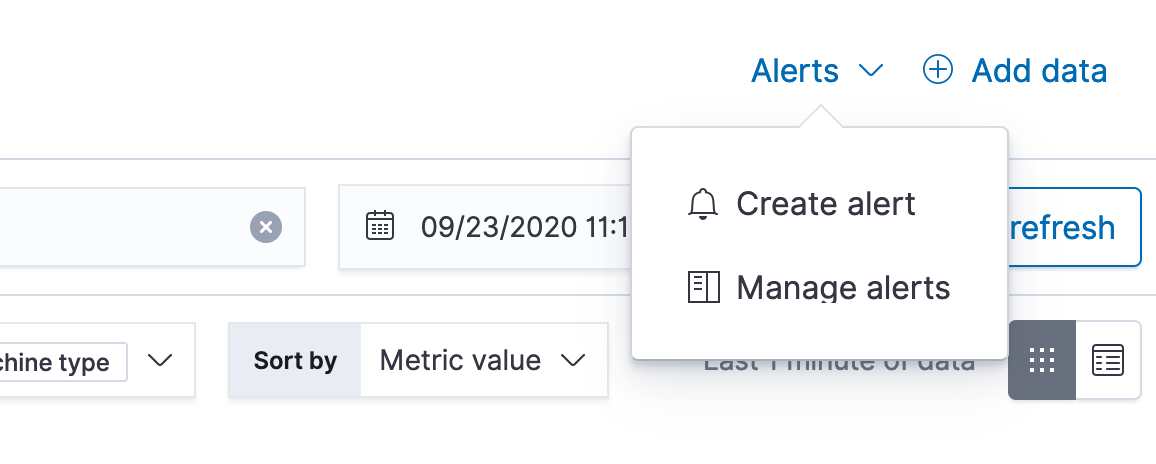
When you select Create alert, the alert will automatically be populated with the same parameters that you’ve configured on the Inventory page. You can use the Inventory view to first visualize which nodes in your infrastructure you’d like to be notified about, and then quickly create an alert in just a few clicks.
Inventory conditions
editConditions for each alert can be applied to specific metrics relating to the inventory type you select. For example, when you select Docker containers, you can add conditions for the CPU usage, memory usage, inbound traffic, and the outbound traffic metrics. When creating the alert, you can select to still get notified if no data is returned for the specific metric, or if the alert fails to query Elasticsearch.
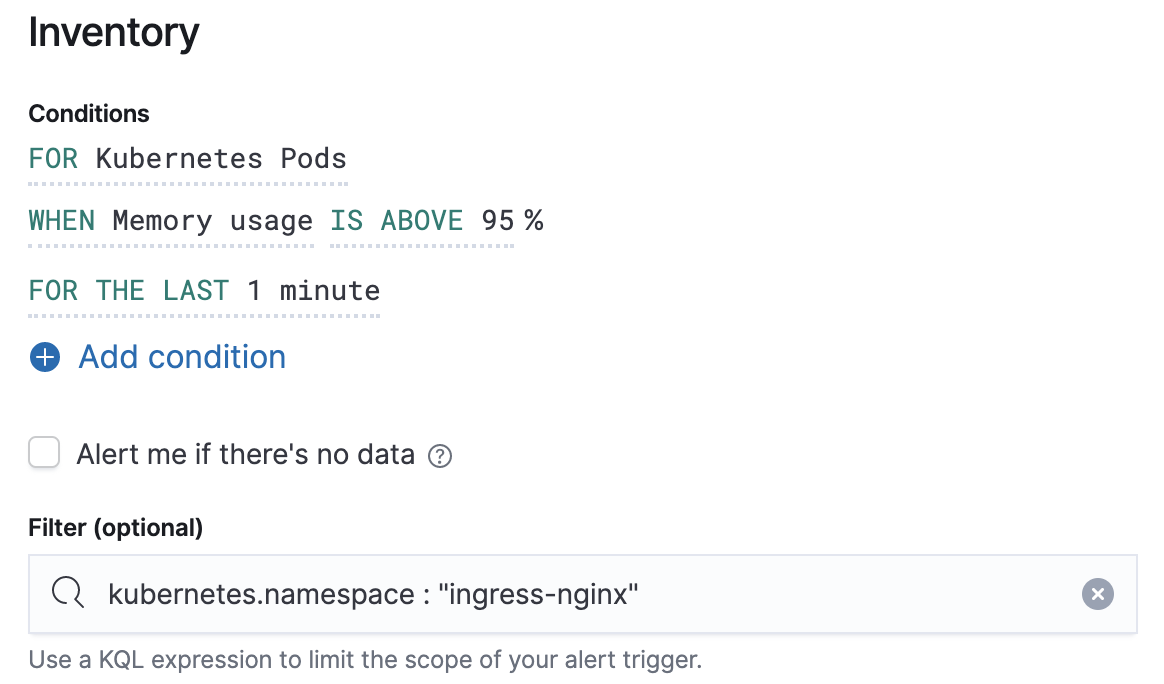
In this example, Kubernetes Pods is the selected inventory type. The conditions state that an alert is triggered
if memory usage is above 95% for any of the pods within the ingress-nginx namespace.
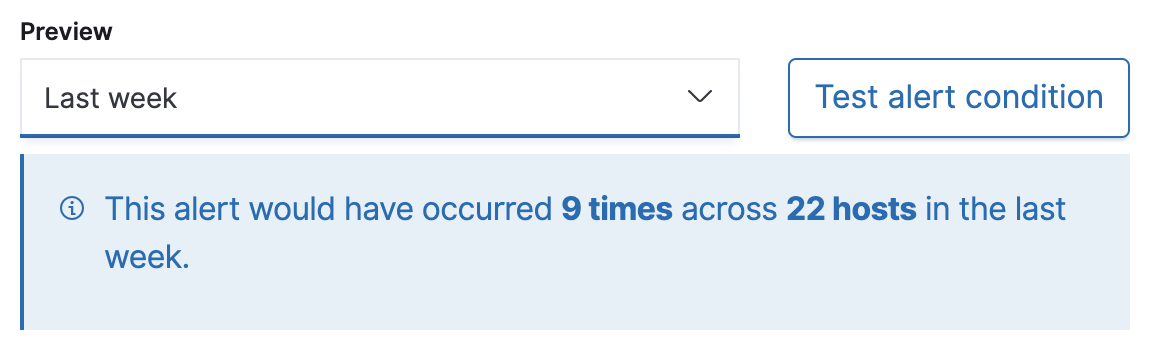
Before creating an alert, you can preview whether the alert would have been triggered in the last hour, day, week, or month.
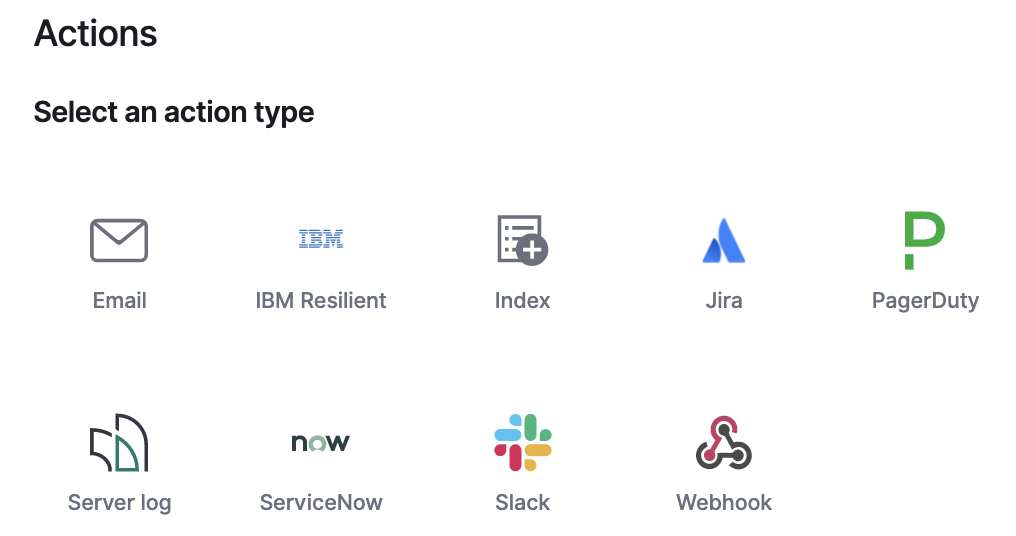
Action types
editYou can extend your alerts by connecting them to actions that use the following supported built-in integrations.
Action variables
editThis section details the variables that infrastructure threshold alerts will send to your actions.
Basic variables
edit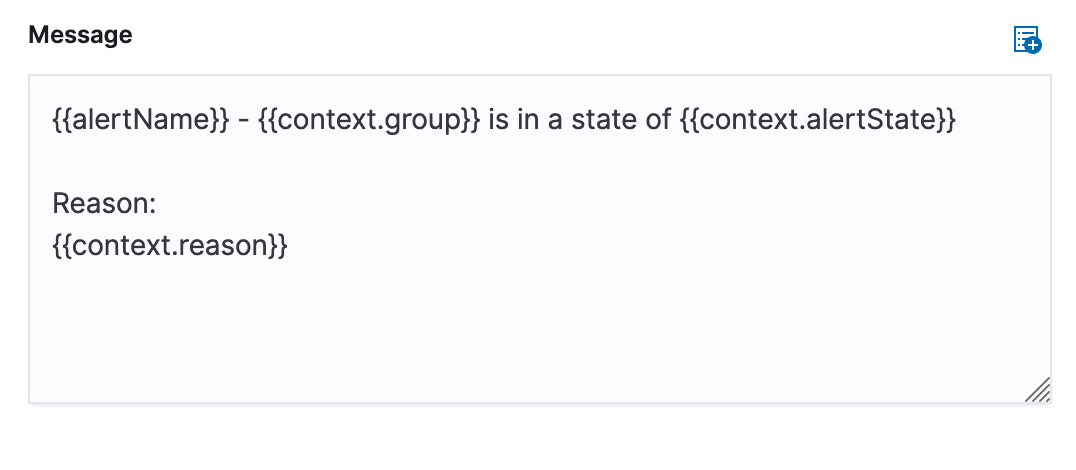
The default message for an infrastructure threshold alert displays the basic variables you can use.
-
context.group: This variable resolves to the group that the alert’s condition detected. For inventory alerts, this is the name of a monitored host, pod, container, etc. For metric threshold alerts, this is the value of the field specified in the Create alert per field or*if the alert is configured to aggregate your entire infrastructure. -
context.alertState: Depending on why the action is triggered, this variable resolves toALERT,NO DATA, orERROR.ALERTmeans the alert’s condition is detected,NO DATAmeans that no data was returned for the time period that the alert queried, andERRORindicates an error when querying the data. -
context.reason: This variable describes why the alert is in its current state. For each of the alert’s conditions, it includes the detected value of the monitored metric, and a description of the threshold. -
context.timestamp: This variable resolves to the timestamp of when the alert was evaluated.
Advanced variables
edit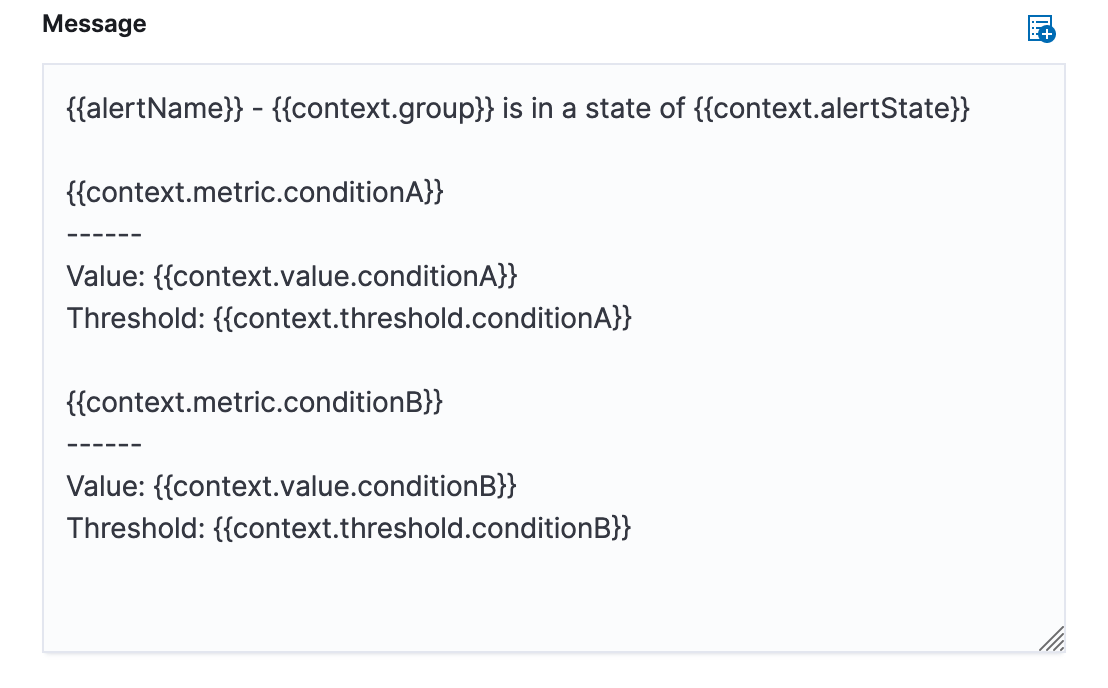
Instead of using context.reason to provide all the information you need, there may be cases when you’d like to customize your action message. Infrastructure threshold alerts provide advanced context variables that have a tree structure.
These variables must use the structure of {{context.[Variable Name].condition[Number]}}. For example, {{context.value.condition0}}, {{context.value.condition1}}, and so on. This is required even if your alert has only one condition (accessible with .condition0). Using just {{context.[Variable Name]}} evaluates to a blank line or [object Object] depending on the action type.
-
context.value.condition[X]: This variable resolves to the detected value of conditions 0, 1, 2, etc. -
context.value.threshold[X]: This variable resolves to the threshold values of conditions 0, 1, 2, and so on. -
context.value.metric[X]: This variable resolves to the monitored metric of conditions 0, 1, 2, and so on.
Settings
editWith infrastructure threshold alerts, it’s not possible to set an explicit index pattern as part of the configuration. The index pattern is instead inferred from Metrics indices on the Settings page of the Metrics app.
With each execution of the alert check, the Metrics indices setting is checked, but it is not stored when the alert is created.
The Timestamp field that is set under Settings determines which field is used for timestamps in queries.