Getting Started
editGetting Started
editThis getting started guide walks you through installing Marvel and using the Marvel Kibana app to monitor your Elasticsearch cluster. This simple installation stores data in the cluster that you are monitoring. In production, set up a separate monitoring cluster so you can still access your monitoring data if there’s a serious problem with the cluster you’re monitoring.
To install Marvel:
-
Install the Marvel agent plugin on each node in your cluster:
-
Run
bin/plugin installfromES_HOMEto install the License plugin:bin/plugin install license
-
Run
bin/plugin installto install the Marvel agent plugin.bin/plugin install marvel-agent
If you are using a DEB/RPM distribution of Elasticsearch, run the installation with superuser permissions. To perform an offline installation, download the Marvel binaries.
Marvel stores metrics in automatically-created Elasticsearch indices. If you have disabled automatic index creation, you need to configure
action.auto_create_indexto allow Marvel to create indices. For more information, see Enabling Marvel to Create Indices. -
Start Elasticsearch.
bin/elasticsearch
-
-
Install the Marvel app into Kibana by running
bin/kibana pluginin your Kibana installation directory. If you need to install Kibana, see Getting Kibana Up and Running.bin/kibana plugin --install elasticsearch/marvel/2.2.1
-
Start Kibana by running
bin/kibana. -
To verify your Marvel installation, point your web browser at
http://0.0.0.0:5601/to open Kibana, click the App Switcher icon in the Kibana menu bar, and select Marvel.
Marvel should display a list of the clusters you are monitoring.
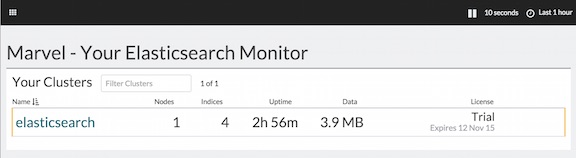
Now you’re ready to use Marvel to monitor and analyze your Elasticsearch nodes!